Please register to participate in our discussions with 2 million other members - it's free and quick! Some forums can only be seen by registered members. After you create your account, you'll be able to customize options and access all our 15,000 new posts/day with fewer ads.
Posted on Feb 17 2014 - 5:07 pm by stevekahnwgntv
The snow continues to fall this afternoon, though at lighter intensity as the season’s latest snowfall blasts the city.
With 5.2 inches of new snow today Midway Airport’s seasonal snowfall total has reached 72.2 inches making it the only the 4th time that the South Side airport has reached the 70-inch level in a snow season since 1928-29.
Officially at O’Hare International Airport
Snowfall so far today through 5pm 4.0 inches bringing the city’s OFFICIAL season’s total to 66.9 inches elevating the 2013-14 season to the 5th season snowiest on record with still a lot of winter to go.
Chicago’s seasonal snow totals at the official station since 1884-85
1.. 1978-79 89.7 inches
2.1977-78 82.3 inches
3. 1969-70 77.0 inches
4. 1966-67 68.4 inches
5. 2013-14 66.9 inches and counting (through 5pm February 17th)
6. 1951-52 66.4 inches
2013-14 The 4th snowiest winter at Midway Airport since 1928-29..
1.1978-79 89.7 inches
2. 1977-78 82.3 inches
3. 1969-70 77.0 inches
4. 2013-14 72.2 inches and counting (through 5pm February 17th)
Why is winter coming back? This is one reason. Stratosphere was cooling off but now warming up which leads to colder surface in those areas where its warming.
I strongly suggest watching the long video below to understand how our weather is driven by things such as this.
Might want to calculate the correlation between the winter temperature anomalies of Western/Central Europe and Eastern/Central US to see if it's negative, positive or neutral. My guess is that it's positive, but not strongly so.
It's not easy to find data for large areas, so I compared Chicago and Warsaw as they're rather centrally located, respectively in the Central-Eastern US and Central Europe. The average is just the 1951-2010 one. The correlation, as I expected, is slightly positive (correlation coefficient of 0.3). Kinda visible on the graph.
Btw, over that period, the biggest season-wide anomalies, both hot and cold, were recorded in Warsaw, not in Chicago. Gets to show that the Midwest is not the only area capable of large temperature anomalies. Winter 1962-1963 was 12°F below normal in Warsaw.
Winter 2009-2010 didn't have a really impressive anomaly in Warsaw, despite all the media hype. 2005-2006 was colder, beaten by 2002-2003. The coldest post-80s winter was 1995-1996.
The European location featured a strong winter warming trend, while temps in the American one were stagnant. Though linear regressions over 60-year periods are probably not the best tool at assessing temperature evolution.
Interesting. Did you build that chart? Or is there a website? I somehow feel that the trend line for Midway is off. Pretty sure that the three month winter period has seen much larger and positive trends. I'm going to look into it.
So far I found this. Division 2 is Chicago but not necessarily Midway. It's threaded to go back 100+ years.
Quote:
Cold pattern would reverse trend of recent decades
January 23, 2007|By Tom Skilling
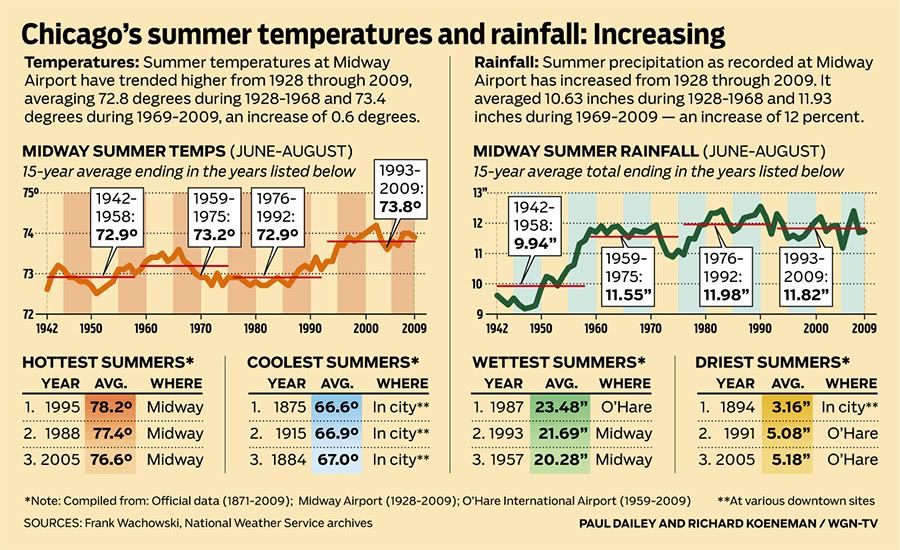
Winters have warmed dramatically in Chicago over recent decades. At Midway Airport, the average December through February temperature--the period referred to as meteorological winter -- increased 5 (degrees) from the 1970s to the 1990s. An analysis of Chicago's winter temperatures reveals the greatest proportion of the warming recorded during that period occurred in Januarys and Februarys. That's why indications of a major shift to colder weather this weekend through the remaining days of January and the opening week of February are so interesting. That would reverse the trend observed in recent decades for many winters to hit hard early, then ease dramatically.
It's not easy to find data for large areas, so I compared Chicago and Warsaw as they're rather centrally located, respectively in the Central-Eastern US and Central Europe. The average is just the 1951-2010 one. The correlation, as I expected, is slightly positive (correlation coefficient of 0.3). Kinda visible on the graph.
Great graphs, though it might be useful to have another statistic comparing the correlation between two more closer together stations, say NYC and Chicago, to get a handle of how much correlation would be expected within the same climate region (as in the Central-Eastern US) and therefore how large a 0.3 correlation coefficient for climate. I suspect if you compared two stations facing the North Atlantic, say NYC and Paris, the correlation would be higher since the NAO index stronger.
I made a thread about correlations between weather stations.
I calculated the correlations between Amherst, MA and New York, NY. Unsurprisingly, the correlation was high but interestingly much higher in January (r^2 = .86) than July (r^2 = .49).
Interesting. Did you build that chart? Or is there a website? I somehow feel that the trend line for Midway is off. Pretty sure that the three month winter period has seen much larger and positive trends. I'm going to look into it.
Both graphs look about the same, note the scale is Celsius in Rozenn's and Fahrenheit in yours.
Both graphs look about the same, note the scale is Celsius in Rozenn's and Fahrenheit in yours.
But the trend line for Midway is near 0C for the winter since 1952. I'm going to look into that. Seems off imo, but maybe the 70's cold period and the 90's warm period balance each other out...
Please register to post and access all features of our very popular forum. It is free and quick. Over $68,000 in prizes has already been given out to active posters on our forum. Additional giveaways are planned.
Detailed information about all U.S. cities, counties, and zip codes on our site: City-data.com.

 Please register to participate in our discussions with 2 million other members - it's free and quick! Some forums can only be seen by registered members. After you create your account, you'll be able to customize options and access all our 15,000 new posts/day with fewer ads.