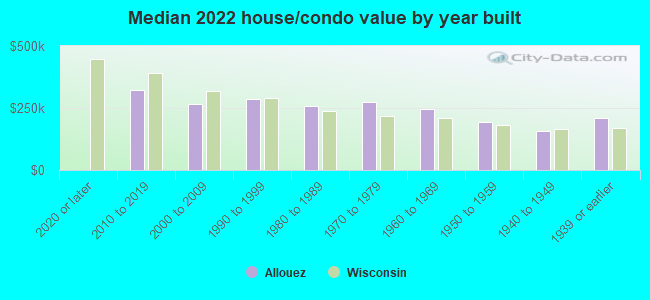
Allouez, WI (Wisconsin) Houses and Residents
| Allouez: | $226,321 |
| Wisconsin: | $252,800 |
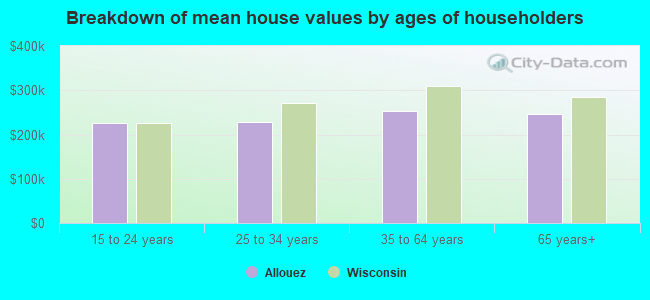
Mean price in 2022:
Detached houses: $260,638
Here: $260,638 State: $308,468 Townhouses or other attached units: $280,215
Here: $280,215 State: $265,873 In 2-unit structures: $283,618
Here: $283,618 State: $203,667 In 5-or-more-unit structures: $222,146
Here: $222,146 State: $280,537 Mobile homes: $109,407
Here: $109,407 State: $79,042
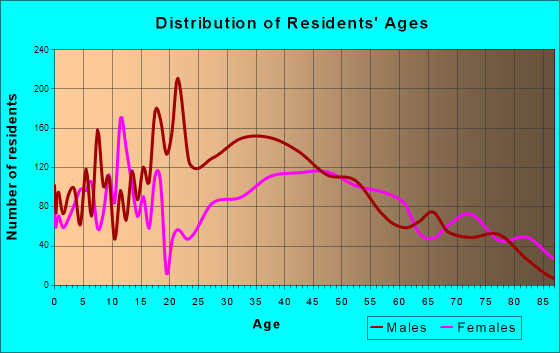
Total population: 13,943 (All urban)
Houses: 6,115 (6,000 occupied: 4,907 owner occupied, 1,166 renter occupied)
| % of renters here: | 19% |
| State: | 32% |
Housing density: 1,322 houses/condos per square mile
Median price asked for vacant for-sale houses and condos in 2022: $725,177.
Median contract rent in 2022: $852 (lower quartile is $735, upper quartile is $948)
Median rent asked for vacant for-rent units in 2022: $1,661
Median gross rent in Allouez, WI in 2022: $924
Housing units in Allouez with a mortgage: 3,094 (345 second mortgage, 22 home equity loan, 284 both second mortgage and home equity loan)
Houses without a mortgage: 79
Median household income for houses/condos with a mortgage: $89,898
Median household income for apartments without a mortgage: $78,769
Median monthly housing costs: $1,061
Compare current foreclosures near Allouez, WI:
| Photo | Address | Area | Beds / Baths | Price | Details |
|---|---|---|---|---|---|

|
#1
S Norwood Ave
Green Bay, WI 54304
|
- sq. feet
|
- baths - beds |
$36,900
|
show details |

|
#2
Sumac Pl
Green Bay, WI 54313
|
4,704 sq. feet
|
5 baths 5 beds |
show details | |

|
#3
Ontario Rd
Green Bay, WI 54311
|
1,786 sq. feet
|
3 baths 3 beds |
show details | |

|
#4
University Ave
Green Bay, WI 54302
|
1,718 sq. feet
|
2 baths 4 beds |
show details | |

|
#5
3rd St
Green Bay, WI 54304
|
- sq. feet
|
- baths - beds |
$60,000
|
show details |

|
#6
Wirtz Ave
Green Bay, WI 54304
|
- sq. feet
|
- baths - beds |
$15,000
|
show details |

|
#7
Colle St
Luxemburg, WI 54217
|
- sq. feet
|
2 baths 4 beds |
show details | |

|
#8
Fulton St
Seymour, WI 54165
|
- sq. feet
|
1 baths 3 beds |
show details | |

|
#9
Buckys Run
Green Bay, WI 54313
|
- sq. feet
|
- baths - beds |
show details | |

|
#10
S Military Ave # 131
Green Bay, WI 54303
|
- sq. feet
|
- baths - beds |
show details |
| Photo | Address | Area | Beds / Baths | Price | Details |
|---|---|---|---|---|---|

|
#11
S 6th St
De Pere, WI 54115
|
- sq. feet
|
- baths - beds |
show details | |

|
#12
Sherry Ln
Green Bay, WI 54302
|
- sq. feet
|
- baths - beds |
show details | |

|
#13
Division St
Green Bay, WI 54303
|
- sq. feet
|
- baths - beds |
show details | |

|
#14
N Overland Rd # 81
Oneida, WI 54155
|
- sq. feet
|
- baths - beds |
show details | |

|
#15
Pebblestone Cir # 91
Oneida, WI 54155
|
- sq. feet
|
- baths - beds |
show details | |

|
#16
Stella Ct Unit 69
Oneida, WI 54155
|
- sq. feet
|
- baths - beds |
show details | |

|
#17
Shawano Ave Apt 5
Green Bay, WI 54303
|
- sq. feet
|
- baths - beds |
show details | |

|
#18
Centennial Centre Blvd Apt 27
Oneida, WI 54155
|
- sq. feet
|
- baths - beds |
show details | |

|
#19
Williams Grant Dr
De Pere, WI 54115
|
- sq. feet
|
- baths - beds |
show details | |

|
#20
Redstone Trl Apt 4
Green Bay, WI 54313
|
- sq. feet
|
- baths - beds |
show details |
| Photo | Address | Area | Beds / Baths | Price | Details |
|---|---|---|---|---|---|

|
#21
Peters St
Green Bay, WI 54302
|
- sq. feet
|
- baths - beds |
show details | |

|
#22
S 9th St
De Pere, WI 54115
|
- sq. feet
|
- baths - beds |
show details | |

|
#23
Velp Ave
Green Bay, WI 54303
|
- sq. feet
|
- baths - beds |
show details | |

|
#24
Tunis Rd
Green Bay, WI 54311
|
- sq. feet
|
- baths - beds |
show details | |

|
#25
Maple Hills Dr
Green Bay, WI 54313
|
- sq. feet
|
- baths - beds |
show details | |

|
#26
Appian Way
Green Bay, WI 54302
|
- sq. feet
|
- baths - beds |
show details | |

|
#27
Trellis Dr, Apt J-3
De Pere, WI 54115
|
- sq. feet
|
- baths - beds |
show details | |

|
#28
Redstone Trl Apt 6
Green Bay, WI 54313
|
- sq. feet
|
- baths - beds |
show details | |

|
#29
Redstone Trl Apt 1
Green Bay, WI 54313
|
- sq. feet
|
- baths - beds |
show details | |

|
#30
Clement St # 8
Green Bay, WI 54302
|
- sq. feet
|
- baths - beds |
show details |
| Photo | Address | Area | Beds / Baths | Price | Details |
|---|---|---|---|---|---|

|
#31
Beech Tree Dr
Green Bay, WI 54304
|
- sq. feet
|
- baths - beds |
show details | |

|
#32
James St Apt 2
Green Bay, WI 54303
|
- sq. feet
|
- baths - beds |
show details | |

|
#33
Founders Ter, Apt 331
Oneida, WI 54155
|
- sq. feet
|
- baths - beds |
show details | |

|
#34
Dousman St
Green Bay, WI 54303
|
- sq. feet
|
- baths - beds |
show details | |

|
#35
Alice Dr Apt B
Green Bay, WI 54304
|
- sq. feet
|
- baths - beds |
show details | |

|
#36
S Timber Trl
Suamico, WI 54173
|
- sq. feet
|
- baths - beds |
show details | |

|
#37
N 10th St Apt 216
De Pere, WI 54115
|
- sq. feet
|
- baths - beds |
show details | |

|
#38
Arctic Ct
Suamico, WI 54173
|
- sq. feet
|
- baths - beds |
show details | |

|
#39
Johnson Rd
De Pere, WI 54115
|
- sq. feet
|
- baths - beds |
show details | |

|
#40
Quarry Park Dr, Apt 11
De Pere, WI 54115
|
- sq. feet
|
- baths - beds |
show details |
| Photo | Address | Area | Beds / Baths | Price | Details |
|---|---|---|---|---|---|

|
#41
Carstensen Ln Apt B
Green Bay, WI 54304
|
- sq. feet
|
- baths - beds |
show details | |

|
#42
Santa Barbara Dr
Green Bay, WI 54313
|
- sq. feet
|
- baths - beds |
show details | |

|
#43
Little River Path
Green Bay, WI 54313
|
- sq. feet
|
- baths - beds |
show details | |

|
#44
Deer Path Dr
Oneida, WI 54155
|
- sq. feet
|
- baths - beds |
show details | |

|
#45
Idlewild Rd
Suamico, WI 54173
|
- sq. feet
|
- baths - beds |
show details | |

|
#46
N Overland Rd # 108
Oneida, WI 54155
|
- sq. feet
|
- baths - beds |
show details | |

|
#47
Silverstone Trl Apt 5h
De Pere, WI 54115
|
- sq. feet
|
- baths - beds |
show details | |

|
#48
Mesa Dr Apt 6
Green Bay, WI 54313
|
- sq. feet
|
- baths - beds |
show details | |

|
#49
Vroman St
Green Bay, WI 54303
|
- sq. feet
|
- baths - beds |
show details | |

|
Check over 1 million property listings on Foreclosure.com!
|
browse all offers | |||

Latest news about housing in Allouez, WI collected exclusively by city-data.com from local newspapers, TV, and radio stations

 | Curious, what do people think of WI? (202 replies) |
| apartments in/around green bay (10 replies) |
| De Pere...The Good, The Bad and the Ugly... (20 replies) |
| Best and Worst places to live in WI (89 replies) |
| Relocating to Green Bay!! Have some questions (34 replies) |
| Advice on moving to Green Bay (28 replies) |
Median year apartment built: 1985
Household type by relationship:
Households: 14,175- Male householders: 3,592 (1,108 living alone), Female householders: 2,339 (874 living alone)
2,626 spouses (2,591 opposite-sex spouses), 395 unmarried partners, (369 opposite-sex unmarried partners), 3,182 children (2,961 natural, 90 adopted, 130 stepchildren), 173 grandchildren, 13 brothers or sisters, 66 parents, 0 foster children, 37 other relatives, 461 non-relatives
- In group quarters: 1,286
Size of family households: 2,121 2-persons, 466 3-persons, 482 4-persons, 301 5-persons, 115 6-persons, 27 7-or-more-persons.
Size of nonfamily households: 2,105 1-person, 361 2-persons, 57 3-persons, 23 4-persons, 8 5-persons.
2,123 married couples with children.
456 single-parent households (135 men, 321 women).
95.0% of residents of Allouez speak English at home.
3.8% of residents speak Spanish at home (81% speak English very well, 3% speak English well, 12% speak English not well, 3% don't speak English at all).
1.0% of residents speak other Indo-European language at home (93% speak English very well, 4% speak English well, 3% speak English not well).
0.1% of residents speak Asian or Pacific Island language at home (100% speak English well).
0.3% of residents speak other language at home (44% speak English very well, 56% speak English not well).
Foreign born population: 420 (3.0%)
(59.3% of them are naturalized citizens)
| Here: | 6.8 |
| State: | 6.5 |
| Here: | 4.0 |
| State: | 4.1 |
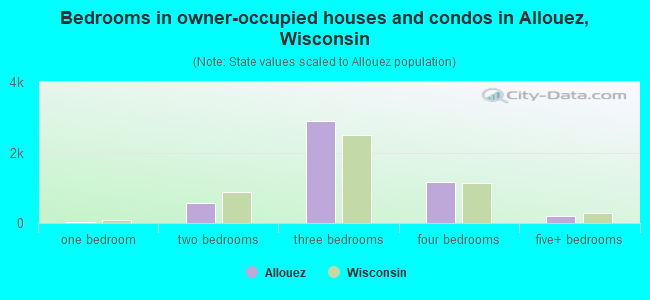
- Bedrooms in owner-occupied houses and condos in Allouez, Wisconsin
- 16no bedroom
- 291 bedroom
- 5782 bedrooms
- 2,9063 bedrooms
- 1,1714 bedrooms
- 2075+ bedrooms
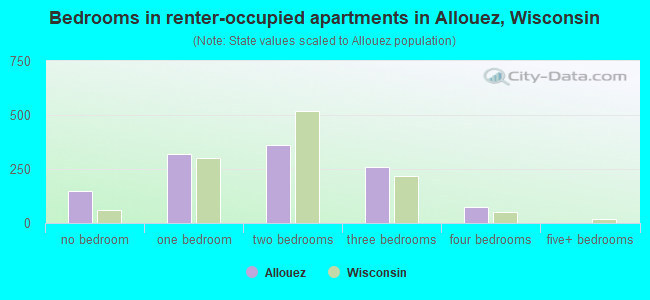
- Bedrooms in renter-occupied apartments in Allouez, Wisconsin
- 148no bedroom
- 3211 bedroom
- 3622 bedrooms
- 2603 bedrooms
- 754 bedrooms
- 05+ bedrooms
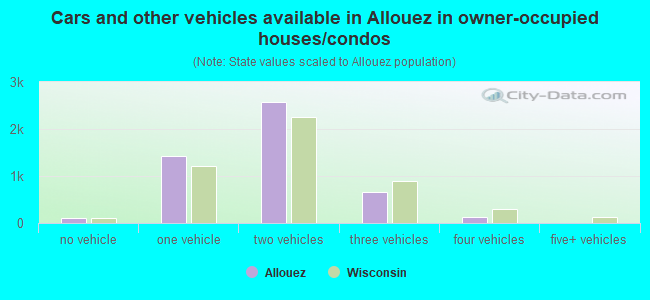
- Cars and other vehicles available in Allouez in owner-occupied houses/condos
- 100no vehicle
- 1,4331 vehicle
- 2,5802 vehicles
- 6593 vehicles
- 1364 vehicles
- 05+ vehicles
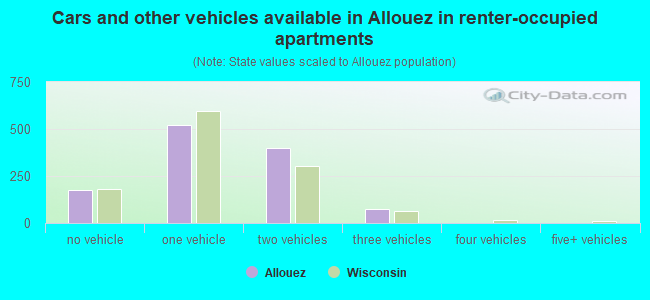
- Cars and other vehicles available in Allouez in renter-occupied apartments
- 173no vehicle
- 5201 vehicle
- 4012 vehicles
- 723 vehicles
- 04 vehicles
- 05+ vehicles
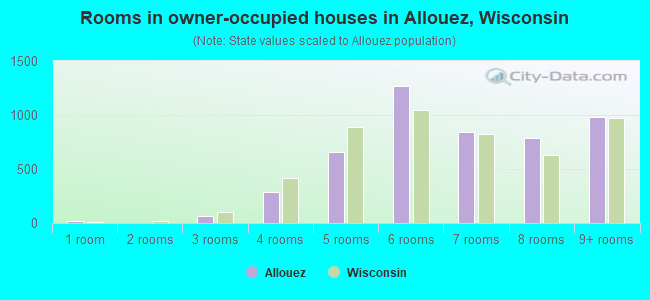
- Rooms in owner-occupied houses in Allouez, Wisconsin
- 161 room
- 02 rooms
- 683 rooms
- 2844 rooms
- 6555 rooms
- 1,2716 rooms
- 8467 rooms
- 7888 rooms
- 9799+ rooms
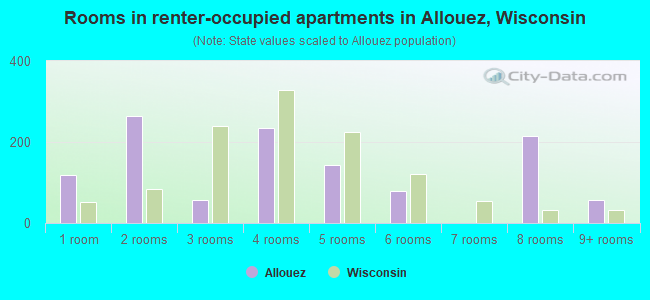
- Rooms in renter-occupied apartments in Allouez, Wisconsin
- 1181 room
- 2642 rooms
- 573 rooms
- 2354 rooms
- 1425 rooms
- 786 rooms
- 07 rooms
- 2148 rooms
- 589+ rooms
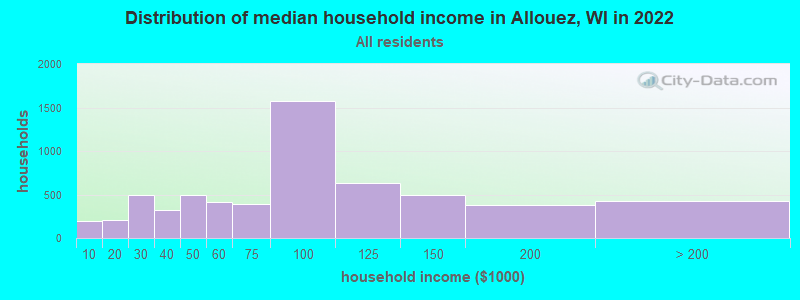
Allouez, WI household income distribution

- 190Less than $10,000
- 211$10,000 to $19,999
- 490$20,000 to $29,999
- 318$30,000 to $39,999
- 497$40,000 to $49,999
- 415$50,000 to $59,999
- 393$60,000 to $74,999
- 1,570$75,000 to $99,999
- 637$100,000 to $124,999
- 494$125,000 to $149,999
- 383$150,000 to $199,999
- 425$200,000 or more
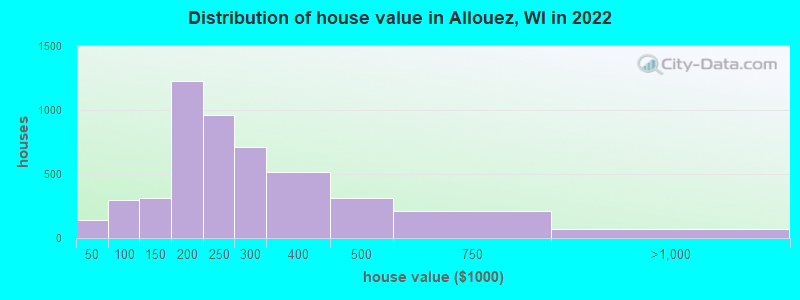
Home value of owner - occupied houses in 2022 in Allouez, WI
-
- 29Less than $10,000
- 31$10,000 to $14,999
- 37$15,000 to $19,999
- 32$20,000 to $24,999
- 12$35,000 to $39,999
- 199$60,000 to $69,999
- 37$70,000 to $79,999
- 16$80,000 to $89,999
- 44$90,000 to $99,999
- 178$100,000 to $124,999
- 129$125,000 to $149,999
- 601$150,000 to $174,999
- 625$175,000 to $199,999
- 958$200,000 to $249,999
- 713$250,000 to $299,999
- 513$300,000 to $399,999
- 314$400,000 to $499,999
- 213$500,000 to $749,999
- 71$750,000 to $999,999
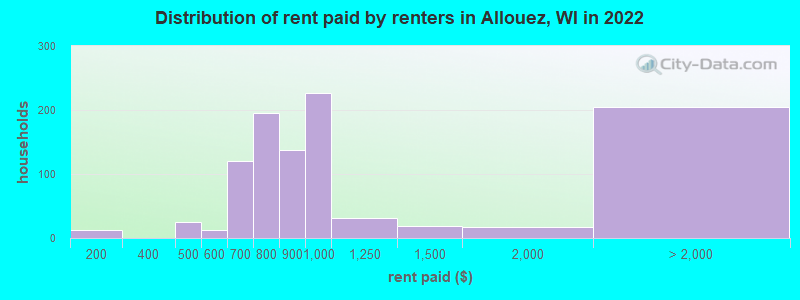
Rent paid by renters in 2022 in Allouez, WI
-
- 12$100 to $149
- 25$400 to $449
- 12$500 to $549
- 14$600 to $649
- 105$650 to $699
- 88$700 to $749
- 107$750 to $799
- 137$800 to $899
- 225$900 to $999
- 32$1,000 to $1,249
- 18$1,250 to $1,499
- 16$1,500 to $1,999
- 52$3,500 or more
- 152No cash rent
Percentage of workers working in this county: 85.1%
Number of people working at home: 634 (9.7% of all workers)
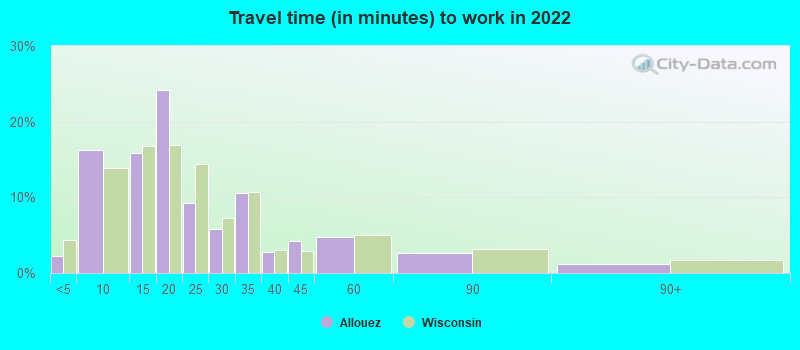
Travel time to work (commute)
- Less than 5 minutes: 145
- 5 to 9 minutes: 1,259
- 10 to 14 minutes: 1,491
- 15 to 19 minutes: 1,594
- 20 to 24 minutes: 349
- 25 to 29 minutes: 235
- 30 to 34 minutes: 243
- 35 to 39 minutes: 59
- 40 to 44 minutes: 125
- 45 to 59 minutes: 126
- 60 to 89 minutes: 172
- 90 or more minutes: 139
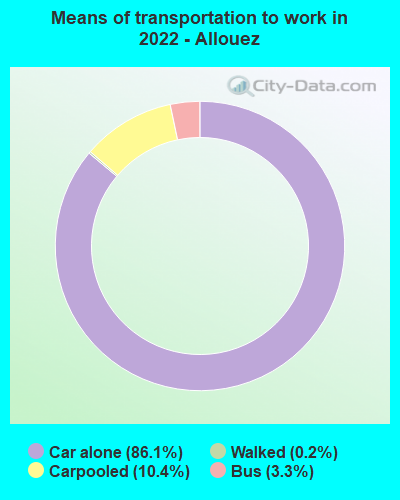
Means of transportation to work:
- Drove a car alone: 3,436 (73.5%)
- Carpooled: 495 (10.6%)
- Bus: 93 (2.0%)
- Walked: 10 (0.2%)
- Worked at home: 634 (13.6%)
- Unemployment by race in 2022
- Unemployment rate for White non-Hispanic residents
- 3.3%Males
- 0.7%Females
- Unemployment rate for two or more race residents
- 8.1%Males
- Unemployment rate for Hispanic or Latino residents
- 10.8%Males
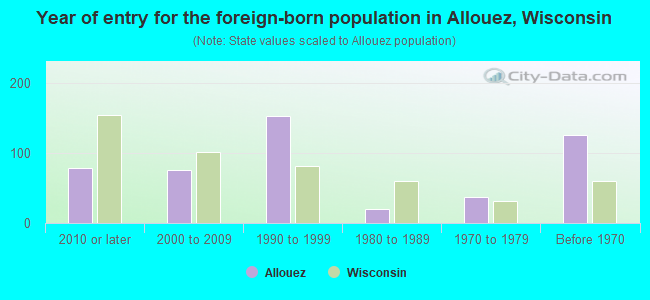
- Year of entry for the foreign-born population in Allouez, Wisconsin
- 782010 or later
- 752000 to 2009
- 1521990 to 1999
- 201980 to 1989
- 371970 to 1979
- 125Before 1970
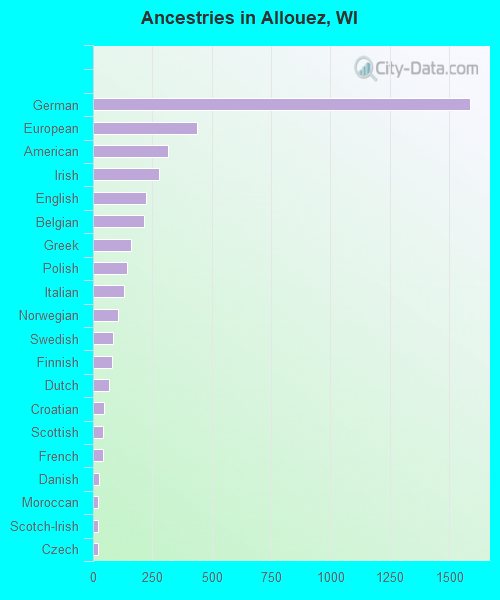
First ancestries reported:
- German: 1,589 (26.3%)
- European: 439 (7.3%)
- American: 314 (5.2%)
- Irish: 276 (4.6%)
- English: 223 (3.7%)
- Belgian: 215 (3.6%)
- Greek: 160 (2.7%)
- Polish: 143 (2.4%)
- Italian: 131 (2.2%)
- Norwegian: 105 (1.7%)
- Swedish: 84 (1.4%)
- Finnish: 82 (1.4%)
- Dutch: 69 (1.1%)
- Croatian: 45 (0.7%)
- Scottish: 44 (0.7%)
- French: 42 (0.7%)
- Danish: 25 (0.4%)
- Moroccan: 23 (0.4%)
- Scotch-Irish: 21 (0.3%)
- Czech: 20 (0.3%)
- Eastern European: 14 (0.2%)
- Russian: 12 (0.2%)
- Latvian: 9 (0.1%)
- Slavic: 9 (0.1%)
- Austrian: 8 (0.1%)
- Hungarian: 8 (0.1%)
- Lithuanian: 8 (0.1%)
- Welsh: 8 (0.1%)
- Northern European: 5 (0.08%)
- Romanian: 5 (0.08%)
- Swiss: 5 (0.08%)
- Canadian: 4 (0.07%)
- Armenian: 3 (0.05%)
- Czechoslovakian: 3 (0.05%)
- Ukrainian: 1 (0.02%)
Most common places of birth for foreign-born residents (%):
| Allouez: | 42.0% (196) |
| Wisconsin: | 29.5% (87,182) |
| Allouez: | 6.0% (28) |
| Wisconsin: | 3.1% (9,280) |
| Allouez: | 5.8% (27) |
| Wisconsin: | 0.3% (858) |
| Allouez: | 5.6% (26) |
| Wisconsin: | 3.0% (8,773) |
| Allouez: | 4.1% (19) |
| Wisconsin: | 0.7% (2,177) |
| Allouez: | 4.1% (19) |
| Wisconsin: | 0.7% (1,981) |
| Allouez: | 3.6% (17) |
| Wisconsin: | 8.0% (23,594) |
| Allouez: | 3.2% (15) |
| Wisconsin: | 4.3% (12,681) |
| Allouez: | 2.8% (13) |
| Wisconsin: | 0.7% (2,099) |
| Allouez: | 2.8% (13) |
| Wisconsin: | 0.8% (2,432) |
| Allouez: | 2.8% (13) |
| Wisconsin: | 1.3% (3,727) |
| Allouez: | 2.6% (12) |
| Wisconsin: | 0.2% (550) |
| Allouez: | 2.4% (11) |
| Wisconsin: | 0.3% (858) |
| Allouez: | 1.9% (9) |
| Wisconsin: | 0.1% (315) |
| Allouez: | 1.7% (8) |
| Wisconsin: | 0.4% (1,080) |
Place of birth for U.S.-born residents:
- This state: 10,993
- Other state: 2,742
- Northeast: 128
- Midwest: 1,805
- South: 475
- West: 284
87.7% of Allouez residents lived in the same house 1 years ago.
Out of people who lived in different houses, 32.8% lived in this county.
Out of people who lived in different counties, 93.3% lived in Wisconsin.
| Allouez: | 87.7% |
| State average: | 87.7% |
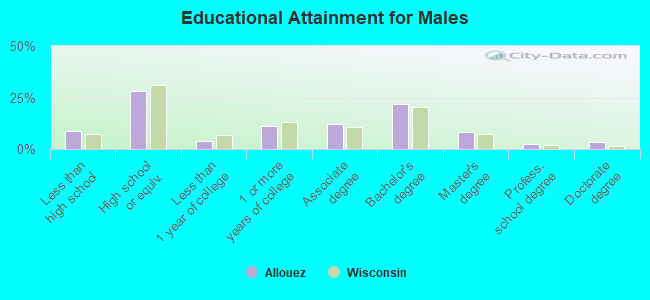
Education attainment for males 25 years and older:
- No schooling: 103
- Nursery to 4th grade: 15
- 5th and 6th grade: 32
- 7th and 8th grade: 39
- 9th grade: 74
- 10th grade: 14
- 11th grade: 111
- 12th grade, no diploma: 122
- High school graduate (or equivalency): 1,685
- Less than 1 year of college: 230
- Some college more than 1 year, no degree: 670
- Associate degree: 722
- Bachelor's degree: 1,316
- Master's degree: 489
- Professional school degree: 147
- Doctorate degree: 209
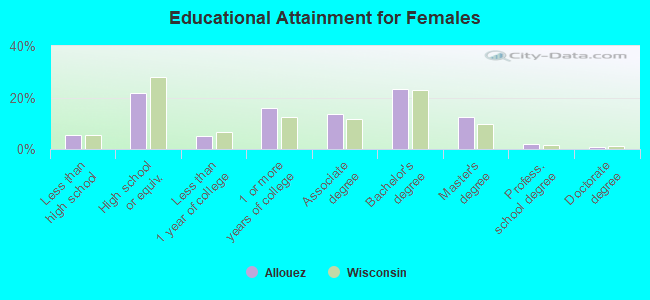
Education attainment for females 25 years and older:
- No schooling: 21
- Nursery to 4th grade: 11
- 5th and 6th grade: 0
- 7th and 8th grade: 54
- 9th grade: 83
- 10th grade: 8
- 11th grade: 51
- 12th grade, no diploma: 27
- High school graduate (or equivalency): 1,026
- Less than 1 year of college: 232
- Some college more than 1 year, no degree: 748
- Associate degree: 645
- Bachelor's degree: 1,099
- Master's degree: 578
- Professional school degree: 86
- Doctorate degree: 37
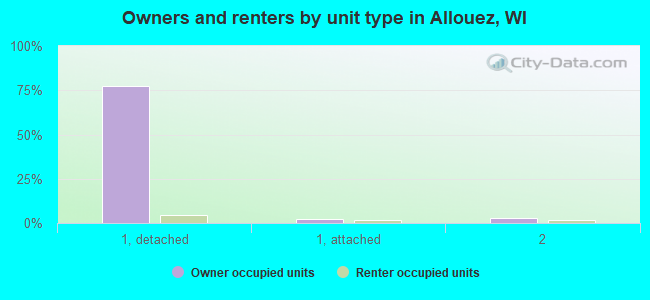
Housing units in structures:
- One, detached: 4,968
- One, attached: 191
- Two: 233
- 3 or 4: 5
- 5 to 9: 34
- 10 to 19: 198
- 20 to 49: 126
- 50 or more: 278
- Mobile homes: 45
- Boats, RVs, vans, etc.: 33
Housing units lacking complete kitchen facilities in 2022: 6.0%
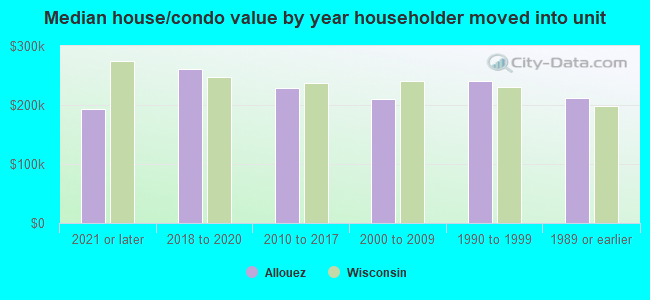
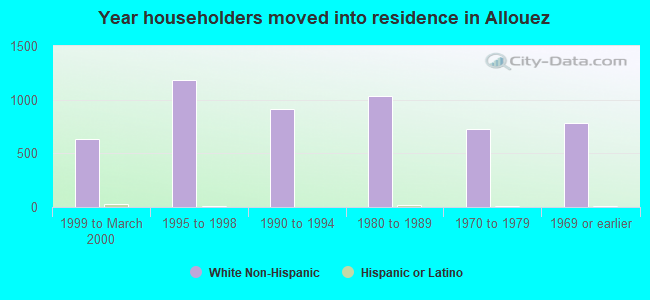
House/condo owner moved in on average 12 years ago
Renter moved in on average 6 years ago
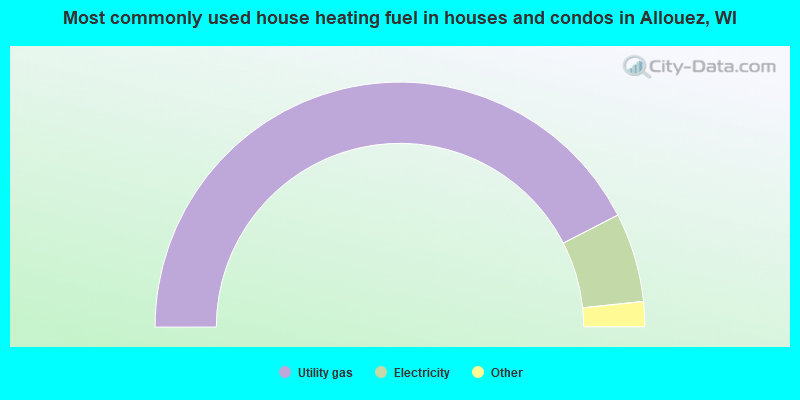
- 84.9%Utility gas
- 11.8%Electricity
- 2.1%Bottled, tank, or LP gas
- 0.7%Wood
- 0.3%No fuel used
- 0.2%Other fuel
- 0.1%Fuel oil, kerosene, etc.
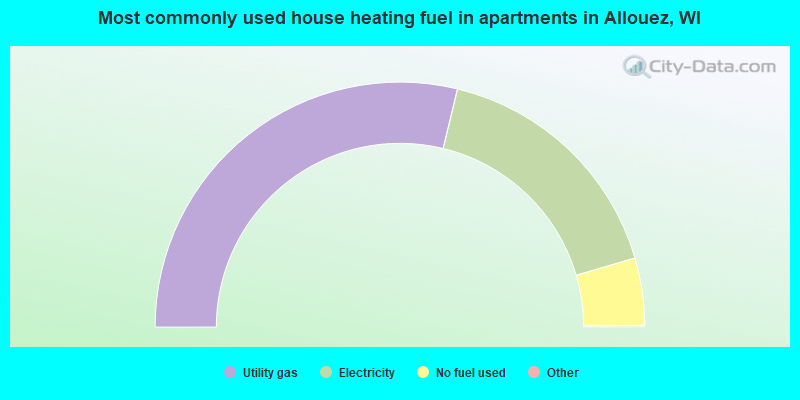
- 57.7%Utility gas
- 33.4%Electricity
- 8.9%No fuel used
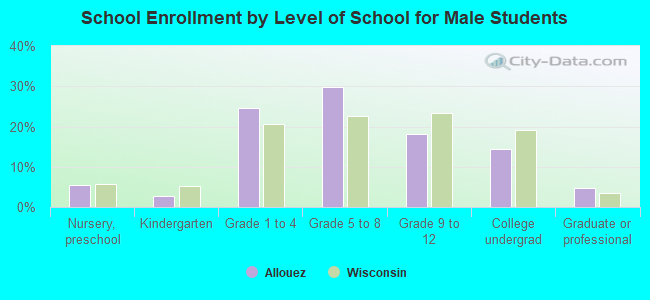
Private vs. public school enrollment:
| Here: | 15.2% |
| Wisconsin: | 16.7% |
| Here: | 26.9% |
| Wisconsin: | 12.5% |
| Here: | 29.4% |
| Wisconsin: | 17.5% |