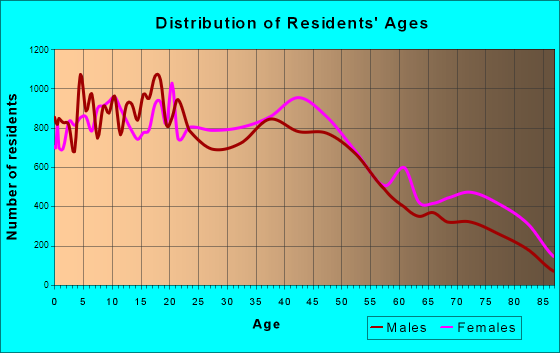
Beaumont, TX (Texas) Houses and Residents
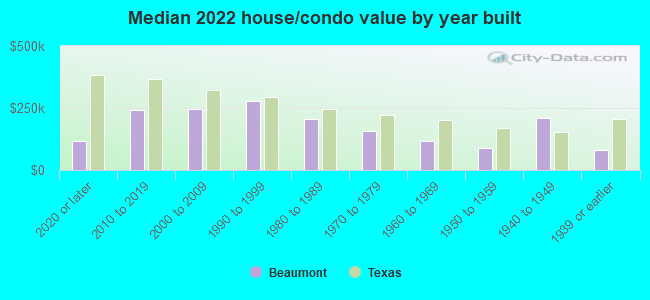
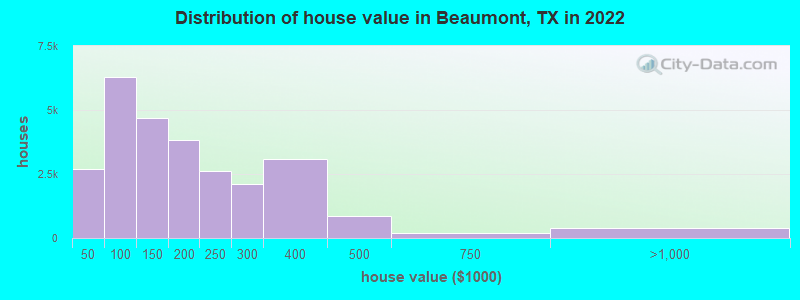
Estimated median house or condo value in 2022: $150,800 (it was $62,000 in 2000 )
Beaumont:
$150,800Texas:
$275,400
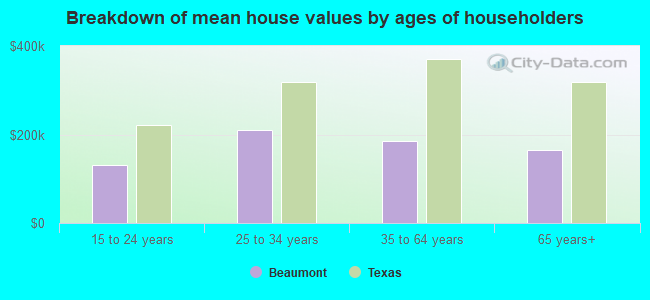
Lower value quartile - upper value quartile: $85,400 - $252,900Mean price in 2022: Detached houses: $239,486 Here:
$239,486State:
$369,058
Townhouses or other attached units: $211,601 Here:
$211,601State:
$327,631
In 2-unit structures: $253,368 Here:
$253,368State:
$374,947
In 3-to-4-unit structures: $824,304 Here:
$824,304State:
$209,652
In 5-or-more-unit structures: $281,116 Here:
$281,116State:
$413,944
Mobile homes: $69,508 Here:
$69,508State:
$124,413
Total population: 117,585 (Urban population: 111,502, Rural population: 2,386 (all nonfarm) )
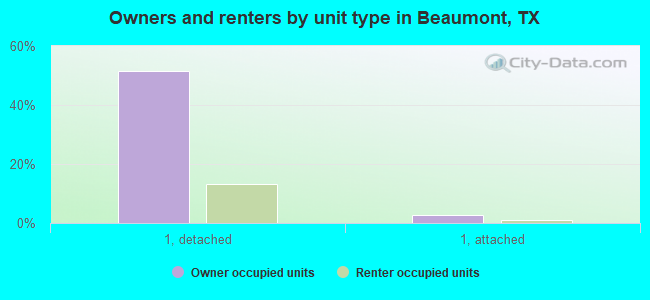
Houses: 51,962 (45,870 occupied: 26,044 owner occupied, 19,826 renter occupied )
% of renters here:
43%State:
38%
Housing density: 611 houses/condos per square mile
Median price asked for vacant for-sale houses and condos in 2022: $142,785.
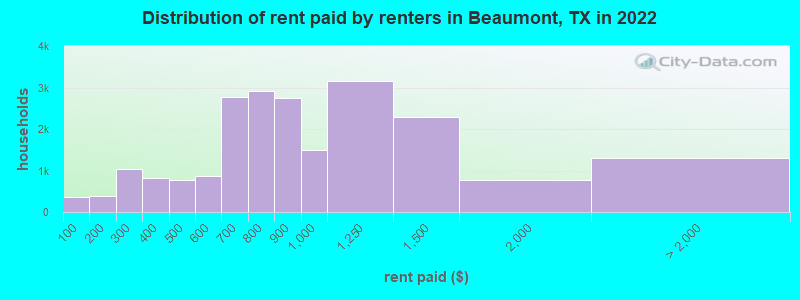
Median contract rent in 2022: $818 (lower quartile is $640, upper quartile is $1,130)
Median rent asked for vacant for-rent units in 2022: $1,640
Median gross rent in Beaumont, TX in 2022: $974
Housing units in Beaumont with a mortgage: 10,874 (363 second mortgage, 0 home equity loan, 315 both second mortgage and home equity loan )Houses without a mortgage: 743
Median household income for houses/condos with a mortgage: $101,560
Median household income for apartments without a mortgage: $63,225
Median monthly housing costs: $931
Data:
Median house or condo value ($)
Median house or condo value ($ change since 2000)
Median house or condo value ($) - White
Median house or condo value ($) - Black or African American
Median house or condo value ($) - Asian
Median house or condo value ($) - Hispanic or Latino
Median house or condo value ($) - American Indian and Alaska Native
Median house or condo value ($) - Multirace
Median house or condo value ($) - Other Race
Median price asked for mobile homes ($)
Household density (households per square mile)
Mean house or condo value by units in structure - 1, detached ($)
Mean house or condo value by units in structure - 1, attached ($)
Mean house or condo value by units in structure - 2 ($)
Mean house or condo value by units in structure by units in structure - 3 or 4 ($)
Mean house or condo value by units in structure - 5 or more ($)
Mean house or condo value by units in structure - Boat, RV, van, etc. ($)
Mean house or condo value by units in structure - Mobile home ($)
Median contract rent ($)
Median contract rent - Lower quartile ($)
Median contract rent - Upper quartile ($)
Median gross rent ($)
Urban houses (%)
Rural houses (%)
Houses occupied (%)
Houses occupied (% change since 2000)
Houses owner occupied (%)
Houses owner occupied (% change since 2000)
Houses renter occupied (%)
Houses renter occupied (% change since 2000)
Vacant housing units - For rent (%)
Vacant housing units - For rent (% change since 2000)
Vacant housing units - For sale only (%)
Vacant housing units - For sale only (% change since 2000)
Vacant housing units - Rented or sold, not occupied (%)
Vacant housing units - Rented or sold, not occupied (% change since 2000)
Vacant housing units - For seasonal, recreational, or occasional use (%)
Vacant housing units - For seasonal, recreational, or occasional use (% change since 2000)
Vacant housing units - For migrant workers (%)
Vacant housing units - For migrant workers (% change since 2000)
Vacant housing units - Other vacant (%)
Vacant housing units - Other vacant (% change since 2000)
Median monthly housing costs ($)
Median household income for houses/condos with a mortgage ($)
Median household income for houses/condos without a mortgage ($)
Median household income ($)
Median household income ($) - White
Median household income ($) - Black or African American
Median household income ($) - Asian
Median household income ($) - Hispanic or Latino
Median household income ($) - American Indian and Alaska Native
Median household income ($) - Multirace
Median household income ($) - Other Race
Mortgage status - with mortgage (%)
Mortgage status - with second mortgage (%)
Mortgage status - with home equity loan (%)
Mortgage status - with both second mortgage and home equity loan (%)
Mortgage status - without a mortgage (%)
Median year house/condo built
Median year apartment built
Household type by relationship - Male householder living alone (%)
Household type by relationship - Male householder not living alone (%)
Household type by relationship - Female householder living alone (%)
Household type by relationship - Female householder not living alone (%)
Household type by relationship - Opposite-Sex spouse (%)
Household type by relationship - Same-Sex spouse (%)
Household type by relationship - Opposite-Sex unmarried partner (%)
Household type by relationship - Same-Sex unmarried partner (%)
Household type by relationship - In group quarters (%)
Size of family households - 2-person household (%)
Size of family households - 3-person household (%)
Size of family households - 4-person household (%)
Size of family households - 5-person household (%)
Size of family households - 6-person household (%)
Size of family households - 7-or-more-person household (%)
Size of nonfamily households - 1-person household (%)
Size of nonfamily households - 2-person household (%)
Size of nonfamily households - 3-person household (%)
Size of nonfamily households - 4-person household (%)
Size of nonfamily households - 5-person household (%)
Size of nonfamily households - 6-person household (%)
Size of nonfamily households - 7-or-moreperson household (%)
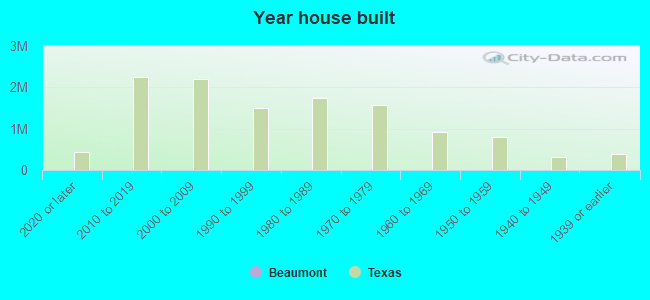
Year house built - Built 2010 or later (%)
Year house built - Built 2000 to 2009 (%)
Year house built - Built 1990 to 1999 (%)
Year house built - Built 1980 to 1989 (%)
Year house built - Built 1970 to 1979 (%)
Year house built - Built 1960 to 1969 (%)
Year house built - Built 1950 to 1959 (%)
Year house built - Built 1940 to 1949 (%)
Year house built - Built 1939 or earlier (%)
Median number of rooms in houses and condos
Median number of rooms in apartments
Median number of bedrooms in owner occupied houses
Mean number of bedrooms in owner occupied houses
Median number of bedrooms in renter occupied houses
Mean number of bedrooms in renter occupied houses
Median number of vehichles in owner occupied houses
Mean number of vehichles in owner occupied houses
Median number of vehichles in renter occupied houses
Mean number of vehichles in renter occupied houses
Rooms in owner-occupied houses - 1 room (%)
Rooms in owner-occupied houses - 2 rooms (%)
Rooms in owner-occupied houses - 3 rooms (%)
Rooms in owner-occupied houses - 4 rooms (%)
Rooms in owner-occupied houses - 5 rooms (%)
Rooms in owner-occupied houses - 6 rooms (%)
Rooms in owner-occupied houses - 7 rooms (%)
Rooms in owner-occupied houses - 8 rooms (%)
Rooms in owner-occupied houses - 9+ rooms (%)
Rooms in renter-occupied houses - 1 room (%)
Rooms in renter-occupied houses - 2 rooms (%)
Rooms in renter-occupied houses - 3 rooms (%)
Rooms in renter-occupied houses - 4 rooms (%)
Rooms in renter-occupied houses - 5 rooms (%)
Rooms in renter-occupied houses - 6 rooms (%)
Rooms in renter-occupied houses - 7 rooms (%)
Rooms in renter-occupied houses - 8 rooms (%)
Rooms in renter-occupied houses - 9+ rooms (%)
Bedrooms in owner-occupied houses - no bedrooms (%)
Bedrooms in owner-occupied houses - 1 bedroom (%)
Bedrooms in owner-occupied houses - 2 bedrooms (%)
Bedrooms in owner-occupied houses - 3 bedrooms (%)
Bedrooms in owner-occupied houses - 4 bedrooms (%)
Bedrooms in owner-occupied houses - 5+ bedrooms (%)
Bedrooms in renter-occupied houses - no bedrooms (%)
Bedrooms in renter-occupied houses - 1 bedroom (%)
Bedrooms in renter-occupied houses - 2 bedrooms (%)
Bedrooms in renter-occupied houses - 3 bedrooms (%)
Bedrooms in renter-occupied houses - 4 bedrooms (%)
Bedrooms in renter-occupied houses - 5+ bedrooms (%)
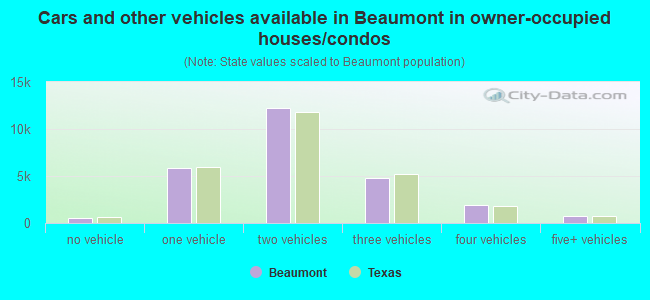
Vehicles available in owner-occupied houses - no vehicle available (%)
Vehicles available in owner-occupied houses - 1 vehicle available(%)
Vehicles available in owner-occupied houses - 2 Vehicles available (%)
Vehicles available in owner-occupied houses - 3 Vehicles available (%)
Vehicles available in owner-occupied houses - 4 Vehicles available (%)
Vehicles available in owner-occupied houses - 5+ Vehicles available (%)
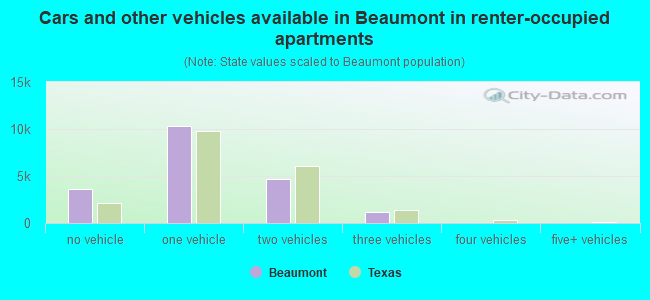
Vehicles available in renter-occupied houses - no vehicle available (%)
Vehicles available in renter-occupied houses - 1 vehicle available (%)
Vehicles available in renter-occupied houses - 2 Vehicles available (%)
Vehicles available in renter-occupied houses - 3 Vehicles available (%)
Vehicles available in renter-occupied houses - 4 Vehicles available (%)
Vehicles available in renter-occupied houses - 5+ Vehicles available (%)
Housing units in structures - 1, detached (%)
Housing units in structures - 1, attached (%)
Housing units in structures - 2 (%)
Housing units in structures - 3 or 4 (%)
Housing units in structures - 5 to 9 (%)
Housing units in structures - 10 to 19 (%)
Housing units in structures - 20 to 49 (%)
Housing units in structures - 50 or more (%)
Housing units in structures - Mobile home (%)
Housing units in structures - Boat, RV, van, etc. (%)
Housing units in structures - Owners - 1, detached (%)
Housing units in structures - Owners - 1, attached (%)
Housing units in structures - Owners - 2 (%)
Housing units in structures - Owners - 3 or 4 (%)
Housing units in structures - Owners - 5 to 9 (%)
Housing units in structures - Owners - 10 to 19 (%)
Housing units in structures - Owners - 20 to 49 (%)
Housing units in structures - Owners - 50 or more (%)
Housing units in structures - Owners - Mobile home (%)
Housing units in structures - Owners - Boat, RV, van, etc. (%)
Housing units in structures - Renters - 1, detached (%)
Housing units in structures - Renters - 1, attached (%)
Housing units in structures - Renters - 2 (%)
Housing units in structures - Renters - 3 or 4 (%)
Housing units in structures - Renters - 5 to 9 (%)
Housing units in structures - Renters - 10 to 19 (%)
Housing units in structures - Renters - 20 to 49 (%)
Housing units in structures - Renters - 50 or more (%)
Housing units in structures - Renters - Mobile home (%)
Housing units in structures - Renters - Boat, RV, van, etc. (%)
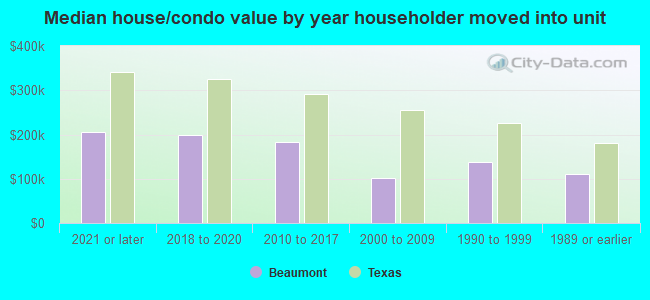
House/condo owner moved in on average (years ago)
Renter moved in on average (years ago)
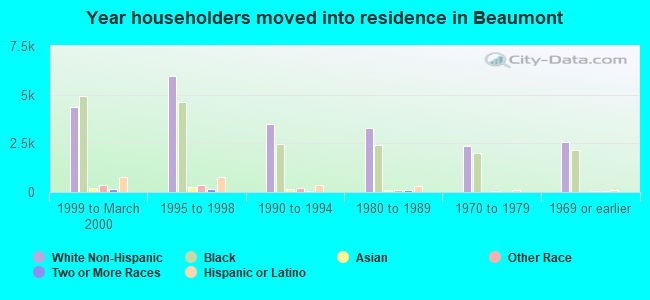
Year householder moved into unit - Moved in 1999 to March 2000 (%)
Year householder moved into unit - Moved in 1999 to March 2000 (%) - White
Year householder moved into unit - Moved in 1999 to March 2000 (%) - Black or African American
Year householder moved into unit - Moved in 1999 to March 2000 (%) - Asian
Year householder moved into unit - Moved in 1999 to March 2000 (%) - Hispanic or Latino
Year householder moved into unit - Moved in 1999 to March 2000 (%) - American Indian and Alaska Native
Year householder moved into unit - Moved in 1999 to March 2000 (%) - Multirace
Year householder moved into unit - Moved in 1999 to March 2000 (%) - Other Race
Year householder moved into unit - Moved in 1995 to 1998 (%)
Year householder moved into unit - Moved in 1995 to 1998 (%) - White
Year householder moved into unit - Moved in 1995 to 1998 (%) - Black or African American
Year householder moved into unit - Moved in 1995 to 1998 (%) - Asian
Year householder moved into unit - Moved in 1995 to 1998 (%) - Hispanic or Latino
Year householder moved into unit - Moved in 1995 to 1998 (%) - American Indian and Alaska Native
Year householder moved into unit - Moved in 1995 to 1998 (%) - Multirace
Year householder moved into unit - Moved in 1995 to 1998 (%) - Other Race
Year householder moved into unit - Moved in 1990 to 1994 (%)
Year householder moved into unit - Moved in 1990 to 1994 (%) - White
Year householder moved into unit - Moved in 1990 to 1994 (%) - Black or African American
Year householder moved into unit - Moved in 1990 to 1994 (%) - Asian
Year householder moved into unit - Moved in 1990 to 1994 (%) - Hispanic or Latino
Year householder moved into unit - Moved in 1990 to 1994 (%) - American Indian and Alaska Native
Year householder moved into unit - Moved in 1990 to 1994 (%) - Multirace
Year householder moved into unit - Moved in 1990 to 1994 (%) - Other Race
Year householder moved into unit - Moved in 1980 to 1989 (%)
Year householder moved into unit - Moved in 1980 to 1989 (%) - White
Year householder moved into unit - Moved in 1980 to 1989 (%) - Black or African American
Year householder moved into unit - Moved in 1980 to 1989 (%) - Asian
Year householder moved into unit - Moved in 1980 to 1989 (%) - Hispanic or Latino
Year householder moved into unit - Moved in 1980 to 1989 (%) - American Indian and Alaska Native
Year householder moved into unit - Moved in 1980 to 1989 (%) - Multirace
Year householder moved into unit - Moved in 1980 to 1989 (%) - Other Race
Year householder moved into unit - Moved in 1970 to 1979 (%)
Year householder moved into unit - Moved in 1970 to 1979 (%) - White
Year householder moved into unit - Moved in 1970 to 1979 (%) - Black or African American
Year householder moved into unit - Moved in 1970 to 1979 (%) - Asian
Year householder moved into unit - Moved in 1970 to 1979 (%) - Hispanic or Latino
Year householder moved into unit - Moved in 1970 to 1979 (%) - American Indian and Alaska Native
Year householder moved into unit - Moved in 1970 to 1979 (%) - Multirace
Year householder moved into unit - Moved in 1970 to 1979 (%) - Other Race
Year householder moved into unit - Moved in 1969 or earlier (%)
Year householder moved into unit - Moved in 1969 or earlier (%) - White
Year householder moved into unit - Moved in 1969 or earlier (%) - Black or African American
Year householder moved into unit - Moved in 1969 or earlier (%) - Asian
Year householder moved into unit - Moved in 1969 or earlier (%) - Hispanic or Latino
Year householder moved into unit - Moved in 1969 or earlier (%) - American Indian and Alaska Native
Year householder moved into unit - Moved in 1969 or earlier (%) - Multirace
Year householder moved into unit - Moved in 1969 or earlier (%) - Other Race
Housing units lacking complete plumbing facilities (%)
Housing units lacking complete kitchen facilities (%)
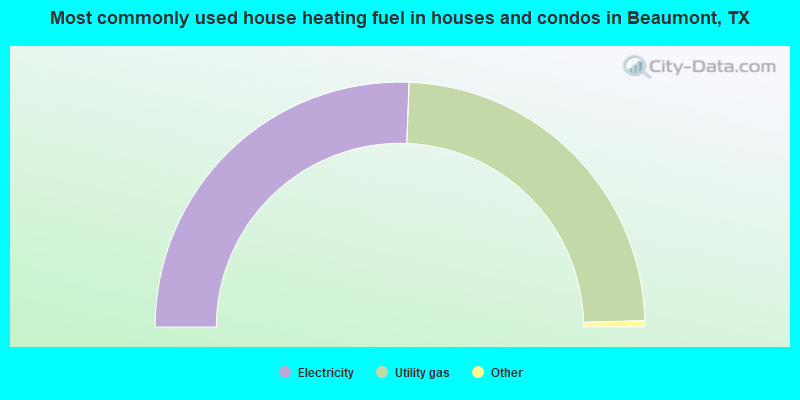
House heating fuel used in houses and condos - Utility gas (%)
House heating fuel used in houses and condos - Bottled, tank, or LP gas (%)
House heating fuel used in houses and condos - Electricity (%)
House heating fuel used in houses and condos - Fuel oil, kerosene, etc. (%)
House heating fuel used in houses and condos - Coal or coke (%)
House heating fuel used in houses and condos - Wood (%)
House heating fuel used in houses and condos - Solar energy (%)
House heating fuel used in houses and condos - Other fuel (%)
House heating fuel used in houses and condos - No fuel used (%)
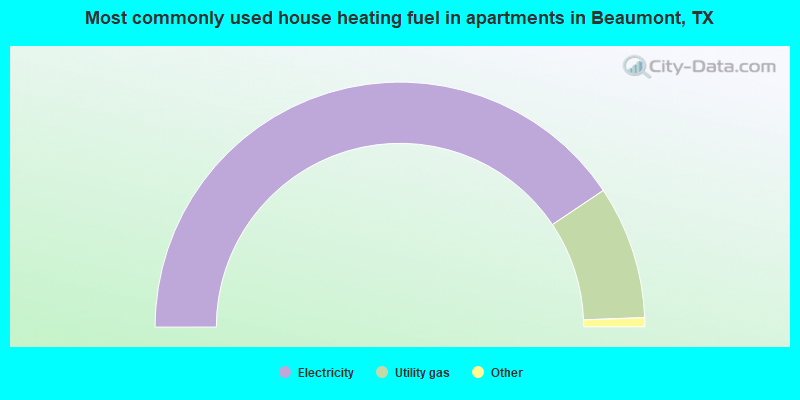
House heating fuel used in apartments - Utility gas (%)
House heating fuel used in apartments - Bottled, tank, or LP gas (%)
House heating fuel used in apartments - Electricity (%)
House heating fuel used in apartments - Fuel oil, kerosene, etc. (%)
House heating fuel used in apartments - Coal or coke (%)
House heating fuel used in apartments - Wood (%)
House heating fuel used in apartments - Solar energy (%)
House heating fuel used in apartments - Other fuel (%)
House heating fuel used in apartments - No fuel used (%)
Latest news about housing in Beaumont, TX collected exclusively by city-data.com from local newspapers, TV, and radio stations
Median year house/condo built: 1974Median year apartment built: 1991Household type by relationship:
Households: 112,090
Male householders: 20,290 (6,995 living alone ), Female householders: 25,580 (6,279 living alone )19,637 spouses (19,361 opposite-sex spouses ), 2,647 unmarried partners , (2,216 opposite-sex unmarried partners ), 32,410 children (31,606 natural , 296 adopted , 508 stepchildren ), 2,278 grandchildren , 2,266 brothers or sisters , 1,400 parents , 0 foster children , 1,964 other relatives , 1,224 non-relatives In group quarters: 2,394
Size of family households: 13,507 2-persons , 6,554 3-persons , 4,035 4-persons , 4,301 5-persons , 943 6-persons , 541 7-or-more-persons .
Size of nonfamily households: 13,274 1-person , 2,580 2-persons , 135 5-persons .
12,405 married couples with children. single-parent households (2,804 men , 8,654 women ).
80.0% of residents of Beaumont speak English at home. of residents speak Spanish at home (61% speak English very well , 16% speak English well , 16% speak English not well , 7% don't speak English at all ).of residents speak other Indo-European language at home (71% speak English very well , 18% speak English well , 12% speak English not well ).of residents speak Asian or Pacific Island language at home (63% speak English very well , 14% speak English well , 11% speak English not well , 12% don't speak English at all ).of residents speak other language at home (79% speak English very well , 10% speak English well , 10% speak English not well ).
Foreign born population: 12,335 (11.0%)of them are naturalized citizens )
Median number of rooms in houses and condos:
Median number of rooms in apartments
Owner-occupied Renter-occupied
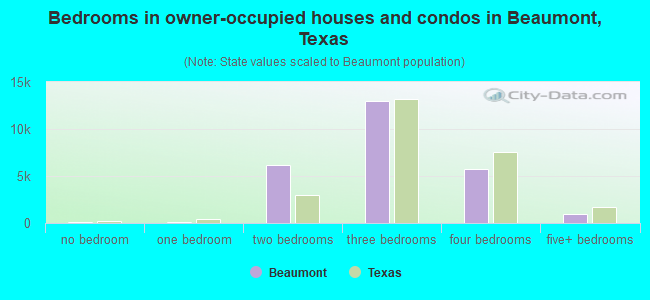
Bedrooms in owner-occupied houses and condos in Beaumont, Texas
71 no bedroom 126 1 bedroom 6,184 2 bedrooms 13,023 3 bedrooms 5,719 4 bedrooms 921 5+ bedrooms
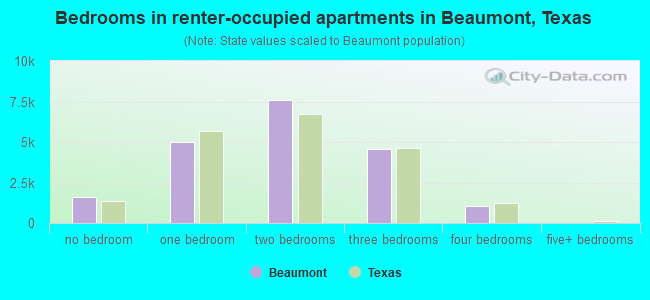
Bedrooms in renter-occupied apartments in Beaumont, Texas
1,622 no bedroom 4,977 1 bedroom 7,582 2 bedrooms 4,567 3 bedrooms 1,078 4 bedrooms 0 5+ bedrooms
Owner-occupied Renter-occupied
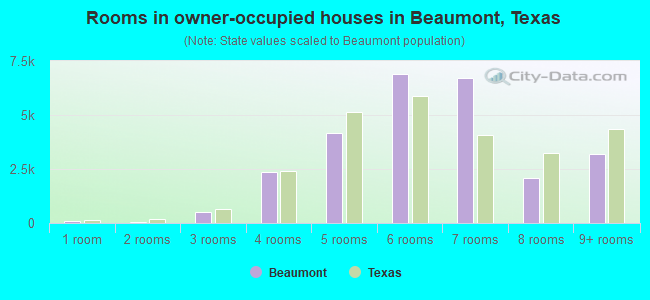
Rooms in owner-occupied houses in Beaumont, Texas
71 1 room 36 2 rooms 491 3 rooms 2,372 4 rooms 4,181 5 rooms 6,914 6 rooms 6,700 7 rooms 2,075 8 rooms 3,204 9+ rooms
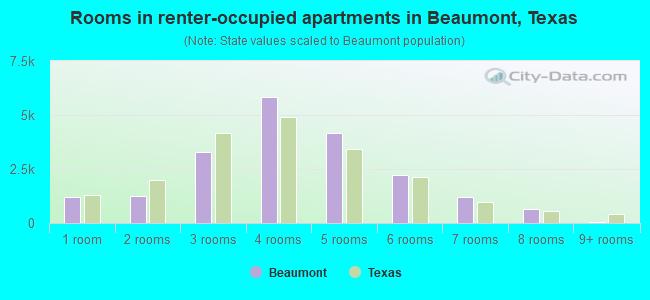
Rooms in renter-occupied apartments in Beaumont, Texas
1,192 1 room 1,230 2 rooms 3,286 3 rooms 5,820 4 rooms 4,175 5 rooms 2,202 6 rooms 1,209 7 rooms 648 8 rooms 64 9+ rooms
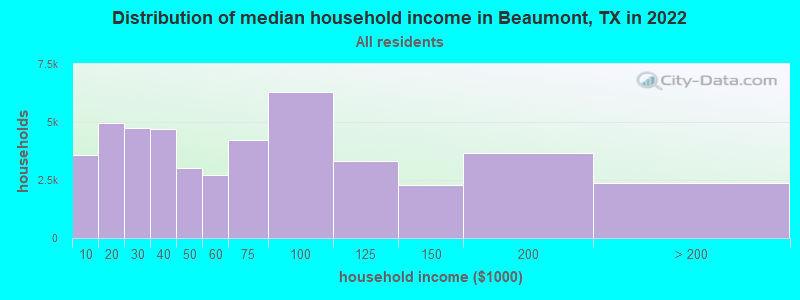
Beaumont, TX household income distribution 3,587 Less than $10,0004,977 $10,000 to $19,9994,724 $20,000 to $29,9994,695 $30,000 to $39,9993,037 $40,000 to $49,9992,698 $50,000 to $59,9994,213 $60,000 to $74,9996,292 $75,000 to $99,9993,331 $100,000 to $124,9992,284 $125,000 to $149,9993,668 $150,000 to $199,9992,364 $200,000 or more
Home value of owner - occupied houses in 2022 in Beaumont, TX 502 Less than $10,00056 $10,000 to $14,999168 $15,000 to $19,999386 $20,000 to $24,999108 $25,000 to $29,999404 $30,000 to $34,999365 $35,000 to $39,999699 $40,000 to $49,999928 $50,000 to $59,999753 $60,000 to $69,9991,455 $70,000 to $79,9991,284 $80,000 to $89,9991,183 $90,000 to $99,9992,801 $100,000 to $124,9991,873 $125,000 to $149,9991,785 $150,000 to $174,9992,027 $175,000 to $199,9992,632 $200,000 to $249,9992,120 $250,000 to $299,9993,078 $300,000 to $399,999862 $400,000 to $499,999180 $500,000 to $749,999364 $750,000 to $999,99931 $2,000,000 or moreRent paid by renters in 2022 in Beaumont, TX 350 Less than $100134 $100 to $149247 $150 to $199632 $200 to $249400 $250 to $299472 $300 to $349357 $350 to $399515 $400 to $449252 $450 to $499393 $500 to $549471 $550 to $5991,474 $600 to $6491,289 $650 to $6991,730 $700 to $7491,177 $750 to $7992,748 $800 to $8991,481 $900 to $9993,160 $1,000 to $1,2492,298 $1,250 to $1,499764 $1,500 to $1,999155 $2,000 to $2,49921 $2,500 to $2,999109 $3,000 to $3,499101 $3,500 or more919 No cash rent
Percentage of workers working in this county: 91.2%Number of people working at home: 2,446 (4.7% of all workers )
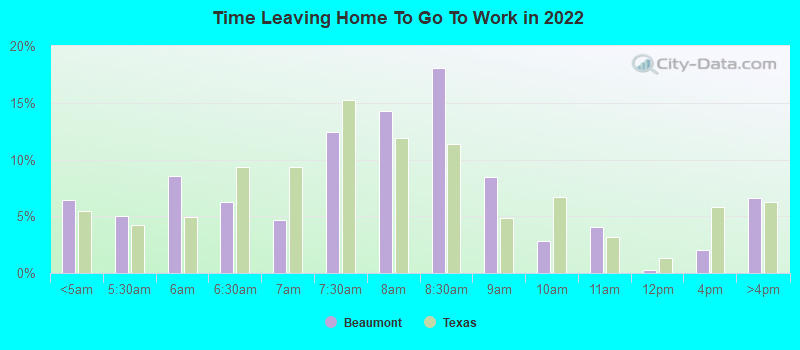
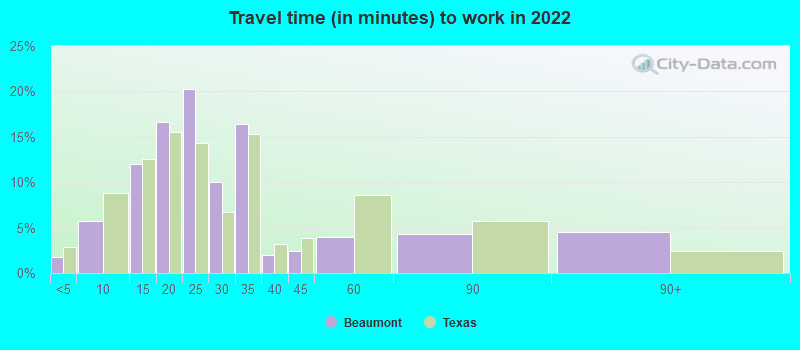
Travel time to work (commute)
Less than 5 minutes: 7825 to 9 minutes: 4,02110 to 14 minutes: 8,00315 to 19 minutes: 9,61120 to 24 minutes: 8,84725 to 29 minutes: 1,62730 to 34 minutes: 6,96835 to 39 minutes: 76940 to 44 minutes: 83945 to 59 minutes: 1,72760 to 89 minutes: 1,66290 or more minutes: 1,142
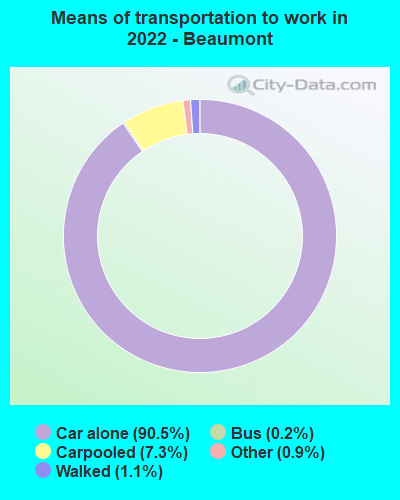
Means of transportation to work:
Drove a car alone: 61,880 (83.6%)Carpooled: 5,444 (7.4%)Bus : 96 (0.1%)Taxi: 780 (1.1%)Bicycle: 20 (0.0%)Walked: 796 (1.1%)Worked at home: 2,446 (3.3%)
Unemployment by race in 2022
Unemployment rate for White non-Hispanic residents 3.3% Males2.7% FemalesUnemployment rate for Black residents 5.2% Males4.0% FemalesUnemployment rate for Asian residents 15.7% Males2.1% FemalesUnemployment rate for other race residents 3.5% Males0.8% FemalesUnemployment rate for two or more race residents 7.7% Males0.1% FemalesUnemployment rate for Hispanic or Latino residents 2.7% Males1.8% Females
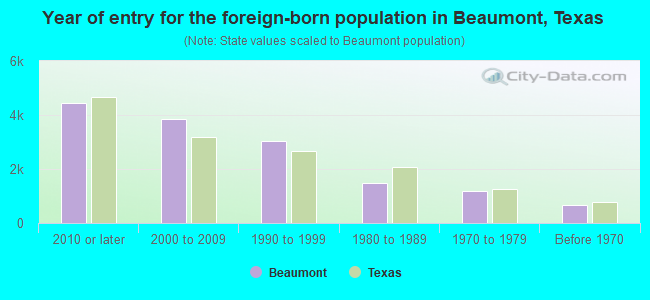
Year of entry for the foreign-born population in Beaumont, Texas
4,440 2010 or later 3,845 2000 to 2009 3,054 1990 to 1999 1,477 1980 to 1989 1,179 1970 to 1979 664 Before 1970
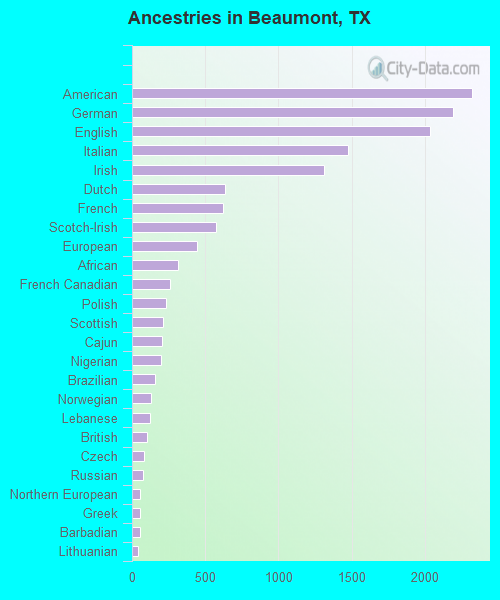
First ancestries reported:
American: 2,322 (2.7%)
German: 2,195 (2.6%)
English: 2,036 (2.4%)
Italian: 1,475 (1.7%)
Irish: 1,308 (1.5%)
Dutch: 635 (0.7%)
French: 619 (0.7%)
Scotch-Irish: 571 (0.7%)
European: 443 (0.5%)
African: 313 (0.4%)
French Canadian: 259 (0.3%)
Polish: 232 (0.3%)
Scottish: 209 (0.2%)
Cajun: 203 (0.2%)
Nigerian: 195 (0.2%)
Brazilian: 155 (0.2%)
Norwegian: 127 (0.1%)
Lebanese: 120 (0.1%)
British: 102 (0.1%)
Czech: 84 (0.10%)
Russian: 74 (0.09%)
Northern European: 54 (0.06%)
Greek: 54 (0.06%)
Barbadian: 54 (0.06%)
Lithuanian: 42 (0.05%)
Palestinian: 40 (0.05%)
Arab: 38 (0.04%)
Welsh: 37 (0.04%)
Croatian: 36 (0.04%)
Finnish: 36 (0.04%)
Eastern European: 32 (0.04%)
Belgian: 31 (0.04%)
Jamaican: 30 (0.04%)
Swedish: 26 (0.03%)
Portuguese: 25 (0.03%)
Slovene: 25 (0.03%)
Canadian: 25 (0.03%)
Haitian: 23 (0.03%)
Hungarian: 18 (0.02%)
Zimbabwean: 18 (0.02%)
Iraqi: 16 (0.02%)
Ukrainian: 15 (0.02%)
Albanian: 14 (0.02%)
Czechoslovakian: 11 (0.01%)
British West Indian: 10 (0.01%)
Kenyan: 6 (0.01%)
Pennsylvania German: 6 (0.01%)
Guyanese: 5 (0.01%)
Most common places of birth for foreign-born residents (%): Mexico Beaumont:
50.6% (6,746)Texas:
48.4% (2,411,723)
Guatemala Beaumont:
9.3% (1,246)Texas:
1.8% (87,382)
Vietnam Beaumont:
5.5% (735)Texas:
3.7% (184,770)
Pakistan Beaumont:
4.0% (537)Texas:
1.2% (62,159)
India Beaumont:
3.7% (500)Texas:
6.1% (306,347)
Honduras Beaumont:
3.4% (460)Texas:
3.0% (147,182)
Philippines Beaumont:
2.7% (358)Texas:
2.1% (103,148)
South Africa Beaumont:
1.9% (250)Texas:
0.2% (11,402)
Cuba Beaumont:
1.8% (241)Texas:
1.3% (62,978)
Canada Beaumont:
1.6% (207)Texas:
1.1% (55,371)
Place of birth for U.S.-born residents:
This state: 79,976Other state: 19,045Northeast: 1,681Midwest: 2,425South: 11,338West: 3,601 90.4% of Beaumont residents lived in the same house 1 years ago.
Out of people who lived in different houses, 36.9% lived in this county.
Out of people who lived in different counties, 80.4% lived in Texas.
Beaumont:
90.4%State average:
85.7%
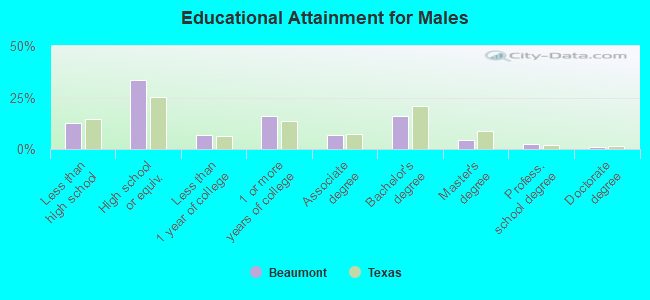
Education attainment for males 25 years and older:
No schooling: 796Nursery to 4th grade: 1315th and 6th grade: 7537th and 8th grade: 9829th grade: 42410th grade: 59311th grade: 19012th grade, no diploma: 738High school graduate (or equivalency): 11,989Less than 1 year of college: 2,504Some college more than 1 year, no degree: 5,772Associate degree: 2,459Bachelor's degree: 5,735Master's degree: 1,619Professional school degree: 885Doctorate degree: 316
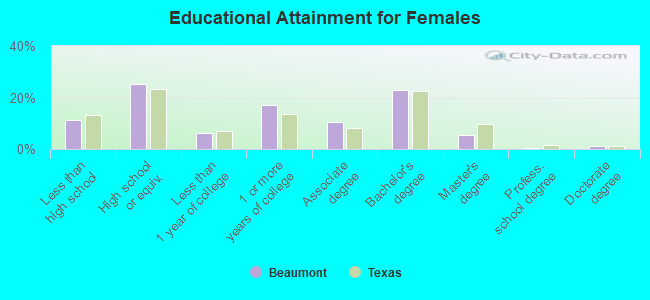
Education attainment for females 25 years and older:
No schooling: 237Nursery to 4th grade: 05th and 6th grade: 3427th and 8th grade: 8209th grade: 010th grade: 1,18911th grade: 71412th grade, no diploma: 863High school graduate (or equivalency): 9,415Less than 1 year of college: 2,294Some college more than 1 year, no degree: 6,358Associate degree: 3,911Bachelor's degree: 8,645Master's degree: 2,078Professional school degree: 216Doctorate degree: 379
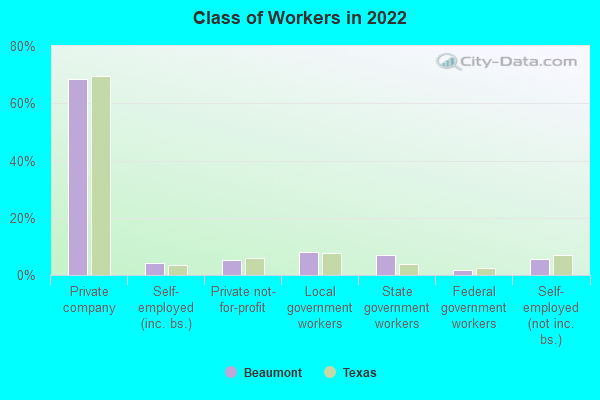
Housing units in structures:
One, detached: 33,792One, attached: 2,312Two: 1,1993 or 4: 2,8275 to 9: 3,58810 to 19: 1,48420 to 49: 1,99150 or more: 3,801Mobile homes: 968Median worth of mobile homes: $66,378
Housing units lacking complete plumbing facilities in 2022: 2.4%Housing units lacking complete kitchen facilities in 2022: 4.2%House/condo owner moved in on average 13 years ago
Renter moved in on average 2 years ago
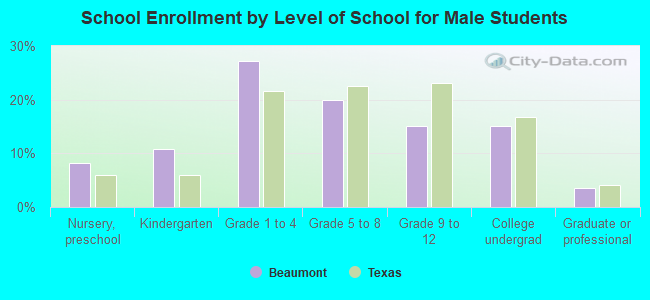
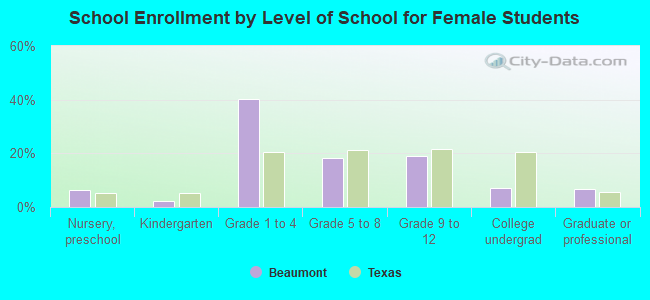
Private vs. public school enrollment:
Students in private schools in grades 1 to 8 (elementary and middle school): 1,001 Students in private schools in grades 9 to 12 (high school): 345 Students in private undergraduate colleges: 248