Work and Jobs in Beaumont, Texas (TX) Detailed Stats
Occupations, Industries, Unemployment, Workers, Commute
Settings
X


Recent posts about work in Beaumont, Texas on our local forum with over 2,400,000 registered users:
 | Best places to live between Beaumont and Houston downtown (16 replies) |
| 29yo Nigerian American with a new job in Beaumont, advice for living locations (1 reply) |
| If you work near Sabine Pass.... (2 replies) |
| Job offer in Beaumont Tx..looking for more rural areas (3 replies) |
| Beaumont, TX has become a hipster paradise (11 replies) |
| Texas Unemployment Rates (12 replies) |
Latest news about work in Beaumont, TX collected exclusively by city-data.com from local newspapers, TV, and radio stations
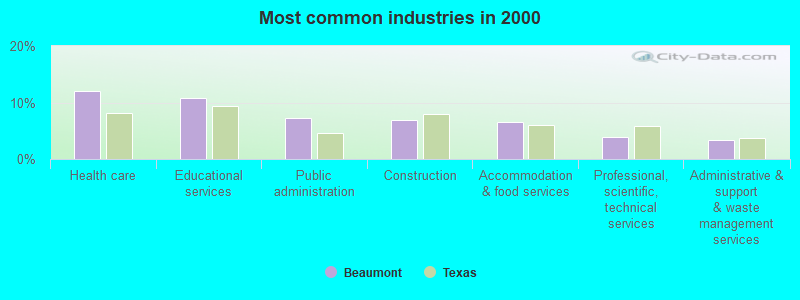
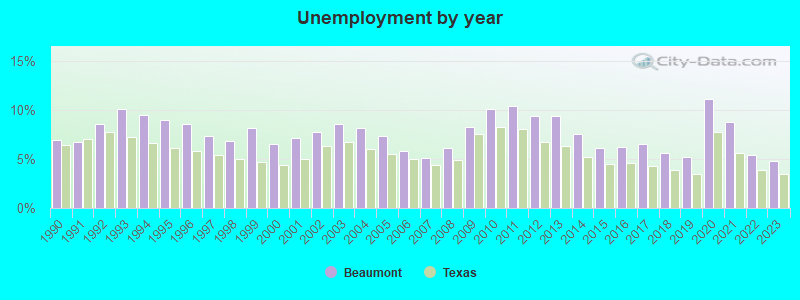
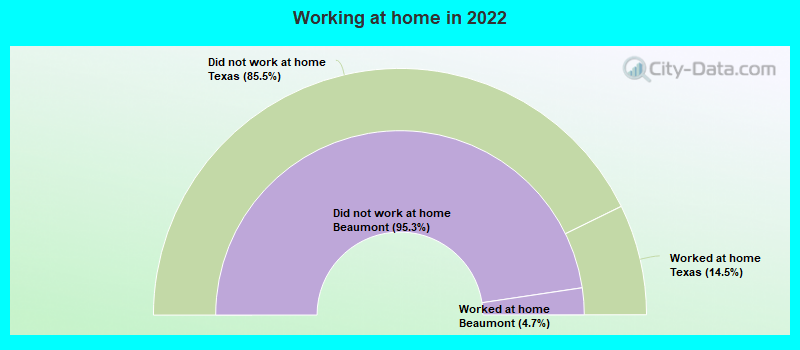
The unemployment rate in 2023 in Beaumont, TX was 4.8%, which was 27.1% greater than the unemployment rate of 3.5% across the entire state of Texas. Compared to the unemployment rate of 9.4% in 2013, this represents a decrease of 95.8%. The most common industries in Beaumont are: Health care (12.1% of civilian employees), Educational services (10.9% of civilian employees), Public administration (7.3% of civilian employees). 91.2% of workers work in Jefferson County and 3.6% of all workers work at home. 68.4% of workers are employees of private companies, which is about the same as the rate of 69.6% across the entire state of Texas.
Whole page based on the data from 2000 / 2022 when the population of Beaumont, Texas was 113,866 / 112,090
Whole page based on the data from 2000 / 2022 when the population of Beaumont, Texas was 113,866 / 112,090
Most common industries
Most common industries | |||
|---|---|---|---|
Industry | All | Males | Females |
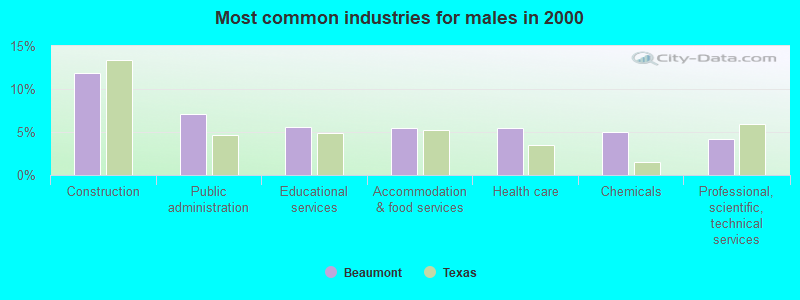
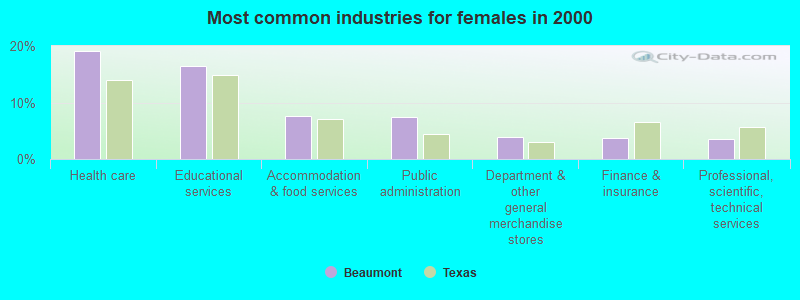
| Health care | 12.1% (5,772) | 5.4% (1,329) | 19.1% (4,443) |
| Educational services | 10.9% (5,192) | 5.6% (1,364) | 16.4% (3,828) |
| Public administration | 7.3% (3,487) | 7.1% (1,743) | 7.5% (1,744) |
| Construction | 7.0% (3,324) | 11.9% (2,903) | 1.8% (421) |
| Accommodation and food services | 6.5% (3,100) | 5.4% (1,331) | 7.6% (1,769) |
| Professional, scientific, and technical services | 3.8% (1,827) | 4.1% (1,013) | 3.5% (814) |
| Administrative and support and waste management services | 3.3% (1,566) | 3.7% (907) | 2.8% (659) |
| Chemicals | 3.1% (1,473) | 4.9% (1,209) | 1.1% (264) |
| Finance and insurance | 2.9% (1,398) | 2.3% (553) | 3.6% (845) |
| Department and other general merchandise stores | 2.5% (1,190) | 1.2% (302) | 3.8% (888) |
| Religious, grantmaking, civic, professional, and similar organizations | 2.1% (1,008) | 2.2% (544) | 2.0% (464) |
| Petroleum and coal products | 2.1% (1,006) | 3.5% (853) | 0.7% (153) |
| Food and beverage stores | 2.0% (977) | 1.9% (471) | 2.2% (506) |
| Social assistance | 2.0% (945) | 0.6% (150) | 3.4% (795) |
| Metal and metal products | 1.9% (928) | 3.5% (846) | 0.4% (82) |
| Real estate and rental and leasing | 1.8% (871) | 1.9% (463) | 1.8% (408) |
| Motor vehicle and parts dealers | 1.7% (795) | 2.4% (584) | 0.9% (211) |
| Broadcasting and telecommunications | 1.6% (754) | 1.6% (380) | 1.6% (374) |
| Repair and maintenance | 1.5% (714) | 2.5% (602) | 0.5% (112) |
| Other transportation, and support activities, and couriers | 1.3% (628) | 2.0% (497) | 0.6% (131) |
| U. S. Postal service | 1.3% (598) | 1.2% (283) | 1.4% (315) |
| Personal and laundry services | 1.2% (572) | 0.6% (135) | 1.9% (437) |
| Arts, entertainment, and recreation | 1.0% (496) | 1.4% (351) | 0.6% (145) |
| Truck transportation | 1.0% (493) | 1.8% (428) | 0.3% (65) |
| Building material and garden equipment and supplies dealers | 1.0% (492) | 1.3% (320) | 0.7% (172) |
| Utilities | 0.8% (401) | 1.3% (323) | 0.3% (78) |
| Plastics and rubber products | 0.8% (398) | 1.2% (295) | 0.4% (103) |
| Furniture and home furnishings, and household appliance stores | 0.8% (383) | 0.8% (207) | 0.8% (176) |
| Radio, TV, and computer stores | 0.7% (340) | 0.9% (209) | 0.6% (131) |
| Clothing and accessories, including shoe, stores | 0.7% (327) | 0.4% (94) | 1.0% (233) |
| Private households | 0.7% (324) | 0.0% (7) | 1.4% (317) |
| Miscellaneous manufacturing | 0.7% (321) | 0.8% (200) | 0.5% (121) |
| Pharmacies and drug stores | 0.7% (311) | 0.5% (134) | 0.8% (177) |
| Used merchandise, gift, novelty, and souvenir, and other miscellaneous stores | 0.6% (291) | 0.6% (142) | 0.6% (149) |
| Mining, quarrying, and oil and gas extraction | 0.5% (253) | 1.0% (247) | 0.0% (6) |
| Machinery, equipment, and supplies merchant wholesalers | 0.5% (249) | 0.9% (215) | 0.1% (34) |
| Gasoline stations | 0.5% (247) | 0.6% (137) | 0.5% (110) |
| Publishing, and motion picture and sound recording industries | 0.5% (241) | 0.4% (87) | 0.7% (154) |
| Agriculture, forestry, fishing and hunting | 0.4% (214) | 0.7% (181) | 0.1% (33) |
| Food | 0.4% (210) | 0.6% (152) | 0.2% (58) |
| Transportation equipment | 0.4% (197) | 0.8% (186) | 0.0% (11) |
| Machinery | 0.4% (192) | 0.6% (135) | 0.2% (57) |
| Electrical and electronic goods merchant wholesalers | 0.4% (169) | 0.5% (134) | 0.2% (35) |
| Sporting goods, camera, and hobby and toy stores | 0.3% (161) | 0.4% (95) | 0.3% (66) |
| Groceries and related products merchant wholesalers | 0.3% (150) | 0.5% (125) | 0.1% (25) |
| Rail transportation | 0.3% (143) | 0.6% (143) | 0.0% (0) |
| Paper | 0.3% (140) | 0.4% (88) | 0.2% (52) |
| Other direct selling establishments | 0.3% (139) | 0.2% (43) | 0.4% (96) |
| Data processing, libraries, and other information services | 0.3% (130) | 0.1% (28) | 0.4% (102) |
| Hardware, plumbing and heating equipment, and supplies merchant wholesalers | 0.3% (123) | 0.2% (60) | 0.3% (63) |
| Professional and commercial equipment and supplies merchant wholesalers | 0.2% (115) | 0.2% (60) | 0.2% (55) |
| Recyclable material merchant wholesalers | 0.2% (114) | 0.4% (107) | 0.0% (7) |
| Computer and electronic products | 0.2% (113) | 0.3% (66) | 0.2% (47) |
| Jewelry, luggage, and leather goods stores | 0.2% (112) | 0.1% (15) | 0.4% (97) |
| Nonmetallic mineral products | 0.2% (102) | 0.3% (73) | 0.1% (29) |
| Miscellaneous nondurable goods merchant wholesalers | 0.2% (101) | 0.3% (80) | 0.1% (21) |
| Electrical equipment, appliances, and components | 0.2% (95) | 0.3% (74) | 0.1% (21) |
| Alcoholic beverages merchant wholesalers | 0.2% (91) | 0.3% (71) | 0.1% (20) |
| Wood products | 0.2% (88) | 0.3% (73) | 0.1% (15) |
| Printing and related support activities | 0.2% (86) | 0.1% (27) | 0.3% (59) |
| Retail florists | 0.2% (83) | 0.1% (35) | 0.2% (48) |
| Health and personal care, except drug, stores | 0.2% (81) | 0.1% (22) | 0.3% (59) |
| Warehousing and storage | 0.2% (75) | 0.3% (65) | 0.0% (10) |
| Drugs, sundries, and chemical and allied products merchant wholesalers | 0.2% (74) | 0.1% (35) | 0.2% (39) |
| Petroleum and petroleum products merchant wholesalers | 0.2% (74) | 0.2% (60) | 0.1% (14) |
| Air transportation | 0.1% (71) | 0.1% (20) | 0.2% (51) |
| Motor vehicles, parts and supplies merchant wholesalers | 0.1% (62) | 0.3% (62) | 0.0% (0) |
| Office supplies and stationery stores | 0.1% (61) | 0.1% (22) | 0.2% (39) |
| Book stores and news dealers | 0.1% (56) | 0.1% (20) | 0.2% (36) |
| Lumber and other construction materials merchant wholesalers | 0.1% (48) | 0.1% (25) | 0.1% (23) |
| Beverage and tobacco products | 0.1% (39) | 0.2% (39) | 0.0% (0) |
| Water transportation | 0.1% (32) | 0.1% (32) | 0.0% (0) |
| Paper and paper products merchant wholesalers | 0.1% (31) | 0.1% (31) | 0.0% (0) |
Unemployment in Beaumont
- Unemployment by race in 2022
- Unemployment rate for White non-Hispanic residents
- 3.3%Males
- 2.7%Females
- Unemployment rate for Black residents
- 5.2%Males
- 4.0%Females
- Unemployment rate for Asian residents
- 15.7%Males
- 2.1%Females
- Unemployment rate for other race residents
- 3.5%Males
- 0.8%Females
- Unemployment rate for two or more race residents
- 7.7%Males
- 0.1%Females
- Unemployment rate for Hispanic or Latino residents
- 2.7%Males
- 1.8%Females
- Unemployment by race in 2000
- Unemployment rate for White non-Hispanic residents
- 3.9%Males
- 5.9%Females
- Unemployment rate for Black residents
- 11.8%Males
- 12.9%Females
- Unemployment rate for American Indian and Alaska Native residents
- 9.0%Males
- 28.4%Females
- Unemployment rate for Asian residents
- 2.8%Males
- 3.3%Females
- Unemployment rate for other race residents
- 6.6%Males
- 6.7%Females
- Unemployment rate for two or more race residents
- 11.0%Males
- 1.8%Females
- Unemployment rate for Hispanic or Latino residents
- 8.2%Males
- 6.6%Females
Unemployment in 2023:
| Beaumont: | 4.8% |
| Texas: | 3.5% |
Unemployment in 2022:
| Beaumont: | 5.4% |
| Texas: | 3.9% |
Unemployment in 2021:
| Beaumont: | 8.8% |
| Texas: | 5.6% |
Unemployment in 2020:
| Beaumont: | 11.1% |
| Texas: | 7.7% |
Unemployment in 2019:
| Beaumont: | 5.2% |
| Texas: | 3.5% |
Unemployment in 2018:
| Beaumont: | 5.6% |
| Texas: | 3.9% |
Unemployment in 2017:
| Beaumont: | 6.5% |
| Texas: | 4.3% |
Unemployment in 2016:
| Beaumont: | 6.2% |
| Texas: | 4.6% |
Unemployment in 2015:
| Beaumont: | 6.1% |
| Texas: | 4.5% |
Unemployment in 2014:
| Beaumont: | 7.5% |
| Texas: | 5.2% |
Unemployment in 2013:
| Beaumont: | 9.4% |
| Texas: | 6.3% |
Unemployment in 2012:
| Beaumont: | 9.4% |
| Texas: | 6.7% |
Unemployment in 2011:
| Beaumont: | 10.4% |
| Texas: | 8.0% |
Unemployment in 2010:
| Beaumont: | 10.1% |
| Texas: | 8.2% |
Unemployment in 2009:
| Beaumont: | 8.3% |
| Texas: | 7.5% |
Unemployment in 2008:
| Beaumont: | 6.1% |
| Texas: | 4.9% |
Unemployment in 2007:
| Beaumont: | 5.1% |
| Texas: | 4.4% |
Unemployment in 2006:
| Beaumont: | 5.8% |
| Texas: | 5.0% |
Unemployment in 2005:
| Beaumont: | 7.3% |
| Texas: | 5.5% |
Unemployment in 2004:
| Beaumont: | 8.1% |
| Texas: | 6.0% |
Unemployment in 2003:
| Beaumont: | 8.6% |
| Texas: | 6.7% |
Unemployment in 2002:
| Beaumont: | 7.7% |
| Texas: | 6.3% |
Unemployment in 2001:
| Beaumont: | 7.1% |
| Texas: | 5.0% |
Unemployment in 2000:
| Beaumont: | 6.5% |
| Texas: | 4.4% |
Unemployment in 1999:
| Beaumont: | 8.1% |
| Texas: | 4.7% |
Unemployment in 1998:
| Beaumont: | 6.8% |
| Texas: | 5.0% |
Unemployment in 1997:
| Beaumont: | 7.3% |
| Texas: | 5.4% |
Unemployment in 1996:
| Beaumont: | 8.6% |
| Texas: | 5.8% |
Unemployment in 1995:
| Beaumont: | 9.0% |
| Texas: | 6.1% |
Unemployment in 1994:
| Beaumont: | 9.5% |
| Texas: | 6.6% |
Unemployment in 1993:
| Beaumont: | 10.1% |
| Texas: | 7.2% |
Unemployment in 1992:
| Beaumont: | 8.6% |
| Texas: | 7.7% |
Unemployment in 1991:
| Beaumont: | 6.7% |
| Texas: | 7.0% |
Unemployment in 1990:
| Beaumont: | 6.9% |
| Texas: | 6.4% |
Time leaving home to go to work
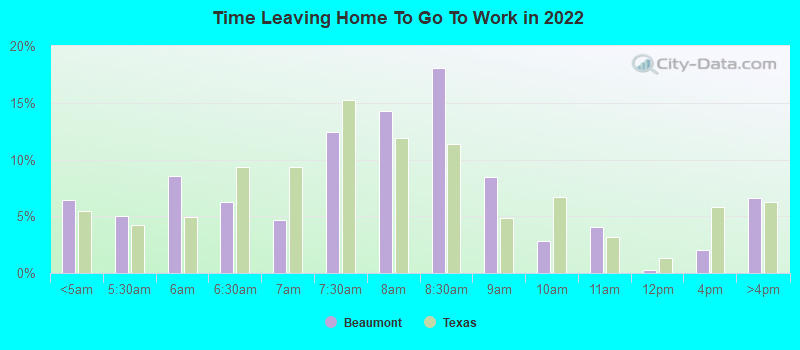
12:00 a.m. to 4:59 a.m.:
| Beaumont: | 6.5% (2,977) |
| Texas: | 5.5% (678,264) |
5:00 a.m. to 5:29 a.m.:
| Beaumont: | 5.1% (2,326) |
| Texas: | 4.3% (525,841) |
5:30 a.m. to 5:59 a.m.:
| Beaumont: | 8.6% (3,941) |
| Texas: | 4.9% (603,953) |
6:00 a.m. to 6:29 a.m.:
| Beaumont: | 6.2% (2,860) |
| Texas: | 9.4% (1,155,020) |
6:30 a.m. to 6:59 a.m.:
| Beaumont: | 4.7% (2,165) |
| Texas: | 9.3% (1,152,822) |
7:00 a.m. to 7:29 a.m.:
| Beaumont: | 12.4% (5,712) |
| Texas: | 15.3% (1,885,477) |
7:30 a.m. to 7:59 a.m.:
| Beaumont: | 14.3% (6,567) |
| Texas: | 11.9% (1,469,628) |
8:00 a.m. to 8:29 a.m.:
| Beaumont: | 18.1% (8,308) |
| Texas: | 11.3% (1,400,175) |
8:30 a.m. to 8:59 a.m.:
| Beaumont: | 8.5% (3,899) |
| Texas: | 4.9% (599,574) |
9:00 a.m. to 9:59 a.m.:
| Beaumont: | 2.8% (1,309) |
| Texas: | 6.7% (829,367) |
10:00 a.m. to 10:59 a.m.:
| Beaumont: | 4.0% (1,847) |
| Texas: | 3.2% (390,354) |
11:00 a.m. to 11:59 a.m.:
| Beaumont: | 0.3% (134) |
| Texas: | 1.3% (162,330) |
12:00 p.m. to 3:59 p.m.:
| Beaumont: | 2.0% (919) |
| Texas: | 5.8% (720,594) |
4:00 p.m. to 11:59 p.m.:
| Beaumont: | 6.6% (3,034) |
| Texas: | 6.3% (777,072) |
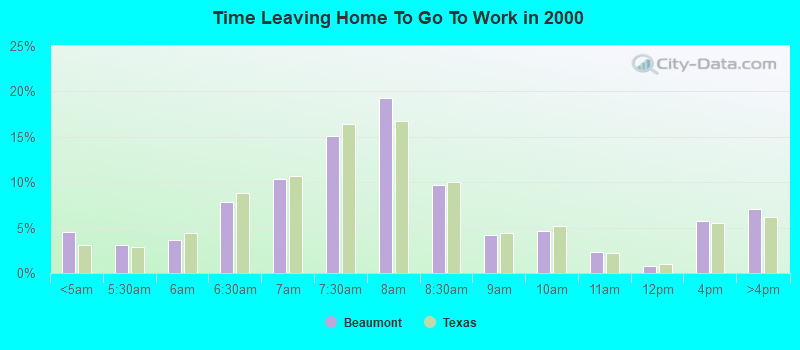
<5am:
| Beaumont: | 4.6% (2,125) |
| Texas: | 3.1% (281,361) |
5:30am:
| Beaumont: | 3.1% (1,454) |
| Texas: | 2.9% (262,060) |
6am:
| Beaumont: | 3.7% (1,711) |
| Texas: | 4.4% (403,423) |
6:30am:
| Beaumont: | 7.9% (3,661) |
| Texas: | 8.8% (808,876) |
7am:
| Beaumont: | 10.3% (4,801) |
| Texas: | 10.7% (976,557) |
7:30am:
| Beaumont: | 15.0% (7,005) |
| Texas: | 16.4% (1,500,904) |
8am:
| Beaumont: | 19.3% (8,989) |
| Texas: | 16.8% (1,536,308) |
8:30am:
| Beaumont: | 9.7% (4,497) |
| Texas: | 10.0% (913,601) |
9am:
| Beaumont: | 4.1% (1,925) |
| Texas: | 4.4% (398,656) |
10am:
| Beaumont: | 4.6% (2,131) |
| Texas: | 5.2% (472,592) |
11am:
| Beaumont: | 2.3% (1,065) |
| Texas: | 2.2% (197,844) |
12pm:
| Beaumont: | 0.7% (348) |
| Texas: | 0.9% (86,997) |
4pm:
| Beaumont: | 5.7% (2,666) |
| Texas: | 5.5% (503,565) |
>4pm:
| Beaumont: | 7.0% (3,262) |
| Texas: | 6.1% (563,107) |
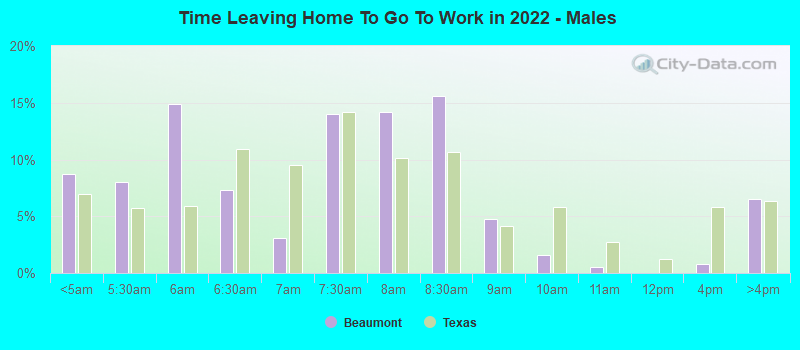
12:00 a.m. to 4:59 a.m. - Males:
| Beaumont: | 8.7% (2,217) |
| Texas: | 7.0% (477,284) |
5:00 a.m. to 5:29 a.m. - Males:
| Beaumont: | 8.0% (2,036) |
| Texas: | 5.8% (394,876) |
5:30 a.m. to 5:59 a.m. - Males:
| Beaumont: | 14.9% (3,784) |
| Texas: | 5.9% (402,788) |
6:00 a.m. to 6:29 a.m. - Males:
| Beaumont: | 7.3% (1,868) |
| Texas: | 10.9% (751,118) |
6:30 a.m. to 6:59 a.m. - Males:
| Beaumont: | 3.1% (785) |
| Texas: | 9.5% (652,306) |
7:00 a.m. to 7:29 a.m. - Males:
| Beaumont: | 14.0% (3,569) |
| Texas: | 14.1% (970,598) |
7:30 a.m. to 7:59 a.m. - Males:
| Beaumont: | 14.2% (3,610) |
| Texas: | 10.2% (696,429) |
8:00 a.m. to 8:29 a.m. - Males:
| Beaumont: | 15.6% (3,976) |
| Texas: | 10.6% (729,041) |
8:30 a.m. to 8:59 a.m. - Males:
| Beaumont: | 4.7% (1,202) |
| Texas: | 4.1% (281,762) |
9:00 a.m. to 9:59 a.m. - Males:
| Beaumont: | 1.5% (394) |
| Texas: | 5.8% (401,071) |
10:00 a.m. to 10:59 a.m. - Males:
| Beaumont: | 0.6% (143) |
| Texas: | 2.7% (186,469) |
12:00 p.m. to 3:59 p.m. - Males:
| Beaumont: | 0.8% (197) |
| Texas: | 5.8% (397,795) |
4:00 p.m. to 11:59 p.m. - Males:
| Beaumont: | 6.5% (1,652) |
| Texas: | 6.4% (435,950) |
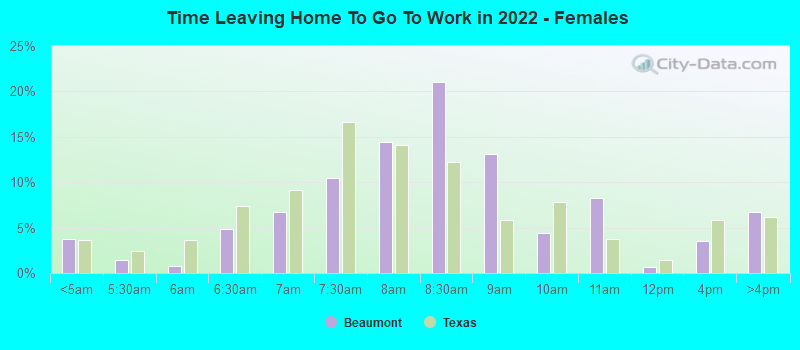
12:00 a.m. to 4:59 a.m. - Females:
| Beaumont: | 3.7% (760) |
| Texas: | 3.7% (200,980) |
5:00 a.m. to 5:29 a.m. - Females:
| Beaumont: | 1.4% (290) |
| Texas: | 2.4% (130,965) |
5:30 a.m. to 5:59 a.m. - Females:
| Beaumont: | 0.8% (157) |
| Texas: | 3.7% (201,165) |
6:00 a.m. to 6:29 a.m. - Females:
| Beaumont: | 4.8% (992) |
| Texas: | 7.4% (403,902) |
6:30 a.m. to 6:59 a.m. - Females:
| Beaumont: | 6.7% (1,380) |
| Texas: | 9.1% (500,516) |
7:00 a.m. to 7:29 a.m. - Females:
| Beaumont: | 10.4% (2,143) |
| Texas: | 16.7% (914,879) |
7:30 a.m. to 7:59 a.m. - Females:
| Beaumont: | 14.4% (2,957) |
| Texas: | 14.1% (773,199) |
8:00 a.m. to 8:29 a.m. - Females:
| Beaumont: | 21.1% (4,332) |
| Texas: | 12.2% (671,134) |
8:30 a.m. to 8:59 a.m. - Females:
| Beaumont: | 13.1% (2,697) |
| Texas: | 5.8% (317,812) |
9:00 a.m. to 9:59 a.m. - Females:
| Beaumont: | 4.4% (915) |
| Texas: | 7.8% (428,296) |
10:00 a.m. to 10:59 a.m. - Females:
| Beaumont: | 8.3% (1,704) |
| Texas: | 3.7% (203,885) |
11:00 a.m. to 11:59 a.m. - Females:
| Beaumont: | 0.7% (134) |
| Texas: | 1.5% (80,088) |
12:00 p.m. to 3:59 p.m. - Females:
| Beaumont: | 3.5% (722) |
| Texas: | 5.9% (322,799) |
4:00 p.m. to 11:59 p.m. - Females:
| Beaumont: | 6.7% (1,382) |
| Texas: | 6.2% (341,122) |
Travel time to work
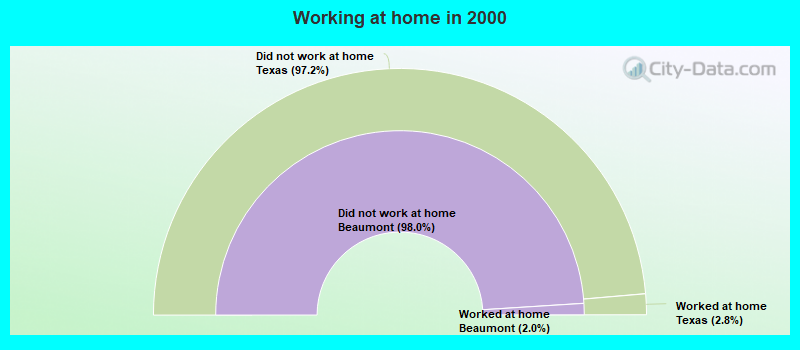
Percentage of workers working in this county: 91.2%
Number of people working at home: 1,852 (3.6% of all workers)
Daytime population change due to commuting: +21,710 (+19.1%)
Workers who live and work in this city: 34,862 (74.9%)
Number of people working at home: 1,852 (3.6% of all workers)
Daytime population change due to commuting: +21,710 (+19.1%)
Workers who live and work in this city: 34,862 (74.9%)
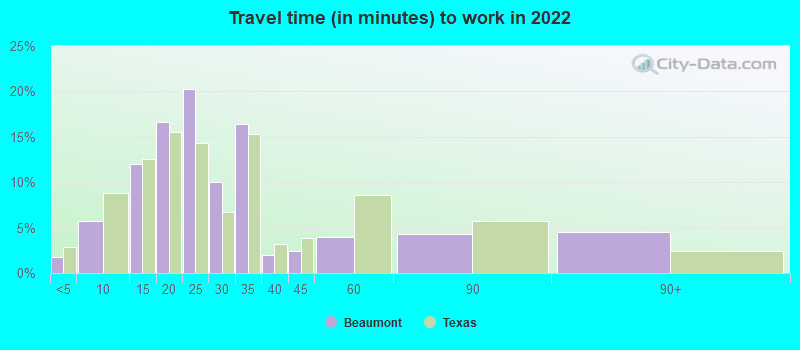
Less than 5 minutes:
| Beaumont: | 1.7% (1,255) |
| Texas: | 2.8% (350,462) |
5 to 9 minutes:
| Beaumont: | 5.7% (4,175) |
| Texas: | 8.8% (1,087,762) |
10 to 14 minutes:
| Beaumont: | 12.1% (8,785) |
| Texas: | 12.6% (1,550,271) |
15 to 19 minutes:
| Beaumont: | 16.6% (12,134) |
| Texas: | 15.6% (1,918,353) |
20 to 24 minutes:
| Beaumont: | 20.2% (14,742) |
| Texas: | 14.4% (1,772,079) |
25 to 29 minutes:
| Beaumont: | 10.0% (7,299) |
| Texas: | 6.7% (827,833) |
30 to 34 minutes:
| Beaumont: | 16.4% (11,972) |
| Texas: | 15.3% (1,887,878) |
35 to 39 minutes:
| Beaumont: | 2.0% (1,455) |
| Texas: | 3.2% (394,170) |
40 to 44 minutes:
| Beaumont: | 2.4% (1,764) |
| Texas: | 3.9% (476,118) |
45 to 59 minutes:
| Beaumont: | 3.9% (2,876) |
| Texas: | 8.6% (1,058,376) |
60 to 89 minutes:
| Beaumont: | 4.3% (3,165) |
| Texas: | 5.7% (706,002) |
90 or more minutes:
| Beaumont: | 4.5% (3,258) |
| Texas: | 2.4% (299,884) |
Less than 5 minutes:
| Beaumont: | 2.7% (1,275) |
| Texas: | 3.0% (277,642) |
5 to 9 minutes:
| Beaumont: | 13.1% (6,094) |
| Texas: | 10.3% (942,891) |
10 to 14 minutes:
| Beaumont: | 22.2% (10,329) |
| Texas: | 14.4% (1,317,555) |
15 to 19 minutes:
| Beaumont: | 23.3% (10,870) |
| Texas: | 16.0% (1,467,945) |
20 to 24 minutes:
| Beaumont: | 14.2% (6,594) |
| Texas: | 13.9% (1,276,781) |
25 to 29 minutes:
| Beaumont: | 4.2% (1,944) |
| Texas: | 5.3% (482,838) |
30 to 34 minutes:
| Beaumont: | 9.1% (4,257) |
| Texas: | 14.3% (1,309,699) |
35 to 39 minutes:
| Beaumont: | 1.3% (623) |
| Texas: | 2.4% (219,873) |
40 to 44 minutes:
| Beaumont: | 0.8% (395) |
| Texas: | 3.1% (280,916) |
45 to 59 minutes:
| Beaumont: | 2.6% (1,214) |
| Texas: | 7.6% (692,006) |
60 to 89 minutes:
| Beaumont: | 2.3% (1,083) |
| Texas: | 4.6% (418,905) |
90 or more minutes:
| Beaumont: | 2.1% (962) |
| Texas: | 2.4% (218,800) |
Less than 5 minutes - Males:
| Beaumont: | 1.8% (670) |
| Texas: | 2.7% (181,937) |
5 to 9 minutes - Males:
| Beaumont: | 3.6% (1,347) |
| Texas: | 7.6% (522,166) |
10 to 14 minutes - Males:
| Beaumont: | 9.7% (3,602) |
| Texas: | 11.5% (785,572) |
15 to 19 minutes - Males:
| Beaumont: | 17.3% (6,419) |
| Texas: | 14.6% (1,001,179) |
20 to 24 minutes - Males:
| Beaumont: | 23.7% (8,822) |
| Texas: | 13.9% (950,043) |
25 to 29 minutes - Males:
| Beaumont: | 6.1% (2,262) |
| Texas: | 6.7% (457,259) |
30 to 34 minutes - Males:
| Beaumont: | 18.1% (6,742) |
| Texas: | 16.2% (1,110,357) |
35 to 39 minutes - Males:
| Beaumont: | 1.7% (649) |
| Texas: | 3.3% (223,512) |
40 to 44 minutes - Males:
| Beaumont: | 2.3% (862) |
| Texas: | 4.2% (289,434) |
45 to 59 minutes - Males:
| Beaumont: | 3.4% (1,275) |
| Texas: | 9.3% (639,122) |
60 to 89 minutes - Males:
| Beaumont: | 4.7% (1,732) |
| Texas: | 6.8% (467,154) |
90 or more minutes - Males:
| Beaumont: | 7.4% (2,767) |
| Texas: | 3.1% (211,313) |
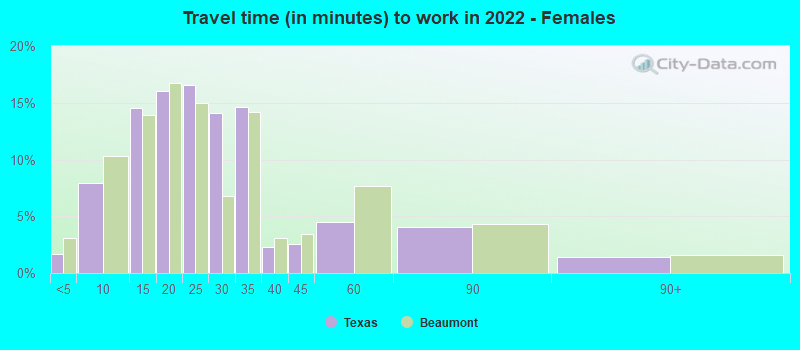
Less than 5 minutes - Females:
| Beaumont: | 1.6% (585) |
| Texas: | 3.1% (168,525) |
5 to 9 minutes - Females:
| Beaumont: | 7.9% (2,828) |
| Texas: | 10.3% (565,596) |
10 to 14 minutes - Females:
| Beaumont: | 14.5% (5,183) |
| Texas: | 13.9% (764,699) |
15 to 19 minutes - Females:
| Beaumont: | 16.0% (5,715) |
| Texas: | 16.7% (917,174) |
20 to 24 minutes - Females:
| Beaumont: | 16.6% (5,920) |
| Texas: | 15.0% (822,036) |
25 to 29 minutes - Females:
| Beaumont: | 14.1% (5,037) |
| Texas: | 6.7% (370,574) |
30 to 34 minutes - Females:
| Beaumont: | 14.6% (5,230) |
| Texas: | 14.2% (777,521) |
35 to 39 minutes - Females:
| Beaumont: | 2.3% (806) |
| Texas: | 3.1% (170,658) |
40 to 44 minutes - Females:
| Beaumont: | 2.5% (902) |
| Texas: | 3.4% (186,684) |
45 to 59 minutes - Females:
| Beaumont: | 4.5% (1,601) |
| Texas: | 7.6% (419,254) |
60 to 89 minutes - Females:
| Beaumont: | 4.0% (1,433) |
| Texas: | 4.4% (238,848) |
90 or more minutes - Females:
| Beaumont: | 1.4% (491) |
| Texas: | 1.6% (88,571) |
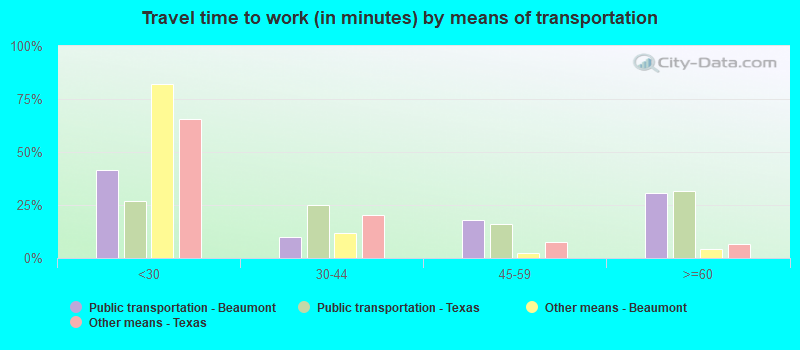
Means of transportation to work
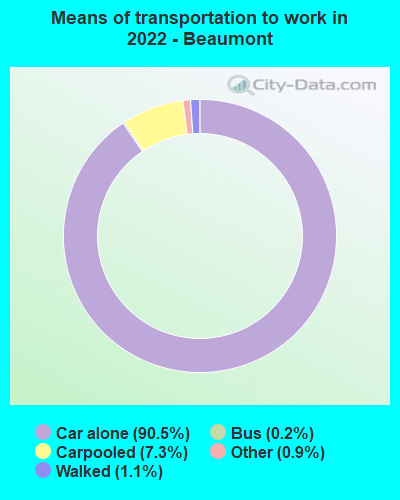

Drove car alone:
| Beaumont: | 90.5% (65,273) |
| Texas: | 83.3% (4,557,023) |
Carpooled:
| Beaumont: | 7.3% (5,282) |
| Texas: | 11.7% (674,818) |
Bus:
| Beaumont: | 0.2% (115) |
| Texas: | 0.9% (50,435) |
Bicycle:
| Beaumont: | 0.0% (22) |
| Texas: | 0.2% (7,954) |
Walked:
| Beaumont: | 1.1% (783) |
| Texas: | 1.7% (99,911) |
Other means:
| Beaumont: | 0.9% (666) |
| Texas: | 2.0% (95,481) |
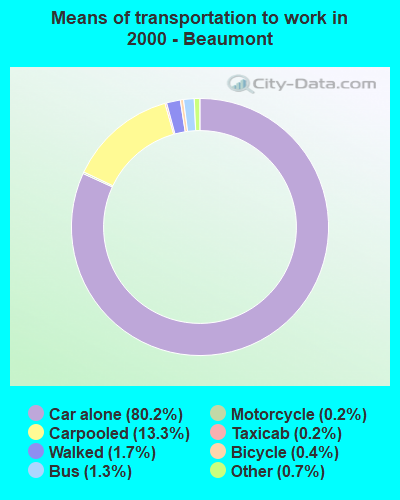

Drove car alone:
| Beaumont: | 80.2% (37,358) |
| Texas: | 77.7% (7,115,590) |
Carpooled:
| Beaumont: | 13.3% (6,173) |
| Texas: | 14.5% (1,326,012) |
Bus or trolley bus:
| Beaumont: | 1.3% (602) |
| Texas: | 1.7% (157,014) |
Streetcar or trolley car:
| Beaumont: | 0.0% (16) |
| Texas: | 0.0% (1,669) |
Subway or elevated:
| Beaumont: | 0.1% (24) |
| Texas: | 0.0% (2,371) |
Ferryboat:
| Beaumont: | 0.0% (18) |
| Texas: | 0.0% (738) |
Taxicab:
| Beaumont: | 0.2% (88) |
| Texas: | 0.1% (6,102) |
Motorcycle:
| Beaumont: | 0.2% (77) |
| Texas: | 0.1% (12,068) |
Bicycle:
| Beaumont: | 0.4% (165) |
| Texas: | 0.2% (21,551) |
Walked:
| Beaumont: | 1.7% (810) |
| Texas: | 1.9% (173,670) |
Other means:
| Beaumont: | 0.7% (309) |
| Texas: | 0.9% (86,692) |
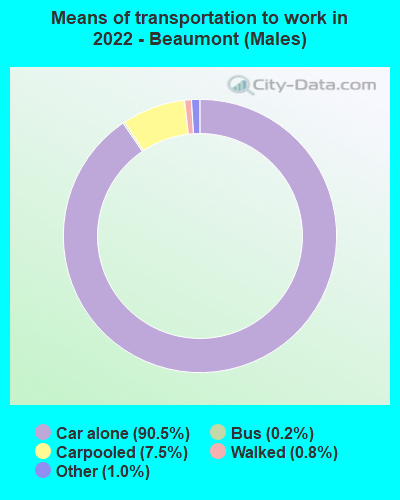

Drove car alone - Males:
| Beaumont: | 90.5% (33,043) |
| Texas: | 83.6% (4,557,023) |
Carpooled - Males:
| Beaumont: | 7.5% (2,747) |
| Texas: | 11.2% (674,818) |
Bus - Males:
| Beaumont: | 0.2% (77) |
| Texas: | 0.8% (50,435) |
Bicycle - Males:
| Beaumont: | 0.0% (18) |
| Texas: | 0.3% (7,954) |
Walked - Males:
| Beaumont: | 0.8% (282) |
| Texas: | 1.7% (99,911) |
Other means - Males:
| Beaumont: | 1.0% (354) |
| Texas: | 2.2% (95,481) |
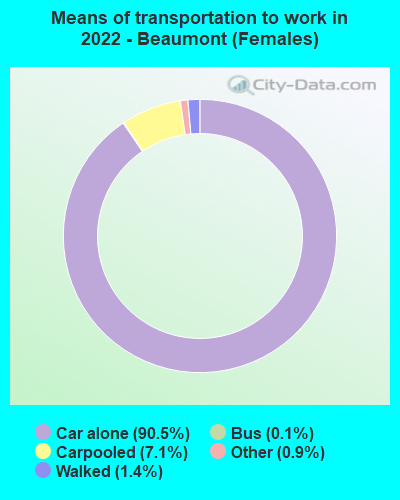

Drove car alone - Females:
| Beaumont: | 90.5% (32,257) |
| Texas: | 83.0% (4,557,023) |
Carpooled - Females:
| Beaumont: | 7.1% (2,537) |
| Texas: | 12.3% (674,818) |
Bus - Females:
| Beaumont: | 0.1% (38) |
| Texas: | 0.9% (50,435) |
Bicycle - Females:
| Beaumont: | 0.0% (4) |
| Texas: | 0.1% (7,954) |
Walked - Females:
| Beaumont: | 1.4% (503) |
| Texas: | 1.8% (99,911) |
Other means - Females:
| Beaumont: | 0.9% (312) |
| Texas: | 1.7% (95,481) |
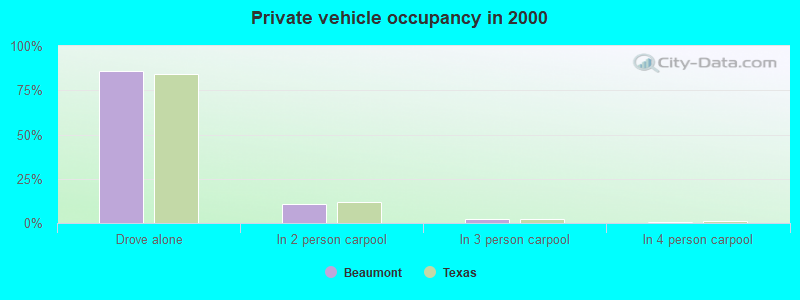
Private vehicle occupancy
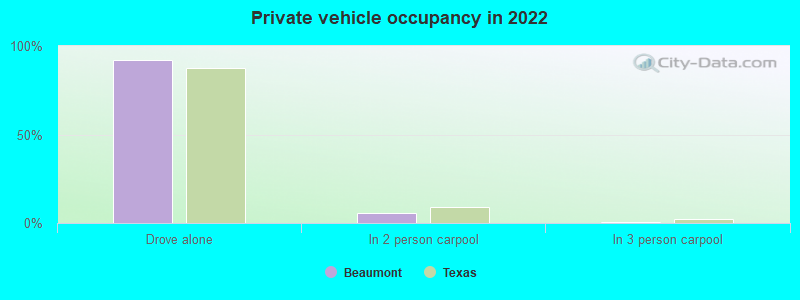
Drove alone:
| Beaumont: | 92.4% (42,665) |
| Texas: | 87.6% (10,283,021) |
In 2 person carpool:
| Beaumont: | 5.5% (2,542) |
| Texas: | 9.0% (1,052,595) |
In 3 person carpool:
| Beaumont: | 0.8% (389) |
| Texas: | 2.1% (244,139) |
In 4 person carpool:
| Beaumont: | 0.6% (284) |
| Texas: | 0.8% (92,732) |
In 5-6 person carpool:
| Beaumont: | 0.2% (103) |
| Texas: | 0.4% (44,947) |
In 7+ person carpool:
| Beaumont: | 0.0% (12) |
| Texas: | 0.1% (16,725) |
Drove alone:
| Beaumont: | 85.8% (37,358) |
| Texas: | 84.3% (7,115,590) |
In 2 person carpool:
| Beaumont: | 10.7% (4,657) |
| Texas: | 11.6% (982,994) |
In 3 person carpool:
| Beaumont: | 2.3% (1,021) |
| Texas: | 2.4% (201,602) |
In 4 person carpool:
| Beaumont: | 0.7% (289) |
| Texas: | 1.0% (83,518) |
In 5-6 person carpool:
| Beaumont: | 0.3% (138) |
| Texas: | 0.5% (40,662) |
In 7+ person carpool:
| Beaumont: | 0.2% (68) |
| Texas: | 0.2% (17,236) |
Class of workers
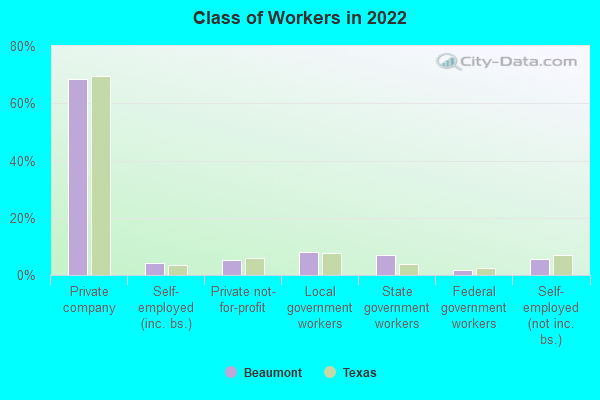
Employee of private company:
| Beaumont: | 68.4% (33,262) |
| Texas: | 69.6% (10,139,666) |
Self-employed in own incorporated business:
| Beaumont: | 4.1% (1,972) |
| Texas: | 3.5% (516,446) |
Private not-for-profit wage and salary workers:
| Beaumont: | 5.1% (2,498) |
| Texas: | 6.0% (870,454) |
Local government workers:
| Beaumont: | 7.9% (3,857) |
| Texas: | 7.6% (1,109,799) |
State government workers:
| Beaumont: | 6.9% (3,345) |
| Texas: | 3.8% (558,618) |
Federal government workers:
| Beaumont: | 1.8% (860) |
| Texas: | 2.5% (357,298) |
Self-employed workers in own not incorporated business:
| Beaumont: | 5.5% (2,698) |
| Texas: | 6.8% (998,270) |
Unpaid family workers:
| Beaumont: | 0.3% (146) |
| Texas: | 0.2% (27,882) |

Employee of private company:
| Beaumont: | 64.4% (30,750) |
| Texas: | 69.6% (6,425,274) |
Self-employed in own incorporated business:
| Beaumont: | 2.4% (1,122) |
| Texas: | 2.7% (250,864) |
Private not-for-profit wage and salary workers:
| Beaumont: | 8.6% (4,127) |
| Texas: | 5.7% (526,631) |
Local government workers:
| Beaumont: | 7.3% (3,496) |
| Texas: | 6.6% (608,479) |
State government workers:
| Beaumont: | 7.9% (3,792) |
| Texas: | 5.4% (501,082) |
Federal government workers:
| Beaumont: | 3.4% (1,627) |
| Texas: | 2.6% (237,177) |
Self-employed workers in own not incorporated business:
| Beaumont: | 5.6% (2,688) |
| Texas: | 7.1% (653,527) |
Unpaid family workers:
| Beaumont: | 0.2% (113) |
| Texas: | 0.3% (31,338) |
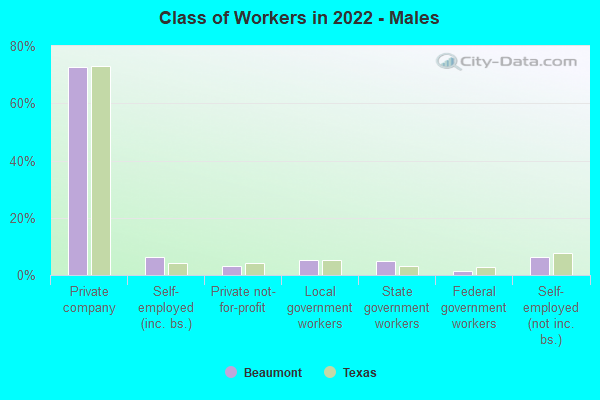
Employee of private company - Males:
| Beaumont: | 72.7% (19,162) |
| Texas: | 73.1% (5,788,450) |
Self-employed in own incorporated business - Males:
| Beaumont: | 6.3% (1,667) |
| Texas: | 4.2% (332,655) |
Private not-for-profit wage and salary workers - Males:
| Beaumont: | 3.0% (793) |
| Texas: | 4.1% (323,476) |
Local government workers - Males:
| Beaumont: | 5.1% (1,335) |
| Texas: | 5.1% (405,467) |
State government workers - Males:
| Beaumont: | 4.8% (1,254) |
| Texas: | 3.0% (236,706) |
Federal government workers - Males:
| Beaumont: | 1.4% (375) |
| Texas: | 2.7% (211,629) |
Self-employed workers in own not incorporated business - Males:
| Beaumont: | 6.1% (1,617) |
| Texas: | 7.7% (609,246) |
Unpaid family workers - Males:
| Beaumont: | 0.6% (146) |
| Texas: | 0.2% (12,606) |
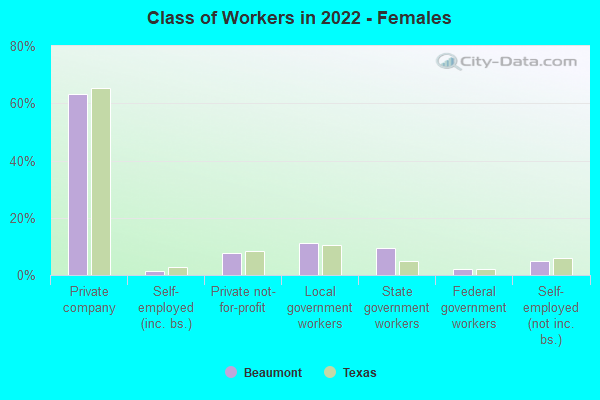
Employee of private company - Females:
| Beaumont: | 63.3% (14,100) |
| Texas: | 65.4% (4,351,216) |
Self-employed in own incorporated business - Females:
| Beaumont: | 1.4% (305) |
| Texas: | 2.8% (183,791) |
Private not-for-profit wage and salary workers - Females:
| Beaumont: | 7.6% (1,705) |
| Texas: | 8.2% (546,978) |
Local government workers - Females:
| Beaumont: | 11.3% (2,522) |
| Texas: | 10.6% (704,332) |
State government workers - Females:
| Beaumont: | 9.4% (2,091) |
| Texas: | 4.8% (321,912) |
Federal government workers - Females:
| Beaumont: | 2.2% (485) |
| Texas: | 2.2% (145,669) |
Self-employed workers in own not incorporated business - Females:
| Beaumont: | 4.8% (1,081) |
| Texas: | 5.8% (389,024) |