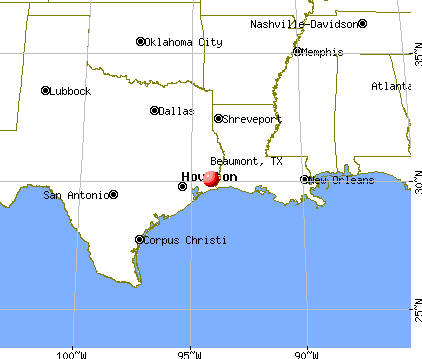
Beaumont, Texas

Beaumont: Neches River Rail Bridge

Beaumont: Panoramic picture of rainbow over Parkdale Mall
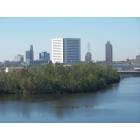
Beaumont: Beaumont TX besides the Neches River
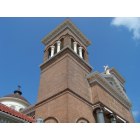
Beaumont: St. Anthony's Cathedral

Beaumont: Calm waters of the bayou fainty reflect the towering pines and oaks bedecked with a lavish Spanish moss

Beaumont: Fire Museum of Texas
Beaumont: dawntown
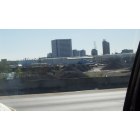
Beaumont: View of downtown Beaumont as seen from I-10
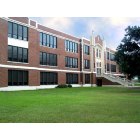
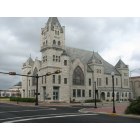
Beaumont: Historic South Park High School (built 1922) now a middle school
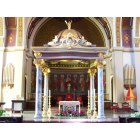
Beaumont: Interior of the Cathedral Basilica of St. Anthony

Beaumont: The Julie Rogers Theater, Beaumont Texas.
- see
22
more - add
your
Submit your own pictures of this city and show them to the world
- OSM Map
- General Map
- Google Map
- MSN Map
Population change since 2000: -1.6%
 |
| Males: 56,491 | |
| Females: 55,598 |
| Median resident age: | 35.9 years |
| Texas median age: | 35.6 years |
Zip codes: 77627, 77701, 77702, 77703, 77705, 77706, 77707, 77708, 77713.
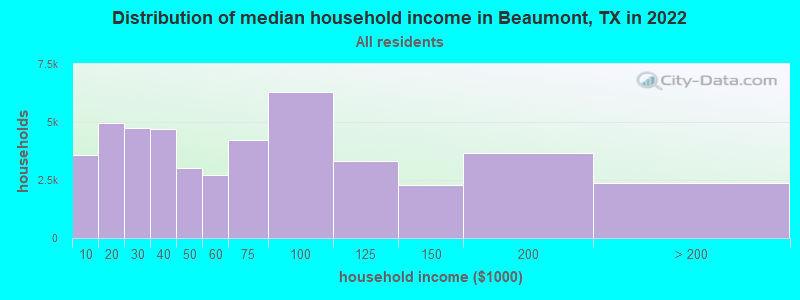
Beaumont Zip Code Map| Beaumont: | $57,944 |
| TX: | $72,284 |
Estimated per capita income in 2022: $32,829 (it was $18,632 in 2000)
Beaumont city income, earnings, and wages data
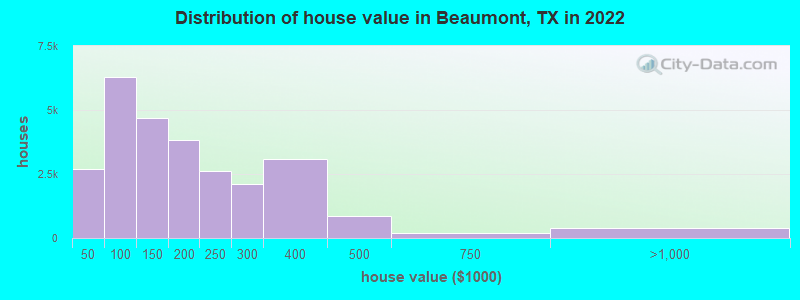
Estimated median house or condo value in 2022: $150,800 (it was $62,000 in 2000)
| Beaumont: | $150,800 |
| TX: | $275,400 |
Mean prices in 2022: all housing units: $238,380; detached houses: $239,486; townhouses or other attached units: $211,601; in 2-unit structures: $253,368; in 3-to-4-unit structures: $824,304; in 5-or-more-unit structures: $281,116; mobile homes: $69,508
Median gross rent in 2022: $974.
(9.9% for White Non-Hispanic residents, 31.2% for Black residents, 11.8% for Hispanic or Latino residents, 17.6% for American Indian residents, 32.8% for other race residents, 19.1% for two or more races residents)
Detailed information about poverty and poor residents in Beaumont, TX


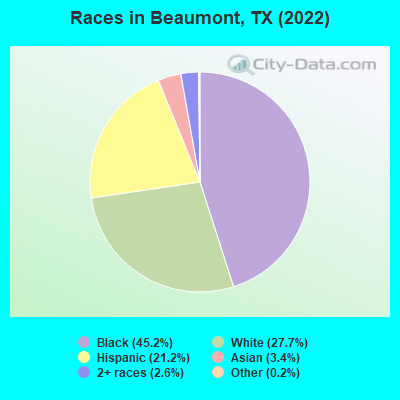
- 50,95045.2%Black alone
- 31,19127.7%White alone
- 23,94321.2%Hispanic
- 3,8353.4%Asian alone
- 2,8902.6%Two or more races
- 2150.2%Other race alone
- 360.03%American Indian alone
- 170.02%Native Hawaiian and Other
Pacific Islander alone
Races in Beaumont detailed stats: ancestries, foreign born residents, place of birth
According to our research of Texas and other state lists, there were 682 registered sex offenders living in Beaumont, Texas as of April 27, 2024.
The ratio of all residents to sex offenders in Beaumont is 174 to 1.
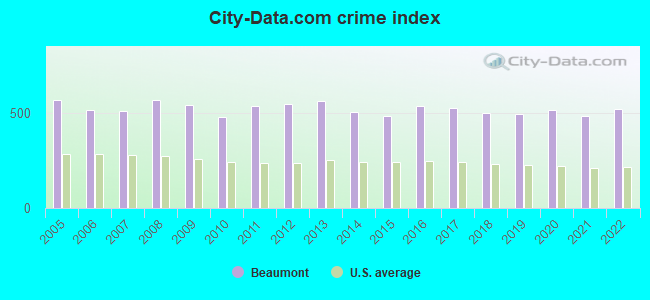
The City-Data.com crime index weighs serious crimes and violent crimes more heavily. Higher means more crime, U.S. average is 246.1. It adjusts for the number of visitors and daily workers commuting into cities.
- means the value is smaller than the state average.- means the value is about the same as the state average.
- means the value is bigger than the state average.
- means the value is much bigger than the state average.
Crime rate in Beaumont detailed stats: murders, rapes, robberies, assaults, burglaries, thefts, arson
Full-time law enforcement employees in 2021, including police officers: 319 (243 officers - 219 male; 24 female).
| Officers per 1,000 residents here: | 2.11 |
| Texas average: | 2.07 |
 Recent articles from our blog. Our writers, many of them Ph.D. graduates or candidates, create easy-to-read articles on a wide variety of topics.


Latest news from Beaumont, TX collected exclusively by city-data.com from local newspapers, TV, and radio stations
Ancestries: American (2.9%), German (2.4%), English (1.9%), Italian (1.6%), Irish (1.4%).
Current Local Time: CST time zone
Land area: 85.0 square miles.
Population density: 1,318 people per square mile (low).
13,336 residents are foreign born (7.9% Latin America, 2.4% Asia).
| This city: | 11.8% |
| Texas: | 17.1% |
Median real estate property taxes paid for housing units with mortgages in 2022: $3,594 (1.9%)
Median real estate property taxes paid for housing units with no mortgage in 2022: $1,826 (1.6%)
Nearest city with pop. 200,000+: Southeast Montgomery, TX (75.3 miles  , pop. 208,076).
Nearest city with pop. 1,000,000+: Houston, TX (78.5 miles , pop. 1,953,631).
Nearest cities:
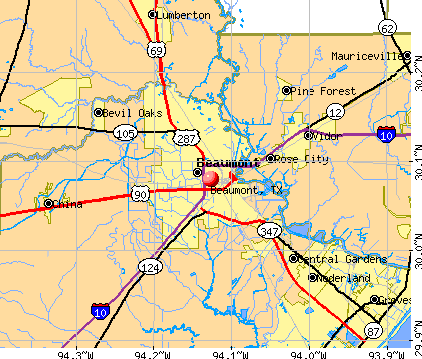
), ), ), ), )Latitude: 30.08 N, Longitude: 94.13 W
Daytime population change due to commuting: +26,244 (+23.4%)
Workers who live and work in this city: 31,943 (66.9%)
Area code: 409
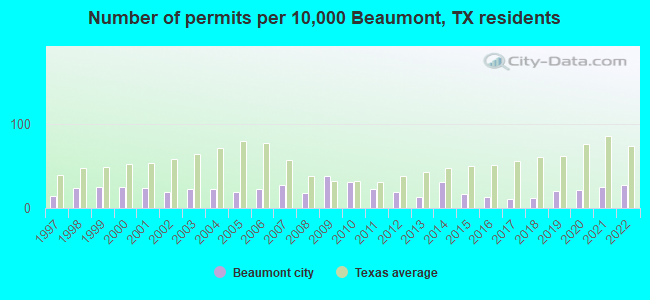
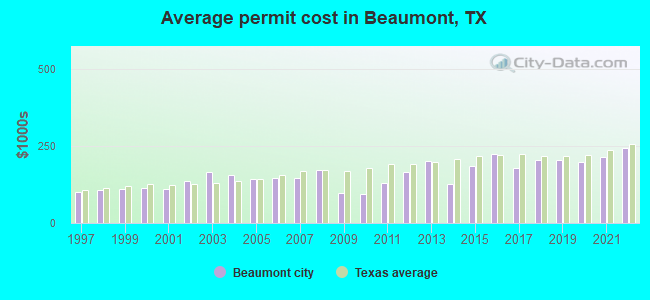
Single-family new house construction building permits:
- 2022: 309 buildings, average cost: $244,700
- 2021: 280 buildings, average cost: $215,200
- 2020: 243 buildings, average cost: $199,100
- 2019: 232 buildings, average cost: $204,900
- 2018: 139 buildings, average cost: $204,700
- 2017: 127 buildings, average cost: $179,700
- 2016: 156 buildings, average cost: $224,800
- 2015: 185 buildings, average cost: $186,100
- 2014: 354 buildings, average cost: $128,000
- 2013: 152 buildings, average cost: $201,600
- 2012: 212 buildings, average cost: $164,800
- 2011: 264 buildings, average cost: $131,400
- 2010: 351 buildings, average cost: $96,400
- 2009: 439 buildings, average cost: $97,000
- 2008: 201 buildings, average cost: $174,000
- 2007: 308 buildings, average cost: $144,900
- 2006: 265 buildings, average cost: $148,200
- 2005: 217 buildings, average cost: $144,100
- 2004: 252 buildings, average cost: $154,600
- 2003: 259 buildings, average cost: $165,400
- 2002: 212 buildings, average cost: $138,200
- 2001: 269 buildings, average cost: $109,700
- 2000: 285 buildings, average cost: $114,400
- 1999: 283 buildings, average cost: $111,800
- 1998: 276 buildings, average cost: $107,600
- 1997: 157 buildings, average cost: $99,800
| Here: | 4.8% |
| Texas: | 3.5% |
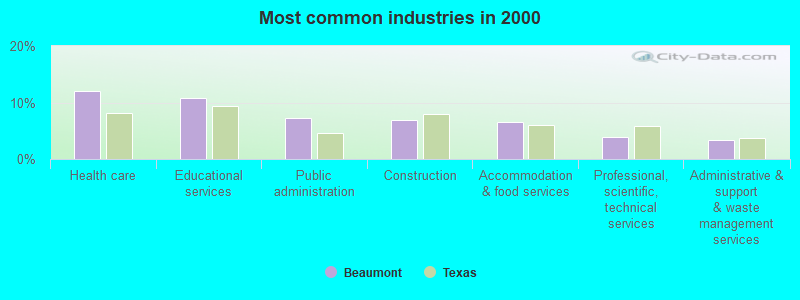
- Health care (12.1%)
- Educational services (10.9%)
- Public administration (7.3%)
- Construction (7.0%)
- Accommodation & food services (6.5%)
- Professional, scientific, technical services (3.8%)
- Administrative & support & waste management services (3.3%)
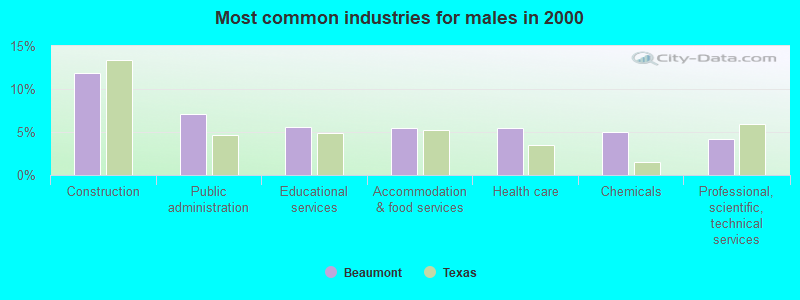
- Construction (11.9%)
- Public administration (7.1%)
- Educational services (5.6%)
- Accommodation & food services (5.4%)
- Health care (5.4%)
- Chemicals (4.9%)
- Professional, scientific, technical services (4.1%)
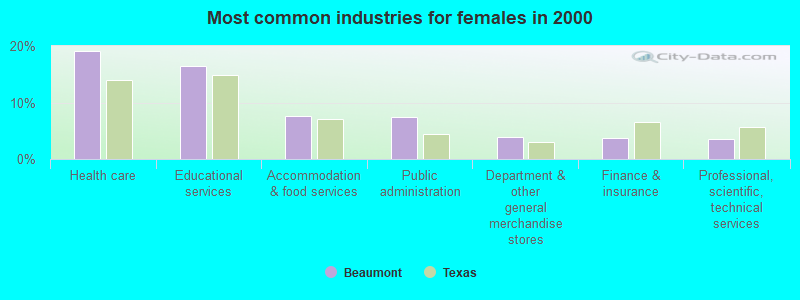
- Health care (19.1%)
- Educational services (16.4%)
- Accommodation & food services (7.6%)
- Public administration (7.5%)
- Department & other general merchandise stores (3.8%)
- Finance & insurance (3.6%)
- Professional, scientific, technical services (3.5%)
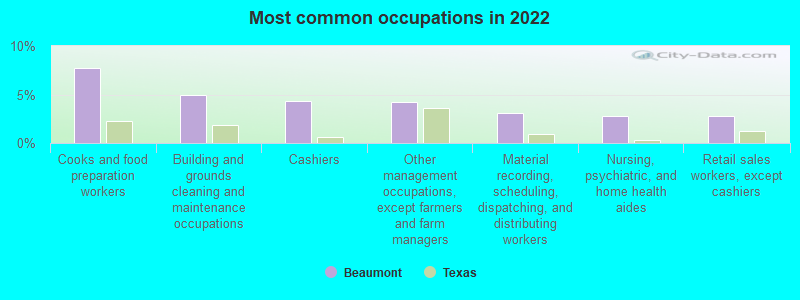
- Cooks and food preparation workers (7.7%)
- Building and grounds cleaning and maintenance occupations (4.9%)
- Cashiers (4.3%)
- Other management occupations, except farmers and farm managers (4.2%)
- Material recording, scheduling, dispatching, and distributing workers (3.1%)
- Nursing, psychiatric, and home health aides (2.8%)
- Retail sales workers, except cashiers (2.8%)
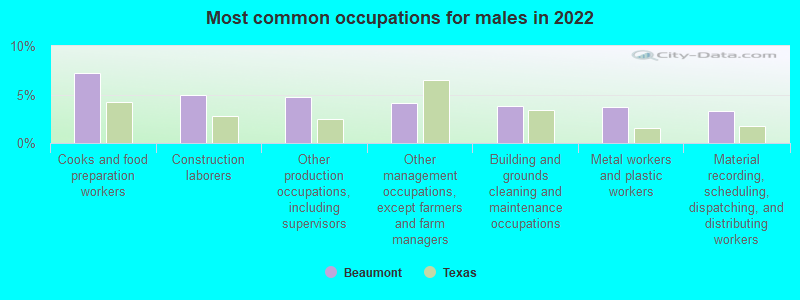
- Cooks and food preparation workers (7.2%)
- Construction laborers (4.9%)
- Other production occupations, including supervisors (4.7%)
- Other management occupations, except farmers and farm managers (4.1%)
- Building and grounds cleaning and maintenance occupations (3.8%)
- Metal workers and plastic workers (3.7%)
- Material recording, scheduling, dispatching, and distributing workers (3.3%)
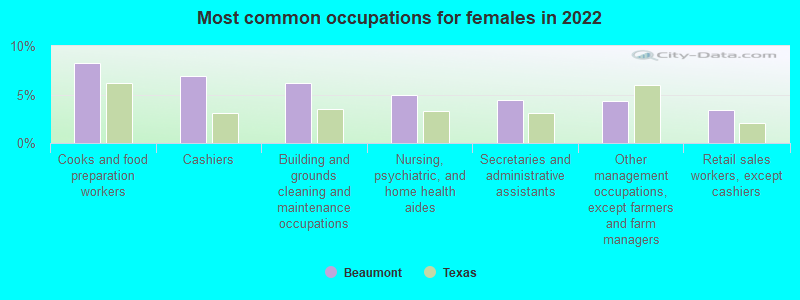
- Cooks and food preparation workers (8.3%)
- Cashiers (6.9%)
- Building and grounds cleaning and maintenance occupations (6.1%)
- Nursing, psychiatric, and home health aides (4.9%)
- Secretaries and administrative assistants (4.4%)
- Other management occupations, except farmers and farm managers (4.3%)
- Retail sales workers, except cashiers (3.4%)
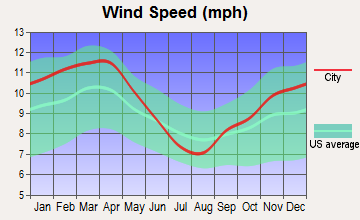
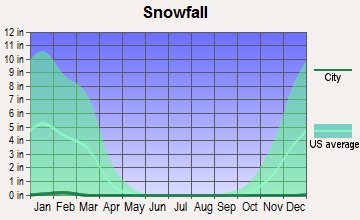
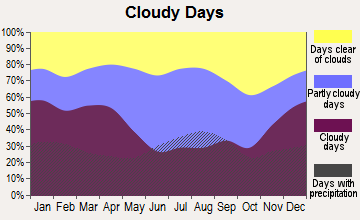
Average climate in Beaumont, Texas
Based on data reported by over 4,000 weather stations


|
|


(lower is better)
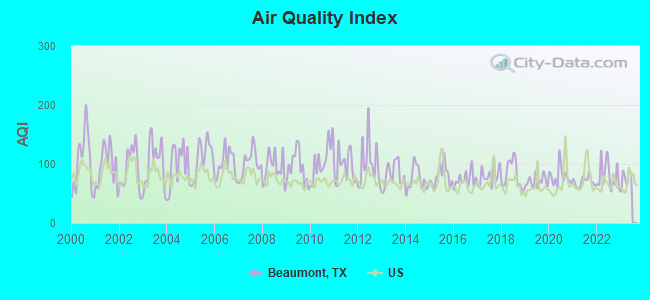
Air Quality Index (AQI) level in 2022 was 80.6. This is about average.
| City: | 80.6 |
| U.S.: | 72.6 |
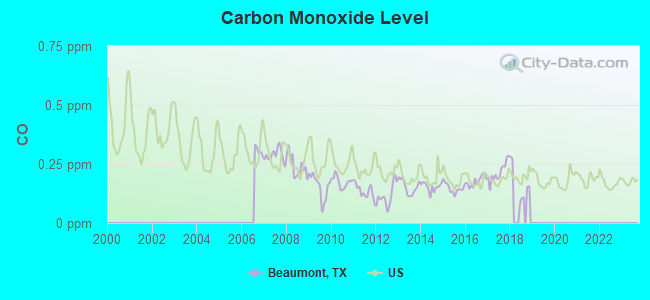
Carbon Monoxide (CO) [ppm] level in 2018 was 0.164. This is significantly better than average. Closest monitor was 3.9 miles away from the city center.
| City: | 0.164 |
| U.S.: | 0.251 |
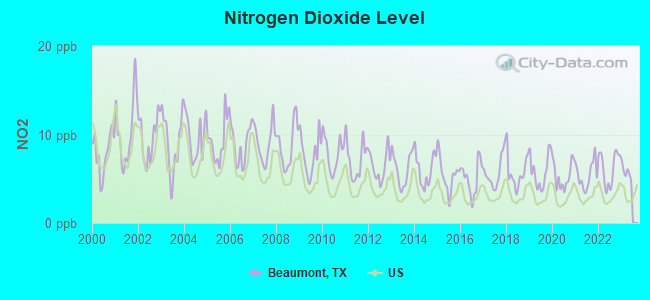
Nitrogen Dioxide (NO2) [ppb] level in 2022 was 6.23. This is worse than average. Closest monitor was 2.5 miles away from the city center.
| City: | 6.23 |
| U.S.: | 5.11 |
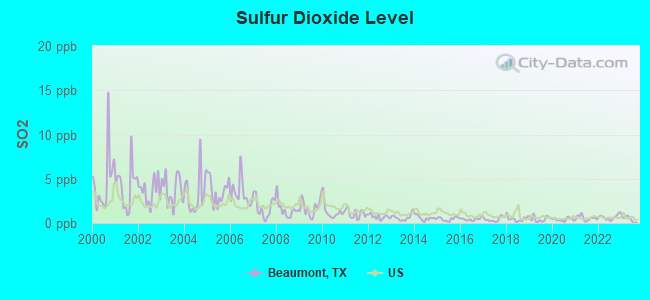
Sulfur Dioxide (SO2) [ppb] level in 2022 was 0.665. This is significantly better than average. Closest monitor was 2.5 miles away from the city center.
| City: | 0.665 |
| U.S.: | 1.515 |
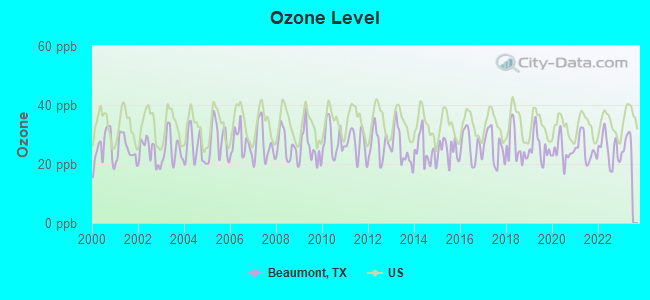
Ozone [ppb] level in 2022 was 25.0. This is better than average. Closest monitor was 3.9 miles away from the city center.
| City: | 25.0 |
| U.S.: | 33.3 |
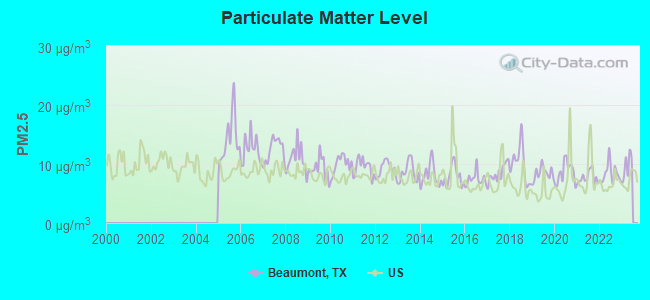
Particulate Matter (PM2.5) [µg/m3] level in 2022 was 8.38. This is about average. Closest monitor was 17.0 miles away from the city center.
| City: | 8.38 |
| U.S.: | 8.11 |
Tornado activity:
Beaumont-area historical tornado activity is slightly above Texas state average. It is 64% greater than the overall U.S. average.
On 11/7/1957, a category F4 (max. wind speeds 207-260 mph) tornado 16.6 miles away from the Beaumont city center killed one person and injured 81 people and caused between $500,000 and $5,000,000 in damages.
On 1/31/1983, a category F3 (max. wind speeds 158-206 mph) tornado 3.2 miles away from the city center injured one person and caused between $500,000 and $5,000,000 in damages.
Earthquake activity:
Beaumont-area historical earthquake activity is significantly above Texas state average. It is 38% smaller than the overall U.S. average.On 5/17/2012 at 08:12:00, a magnitude 4.8 (4.8 MW, Depth: 3.1 mi, Class: Light, Intensity: IV - V) earthquake occurred 128.5 miles away from the city center
On 9/2/2013 at 23:51:15, a magnitude 4.3 (4.3 MW, Depth: 2.9 mi) earthquake occurred 127.8 miles away from the city center
On 9/2/2013 at 21:52:38, a magnitude 4.2 (4.2 MW, Depth: 3.0 mi) earthquake occurred 132.6 miles away from Beaumont center
On 10/20/2011 at 12:24:41, a magnitude 4.8 (4.8 MW, Depth: 3.1 mi) earthquake occurred 252.4 miles away from the city center
On 1/25/2013 at 07:01:19, a magnitude 4.1 (4.1 MB, Depth: 3.1 mi) earthquake occurred 122.4 miles away from the city center
On 5/10/2012 at 15:15:38, a magnitude 3.9 (3.9 MW, Depth: 4.3 mi, Class: Light, Intensity: II - III) earthquake occurred 131.9 miles away from Beaumont center
Magnitude types: body-wave magnitude (MB), moment magnitude (MW)
Natural disasters:
The number of natural disasters in Jefferson County (23) is greater than the US average (15).Major Disasters (Presidential) Declared: 14
Emergencies Declared: 6
Causes of natural disasters: Hurricanes: 8, Storms: 8, Floods: 7, Tornadoes: 4, Tropical Storms: 4, Fire: 1, Flash Flood: 1, Other: 2 (Note: some incidents may be assigned to more than one category).
Main business address for: ENTERGY GULF STATES INC (ELECTRIC SERVICES), CONNS INC (RETAIL-RADIO TV & CONSUMER ELECTRONICS STORES).
Hospitals in Beaumont:
- A D A LIVING CENTER (5010 ADA)
- BUCKINGHAM GROUP HOME (3825 BUCKINGHAM ROW)
- CENTRAL HOUSE (4655 HOLST ST)
- FANNIN PAVILION (provides emergency services, 3250 FANNIN STREET)
- HORIZON HOUSE ICF MR (4176 TREADWAY)
- LANDIS GROUP HOME (9165 LANDIS)
- MCANELLY LIVING CENTER (5125 MCANELLY)
- NORTH HOUSE (8185 PARK N DR)
- SAMS WAY LIVING CENTER (1760 SAMS WAY)
- ST ELIZABETH HOS SE TX HME CRE AND HOSPI (3010 HARRISON SUITE 202)
- THOUSAND OAKS LIVING CENTER (8255 SHILOH)
Airports and heliports located in Beaumont:
- Beaumont Municipal Airport (BMT) (Runways: 2, Itinerant Ops: 5,000, Local Ops: 10,000, Military Ops: 500)
- Stonecipher Airport (55TX) (Runways: 1)
- Baptist Hospital Of Se Texas Heliport (TS09)
- Hyco Heliport Nr 3 (8TA6)
- Kbmt-Tv Heliport (13TA)
- Sheraton Spindletop Hotel Heliport (TS10)
Colleges/Universities in Beaumont:
- Lamar University (Full-time enrollment: 13,658; Location: 4400 MLK Blvd; Public; Website: www.lamar.edu; Offers Doctor's degree)
- Lamar Institute of Technology (Full-time enrollment: 2,023; Location: 855 E Lavaca; Public; Website: www.lit.edu)
- Kaplan College-Beaumont (Full-time enrollment: 497; Location: 6115 Eastex Freeway; Private, for-profit; Website: www.kaplancollege.com/beaumont-tx/)
- Academy of Hair Design-Beaumont (Full-time enrollment: 75; Location: 3141 College, Suite A-10; Private, for-profit; Website: academyhairdesign.net)
Other colleges/universities with over 2000 students near Beaumont:
- McNeese State University (about 55 miles; Lake Charles, LA; Full-time enrollment: 7,444)
- Lee College (about 57 miles; Baytown, TX; FT enrollment: 4,278)
- SOWELA Technical Community College (about 59 miles; Lake Charles, LA; FT enrollment: 2,160)
- The University of Texas Medical Branch (about 66 miles; Galveston, TX; FT enrollment: 2,314)
- San Jacinto Community College (about 67 miles; Pasadena, TX; FT enrollment: 13,517)
- University of Houston-Clear Lake (about 68 miles; Houston, TX; FT enrollment: 5,833)
- College of the Mainland (about 71 miles; Texas City, TX; FT enrollment: 2,739)
Biggest public high schools in Beaumont:
- WEST BROOK SR H S (Students: 2,463, Location: 8750 PHELAN BLVD, Grades: 9-12)
- CENTRAL SENIOR H S (Students: 1,596, Location: 88 JAGUAR DR, Grades: 9-12)
- HARMONY SCIENCE ACADEMY- BEAUMONT (Students: 502, Location: 4055 CALDER AVE, Grades: KG-12, Charter school)
- PAUL A BROWN ALTERNATIVE CENTER (Students: 137, Location: 3410 AUSTIN ST, Grades: 9-12)
- PATHWAYS LEARNING CTR (Students: 131, Location: 3410 AUSTIN ST, Grades: 6-12)
- EVOLUTION ACADEMY BEAUMONT (Location: 3920 W CARDINAL DR, Grades: 9-12, Charter school)
- JEFFERSON CO YOUTH ACAD (Location: 5030 STE 100 HWY 69, Grades: 9-11)
- OZEN H S (Location: 3443 FANNETT RD, Grades: 9-12)
- O C TAYLOR CTR (Location: 2330 N ST, Grades: 9-12)
- JEFFERSON CO YOUTH ACAD (Location: 5030 HWY 69S STE 100, Grades: 10-12)
Private high schools in Beaumont:
Biggest public elementary/middle schools in Beaumont:
- PIETZSCH/MAC ARTHUR EL (Students: 1,111, Location: 4301 HIGHLAND AVE, Grades: PK-5)
- ODOM MIDDLE (Students: 824, Location: 2550 W VIRGINIA AVE, Grades: 6-8)
- VINCENT MIDDLE (Students: 799, Location: 350 ELDRIDGE DR, Grades: 6-8)
- FLETCHER EL (Students: 742, Location: 1050 AVE E, Grades: PK-5)
- REGINA HOWELL EL (Students: 739, Location: 5850 REGINA, Grades: PK-5)
- GUESS EL (Students: 662, Location: 8055 VOTH RD, Grades: PK-5)
- CALDWOOD EL (Students: 577, Location: 102 BERKSHIRE LN, Grades: PK-5)
- HAMSHIRE-FANNETT EL (Students: 549, Location: 23395 BURRELL WINGATE RD, Grades: PK-3)
- CURTIS EL (Students: 528, Location: 6225 N CIRCUIT, Grades: PK-5)
- HOMER DR EL (Students: 480, Location: 8950 HOMER DR, Grades: PK-5)
Private elementary/middle schools in Beaumont:
- ST ANNE CATHOLIC SCHOOL (Students: 556, Location: 375 N 11TH ST, Grades: PK-8)
- ALL SAINTS EPISCOPAL SCHOOL (Students: 379, Location: 4108 DELAWARE ST, Grades: PK-8)
- ST ANTHONY CATHEDRAL BASILICA SCHOOL (Students: 203, Location: 850 FORSYTHE ST, Grades: PK-8)
- OUR MOTHER OF MERCY CATHOLIC SCHOOL (Students: 66, Location: 3390 SARAH ST, Grades: PK-5)
Libraries in Beaumont:
- BEAUMONT PUBLIC LIBRARY SYSTEM (Operating income: $3,069,461; Location: 801 PEARL ST; 387,492 books; 13,212 audio materials; 11,023 video materials; 4 local licensed databases; 50 state licensed databases; 285 print serial subscriptions; 4 electronic serial subscriptions)
- JEFFERSON COUNTY LIBRARY (Operating income: $266,944; Location: 7933 VITERBO RD STE 7; 36,642 books; 2,445 audio materials; 1,801 video materials; 50 state licensed databases; 103 print serial subscriptions)
User-submitted facts and corrections:
- Your category Libraries did not include the following: Mary & John Gray Library Lamar University 4400 MLK Blvd. (P.O. Box 10021) Beaumont, TX 77710 409/880-7011 Regular hours: Mon - Thurs: 7:30 am - 12:00 am Friday 7:30 am - 6:00 pm Saturday 10:00 am - 7:00 pm Sunday 2:00 pm - 12:00 am and Tyrrell Historical Library 695 Pearl Street (P.O. Box 3827) Beaumont, TX 77704-3827 409/833-2759 Hours: Tues - Sat. 8:30 - 5:30 One of the top 5 Genealogical repositories in the state
- Please add the following churches: St. Stephen's Episcopal Church, St. Mark's Episcopal Church, St. Jude Thaddeus Catholic Church, St. Anne's Catholic Church, First Baptist Church, First United Methodist Church,Wesley United Methodist Church, Redeemer Lutheran Church, Bethlehem Lutheran Church, St. John Lutheran Church, Trinity United Methodist Church,St. Anthony Cathedral,Our Mother of Mercy Catholic Church, First Christian Church, Sabine Tabernacle, Ridgewood Church of Christ, St. Andrew's Presbyterian Church, Westminister Presbyterian Church, Reformed Presbyterian Church, The Apostolic Church, Calvary Baptist Church, Calder Baptist Church, Church of Jesus Christ of Latter Day Saints, Temple Emanuel Synagogue and many, many more.
- This is a very informative and user friendly web site. added by Dan
Points of interest:
Notable locations in Beaumont: Beaumont Country Club (A), Oaks Country Club (B), Beaumont Yacht Club Marina (C), Boys Haven (D), Brooks (E), Colliers Ferry (F), Beaumont Commercial District (G), Santa Fe Station (H), South Texas State Fairground (I), Southern Pacific Station (J), Beaumont Emergency Services Training Complex (K), Beaumont Fire Department Administrative Building (L), French Home Trading Post (M), Lamar Institute of Technology Regional Fire Academy (N), Holmes Duke House (O), Hinchee House (P), Idle Hours Manor (Q), Jefferson Theater (R), McFaddin House Complex (S), Mildred Buildings (T). Display/hide their locations on the map
Shopping Center: Parkdale Shopping Center (1). Display/hide its location on the map
Main business address in Beaumont include: ENTERGY GULF STATES INC (A), CONNS INC (B). Display/hide their locations on the map
Churches in Beaumont include: Roberts Avenue Church (A), Saint Andrews Church (B), Trinity Church (C), Tyrrell Park Church (D), Jenkins Chapel (E), Mount Zion Church (F), Starlight Church (G), Mount Rose Church (H), Victory Church (I). Display/hide their locations on the map
Cemeteries: Anthony Cemetery (1), Spell Cemetery (2), Hebert Cemetery (3), Forest Lawn Memorial Park (4), Magnolia Cemetery (5). Display/hide their locations on the map
Streams, rivers, and creeks: Willow Marsh Bayou (A), Pine Island Bayou (B). Display/hide their locations on the map
Parks in Beaumont include: Hebert Park (1), Chaison Park (2), Wiess Park (3), Caldwood Park (4), Forest Park (5), Perlstein Park (6), Durley Stadium (7), Combest Park (8), Haynes Park (9). Display/hide their locations on the map
Tourist attractions: Beaumont Heritage Society - Office (Museums; 3025 French Road) (1), Art Musuem of Se Texas (Museums; 500 Main Street) (2), Clifton Steamboat Museum (8727 Highway 124) (3), Beaumont City - Convention & Visitors Bureau- Visitors Center (Museums; 1750 Interstate 10 East) (4), Babe Didrikson Zaharias Museum (1750 Interstate 10 East) (5), Edison Museum (Cultural Attractions- Events- & Facilities; 350 Pine Street) (6), Beaumont Convention & Visitors Bureau - Visitor's Center (Cultural Attractions- Events- & Facilities; 1750 Interstate 10 East) (7), French John J Museum (Cultural Attractions- Events- & Facilities; 3025 French Road) (8). Display/hide their approximate locations on the map
Hotels: Beaumont-Days Inn (30 Interstate 10 N) (1), Bed & Breakfast Texas Style (6374 Ivanhoe Lane) (2), Alamo Plaza Motel (1930 College St) (3), Best Value Inn Hotel (2525 North 11th Street) (4), Best Western Beaumont Inn - Jefferson Inn (1610 Interstate 10 South) (5), Budget Inn Beaumont (5375 College Street) (6), Austin Motor Hotel (590 North 11th Street) (7), Castle Motel (1125 North 11th Street) (8), Best Western Jefferson Inn (1610 Interstate 10 South) (9). Display/hide their approximate locations on the map
Courts: Jefferson County - County Clerk- County Court at Law Clerk (1001 Pearl Street) (1), Jefferson County - Commissioners Court- Constable Precinct 1 Charles H (1001 Pearl Street) (2), Jefferson County - Commissioners Court- Commissioner Precinct 4 Everette Bo Al (Boyt Road) (3), Jefferson County - Commissioners Court- Commissioner Precinct 4 Ed M (1149 Pearl Street) (4), Jefferson County - Commissioners Court- Commissioner Precinct 1 Jimmie P Cok (1149 Pearl Street) (5), Government - District Attorney Court House (1001 Pearl Street) (6), Government - Municipal Court (255 College Street) (7), Government Frequently Called Numbers - Court House (County Court House) (8), Texas State - Court Of Appeals- Ninth Court Of Appeals (1001 Pearl Street) (9). Display/hide their approximate locations on the map
Birthplace of: Murder of James Byrd, Jr. - People, Nick Lampson - Politician, L. Q. Jones - Actor, Frank Robinson - (born 1935), baseball player, Dick Campbell (producer) - Arts administrator, Robert Crippen - astronaut, Jay Bruce - Baseball player, Bradley Dale Peveto - Football coach, H. Palmer Hall - Poet, Mel Farr - Football player.
Drinking water stations with addresses in Beaumont and their reported violations in the past:
CARDINAL MEADOWS IMPROVEMENT DISTRICT (Population served: 162, Purch surface water):Past monitoring violations:
- Follow-up Or Routine LCR Tap M/R - In OCT-01-2013, Contaminant: Lead and Copper Rule
- Follow-up Or Routine LCR Tap M/R - In OCT-01-2011, Contaminant: Lead and Copper Rule
- Monitoring and Reporting (DBP) - Between APR-2009 and JUN-2009, Contaminant: Chlorine. Follow-up actions: St Public Notif requested (OCT-01-2009), St Violation/Reminder Notice (OCT-01-2009), St Public Notif received (OCT-26-2009), St Compliance achieved (JUL-17-2014)
- Monitoring and Reporting (DBP) - Between JAN-2009 and MAR-2009, Contaminant: Chlorine. Follow-up actions: St Public Notif requested (JUL-21-2009), St Violation/Reminder Notice (JUL-21-2009), St Compliance achieved (JUL-17-2014)
- Monitoring and Reporting (DBP) - Between OCT-2008 and DEC-2008, Contaminant: Chlorine. Follow-up actions: St Public Notif requested (MAR-27-2009), St Violation/Reminder Notice (MAR-27-2009), St Compliance achieved (JUL-17-2014)
- 4 routine major monitoring violations
| This city: | 2.5 people |
| Texas: | 2.8 people |
| This city: | 63.2% |
| Whole state: | 69.9% |
| This city: | 5.9% |
| Whole state: | 6.0% |
Likely homosexual households (counted as self-reported same-sex unmarried-partner households)
- Lesbian couples: 0.4% of all households
- Gay men: 0.3% of all households
People in group quarters in Beaumont in 2010:
- 1,949 people in college/university student housing
- 1,029 people in state prisons
- 871 people in local jails and other municipal confinement facilities
- 513 people in nursing facilities/skilled-nursing facilities
- 265 people in group homes intended for adults
- 175 people in correctional residential facilities
- 132 people in other noninstitutional facilities
- 95 people in emergency and transitional shelters (with sleeping facilities) for people experiencing homelessness
- 39 people in residential treatment centers for adults
- 18 people in group homes for juveniles (non-correctional)
- 12 people in workers' group living quarters and job corps centers
- 11 people in residential treatment centers for juveniles (non-correctional)
- 10 people in correctional facilities intended for juveniles
- 7 people in in-patient hospice facilities
- 7 people in maritime/merchant vessels
People in group quarters in Beaumont in 2000:
- 847 people in local jails and other confinement facilities (including police lockups)
- 771 people in nursing homes
- 596 people in college dormitories (includes college quarters off campus)
- 331 people in halfway houses
- 130 people in other group homes
- 111 people in other noninstitutional group quarters
- 78 people in other nonhousehold living situations
- 77 people in homes or halfway houses for drug/alcohol abuse
- 27 people in short-term care, detention or diagnostic centers for delinquent children
- 26 people in religious group quarters
- 23 people in unknown juvenile institutions
- 20 people in hospitals or wards for drug/alcohol abuse
- 19 people in mental (psychiatric) hospitals or wards
- 6 people in wards in general hospitals for patients who have no usual home elsewhere
- 6 people in homes for the mentally retarded
Banks with most branches in Beaumont (2011 data):
- Compass Bank: 7 branches. Info updated 2011/02/24: Bank assets: $63,107.0 mil, Deposits: $46,232.4 mil, headquarters in Birmingham, AL, negative income in the last year, Commercial Lending Specialization, 720 total offices, Holding Company: Banco Bilbao Vizcaya Argentaria, S.A.
- Capital One, National Association: Dowlen Rd. Branch, Main Office-Beaumont Branch, Midtown Branch, Phelan Boulevard Branch, Gateway Branch. Info updated 2011/07/01: Bank assets: $133,477.8 mil, Deposits: $97,063.7 mil, headquarters in Mclean, VA, positive income, 984 total offices, Holding Company: Capital One Financial Corporation
- CommunityBank of Texas, N.A.: Highway 105 At Major Drive Branch, Communitybank Of Texas, N.A., Communitybank Phelan Branch, Cb-Park Street Branch. Info updated 2009/11/17: Bank assets: $1,515.3 mil, Deposits: $1,309.1 mil, local headquarters, positive income, Commercial Lending Specialization, 28 total offices, Holding Company: Cbfh, Inc.
- Wells Fargo Bank, National Association: Beaumont West Branch, Phelan Branch, Beaumont I-10 Branch, Dowlen Branch. Info updated 2011/04/05: Bank assets: $1,161,490.0 mil, Deposits: $905,653.0 mil, headquarters in Sioux Falls, SD, positive income, 6395 total offices, Holding Company: Wells Fargo & Company
- JPMorgan Chase Bank, National Association: Washington Boulevard Branch, Parkdale Branch, Beaumont Branch. Info updated 2011/11/10: Bank assets: $1,811,678.0 mil, Deposits: $1,190,738.0 mil, headquarters in Columbus, OH, positive income, International Specialization, 5577 total offices, Holding Company: Jpmorgan Chase & Co.
- Bank of America, National Association: West Beaumont Branch at 256 Dowlen Road, branch established on 1985/01/14; Beaumont Branch at 2615 Calder Street, branch established on 1955/04/18. Info updated 2009/11/18: Bank assets: $1,451,969.3 mil, Deposits: $1,077,176.8 mil, headquarters in Charlotte, NC, positive income, 5782 total offices, Holding Company: Bank Of America Corporation
- MidSouth Bank, National Association: Beaumont Branch at 3200 Avenue A, branch established on 1992/11/30; Beaumont Branch at 555 North Dowlen Road, branch established on 1959/08/08. Info updated 2012/01/09: Bank assets: $1,396.1 mil, Deposits: $1,192.9 mil, headquarters in Lafayette, LA, positive income, Commercial Lending Specialization, 44 total offices, Holding Company: Midsouth Bancorp, Inc.
- Prosperity Bank: Beaumont Branch at 6150 Eastex Freeway, branch established on 1889/01/01. Info updated 2012/01/05: Bank assets: $9,816.2 mil, Deposits: $8,064.8 mil, headquarters in El Campo, TX, positive income, Mortgage Lending Specialization, 187 total offices, Holding Company: Prosperity Bancshares, Inc.
- Third Coast Bank, SSB: Beaumont Branch at 229 Dowlen Suite C, branch established on 2009/04/01. Info updated 2011/08/11: Bank assets: $228.6 mil, Deposits: $197.8 mil, headquarters in Humble, TX, positive income, Commercial Lending Specialization, 3 total offices
For population 15 years and over in Beaumont:
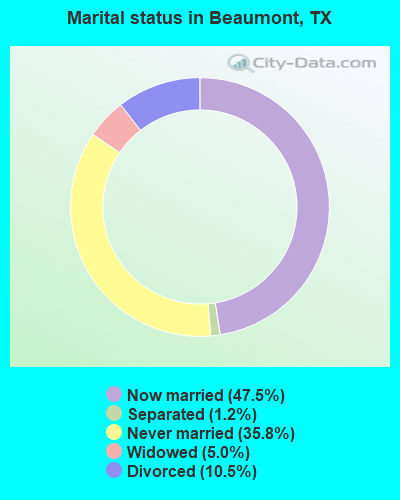
- Never married: 35.8%
- Now married: 47.5%
- Separated: 1.2%
- Widowed: 5.0%
- Divorced: 10.5%
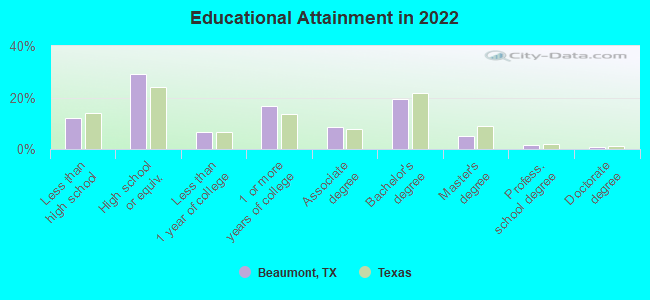
For population 25 years and over in Beaumont:
- High school or higher: 88.0%
- Bachelor's degree or higher: 27.1%
- Graduate or professional degree: 7.5%
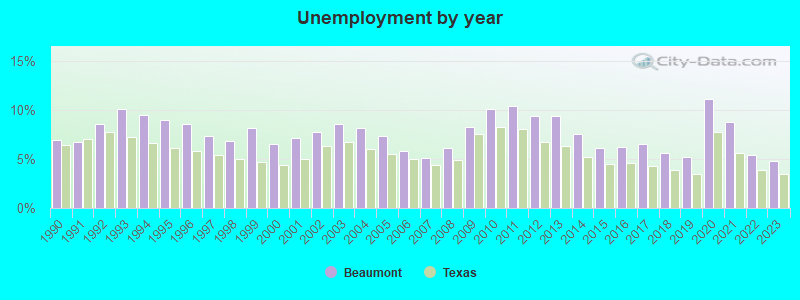
- Unemployed: 8.2%
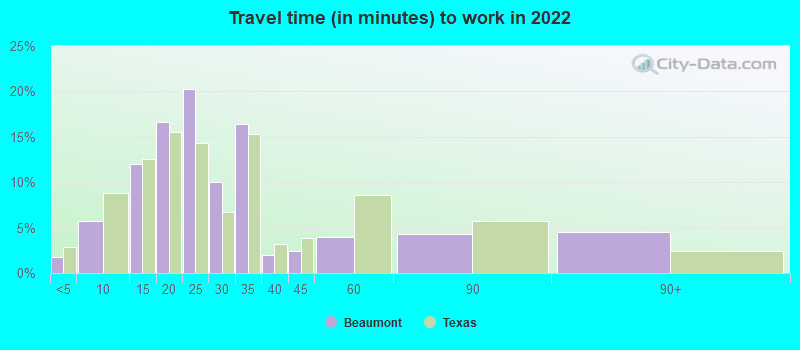
- Mean travel time to work (commute): 20.6 minutes
| Here: | 11.5 |
| Texas average: | 14.0 |
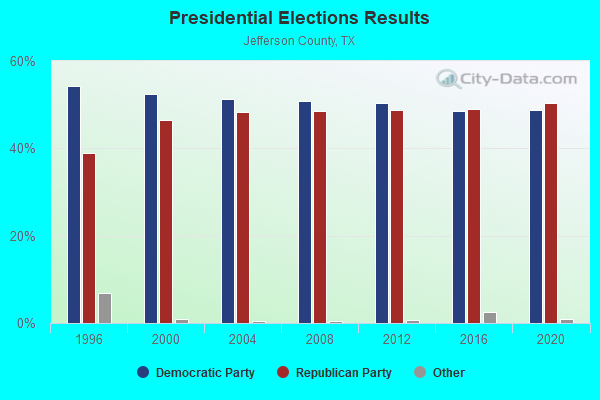
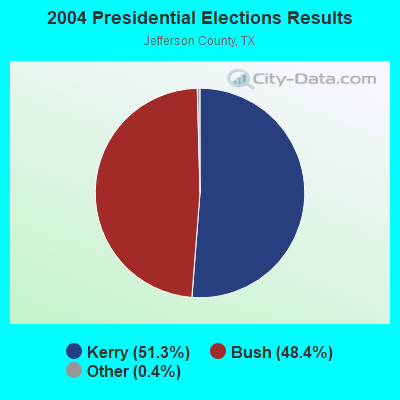
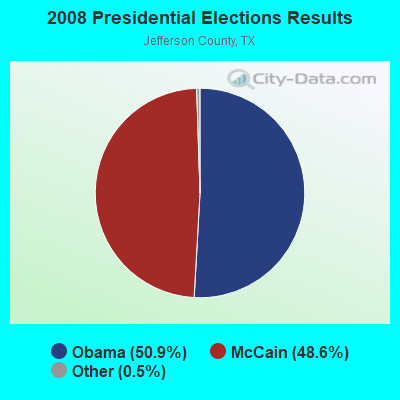
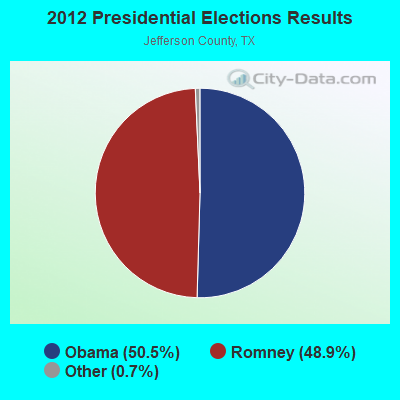
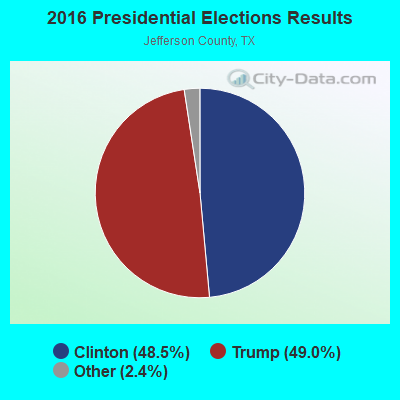
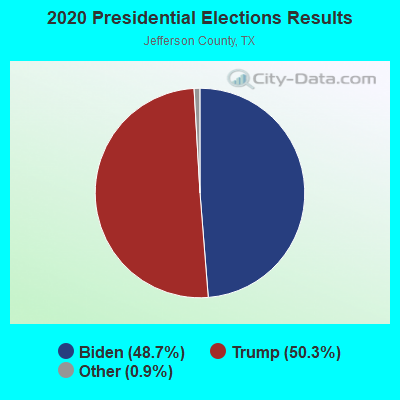
Graphs represent county-level data. Detailed 2008 Election Results
Religion statistics for Beaumont, TX (based on Jefferson County data)
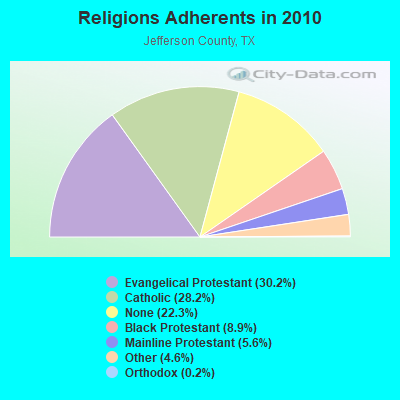
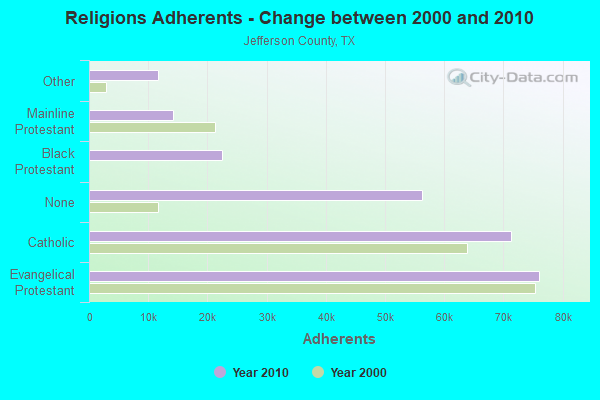
| Religion | Adherents | Congregations |
|---|---|---|
| Evangelical Protestant | 76,088 | 240 |
| Catholic | 71,211 | 25 |
| Black Protestant | 22,468 | 59 |
| Mainline Protestant | 14,187 | 39 |
| Other | 11,594 | 23 |
| Orthodox | 415 | 2 |
| None | 56,310 | - |
Food Environment Statistics:
| Jefferson County: | 1.94 / 10,000 pop. |
| Texas: | 1.47 / 10,000 pop. |
| Jefferson County: | 0.17 / 10,000 pop. |
| Texas: | 0.14 / 10,000 pop. |
| Jefferson County: | 1.57 / 10,000 pop. |
| State: | 1.11 / 10,000 pop. |
| Here: | 5.65 / 10,000 pop. |
| Texas: | 3.95 / 10,000 pop. |
| Here: | 5.49 / 10,000 pop. |
| Texas: | 6.13 / 10,000 pop. |
| Jefferson County: | 12.3% |
| Texas: | 8.9% |
| This county: | 30.3% |
| Texas: | 26.6% |
| Jefferson County: | 15.1% |
| Texas: | 15.7% |
Health and Nutrition:
| Here: | 47.9% |
| Texas: | 48.6% |
| Beaumont: | 44.5% |
| Texas: | 47.4% |
| Beaumont: | 29.1 |
| State: | 28.5 |
| This city: | 19.9% |
| Texas: | 20.6% |
| Beaumont: | 12.4% |
| Texas: | 10.3% |
| This city: | 6.7 |
| Texas: | 6.8 |
| Here: | 34.0% |
| State: | 33.1% |
| This city: | 53.7% |
| Texas: | 56.2% |
| Beaumont: | 80.2% |
| Texas: | 80.7% |
More about Health and Nutrition of Beaumont, TX Residents
| Local government employment and payroll (March 2022) | |||||
| Function | Full-time employees | Monthly full-time payroll | Average yearly full-time wage | Part-time employees | Monthly part-time payroll |
|---|---|---|---|---|---|
| Police Protection - Officers | 245 | $1,870,116 | $91,598 | 0 | $0 |
| Firefighters | 213 | $1,729,010 | $97,409 | 0 | $0 |
| Streets and Highways | 104 | $461,949 | $53,302 | 7 | $9,362 |
| Health | 103 | $619,061 | $72,124 | 6 | $8,803 |
| Other and Unallocable | 97 | $390,080 | $48,257 | 0 | $0 |
| Parks and Recreation | 80 | $281,961 | $42,294 | 39 | $40,882 |
| Police - Other | 70 | $407,280 | $69,819 | 4 | $6,290 |
| Financial Administration | 70 | $317,955 | $54,507 | 7 | $12,943 |
| Solid Waste Management | 63 | $262,225 | $49,948 | 0 | $0 |
| Water Supply | 61 | $315,890 | $62,142 | 3 | $3,799 |
| Sewerage | 53 | $209,959 | $47,538 | 2 | $2,657 |
| Local Libraries | 27 | $105,679 | $46,968 | 27 | $25,752 |
| Judicial and Legal | 23 | $119,272 | $62,229 | 1 | $1,166 |
| Other Government Administration | 19 | $127,582 | $80,578 | 7 | $2,964 |
| Fire - Other | 12 | $45,971 | $45,971 | 0 | $0 |
| Housing and Community Development (Local) | 10 | $49,631 | $59,557 | 0 | $0 |
| Airports | 2 | $9,650 | $57,900 | 2 | $5,518 |
| Totals for Government | 1,252 | $7,323,272 | $70,191 | 105 | $120,136 |
Beaumont government finances - Expenditure in 2021 (per resident):
- Construction - Regular Highways: $11,105,000 ($99.07)
Sewerage: $6,406,000 ($57.15)
Water Utilities: $2,396,000 ($21.38)
General Public Buildings: $226,000 ($2.02)
Parks and Recreation: $112,000 ($1.00)
Solid Waste Management: $33,000 ($0.29)
Air Transportation: $32,000 ($0.29)
Libraries: $26,000 ($0.23)
- Current Operations - Police Protection: $45,177,000 ($403.05)
Local Fire Protection: $30,800,000 ($274.78)
Public Welfare, Vendor Payments for Medical Care: $25,968,000 ($231.67)
Water Utilities: $15,658,000 ($139.69)
Regular Highways: $13,800,000 ($123.12)
Health - Other: $10,487,000 ($93.56)
Parks and Recreation: $9,985,000 ($89.08)
Solid Waste Management: $9,372,000 ($83.61)
Sewerage: $8,429,000 ($75.20)
General Public Buildings: $8,061,000 ($71.92)
Transit Utilities: $5,614,000 ($50.09)
Central Staff Services: $5,571,000 ($49.70)
Housing and Community Development: $5,429,000 ($48.43)
Financial Administration: $3,367,000 ($30.04)
Judicial and Legal Services: $3,051,000 ($27.22)
General - Other: $2,895,000 ($25.83)
Libraries: $2,376,000 ($21.20)
Air Transportation: $764,000 ($6.82)
- General - Interest on Debt: $9,098,000 ($81.17)
- Other Capital Outlay - Solid Waste Management: $3,618,000 ($32.28)
Police Protection: $2,007,000 ($17.91)
Water Utilities: $1,821,000 ($16.25)
Local Fire Protection: $1,161,000 ($10.36)
General Public Building: $803,000 ($7.16)
Regular Highways: $741,000 ($6.61)
Central Staff Services: $605,000 ($5.40)
Health - Other: $226,000 ($2.02)
Parks and Recreation: $202,000 ($1.80)
Sewerage: $34,000 ($0.30)
- Total Salaries and Wages: $253,292,000 ($2259.74)
- Water Utilities - Interest on Debt: $7,094,000 ($63.29)
Beaumont government finances - Revenue in 2021 (per resident):
- Charges - Sewerage: $18,643,000 ($166.32)
Solid Waste Management: $13,508,000 ($120.51)
Other: $3,927,000 ($35.03)
Parks and Recreation: $905,000 ($8.07)
Air Transportation: $211,000 ($1.88)
- Federal Intergovernmental - Other: $5,749,000 ($51.29)
Housing and Community Development: $1,514,000 ($13.51)
Transit Utilities: $489,000 ($4.36)
Air Transportation: $45,000 ($0.40)
Health and Hospitals: $20,000 ($0.18)
- Miscellaneous - General Revenue - Other: $20,686,000 ($184.55)
Interest Earnings: $1,896,000 ($16.92)
Fines and Forfeits: $1,089,000 ($9.72)
Sale of Property: $667,000 ($5.95)
Donations From Private Sources: $210,000 ($1.87)
Rents: $136,000 ($1.21)
- Revenue - Water Utilities: $31,181,000 ($278.18)
Transit Utilities: $237,000 ($2.11)
- State Intergovernmental - Transit Utilities: $3,488,000 ($31.12)
Highways: $2,462,000 ($21.96)
Health and Hospitals: $1,190,000 ($10.62)
Other: $1,188,000 ($10.60)
General Local Government Support: $383,000 ($3.42)
- Tax - Property: $53,457,000 ($476.92)
General Sales and Gross Receipts: $42,251,000 ($376.94)
Other Selective Sales: $24,869,000 ($221.87)
Public Utilities Sales: $11,843,000 ($105.66)
Other License: $2,521,000 ($22.49)
Alcoholic Beverage License: $58,000 ($0.52)
Beaumont government finances - Debt in 2021 (per resident):
- Long Term Debt - Beginning Outstanding - Unspecified Public Purpose: $347,877,000 ($3103.58)
Outstanding Unspecified Public Purpose: $330,081,000 ($2944.81)
Retired Unspecified Public Purpose: $17,796,000 ($158.77)
Beaumont government finances - Cash and Securities in 2021 (per resident):
- Bond Funds - Cash and Securities: $16,680,000 ($148.81)
- Other Funds - Cash and Securities: $83,951,000 ($748.97)
- Sinking Funds - Cash and Securities: $1,484,000 ($13.24)
| Businesses in Beaumont, TX | ||||
| Name | Count | Name | Count | |
|---|---|---|---|---|
| AT&T | 2 | La-Z-Boy | 1 | |
| Abercrombie & Fitch | 1 | Lane Bryant | 1 | |
| Abercrombie Kids | 1 | Lane Furniture | 5 | |
| Academy Sports + Outdoors | 1 | LensCrafters | 1 | |
| Ace Hardware | 3 | Little Caesars Pizza | 2 | |
| Advance Auto Parts | 3 | Lowe's | 1 | |
| Aeropostale | 1 | Macy's | 1 | |
| American Eagle Outfitters | 1 | Marriott | 2 | |
| Applebee's | 1 | Marshalls | 1 | |
| Arby's | 1 | MasterBrand Cabinets | 1 | |
| Ashley Furniture | 1 | Mazda | 1 | |
| AutoZone | 3 | McDonald's | 8 | |
| BMW | 1 | Men's Wearhouse | 1 | |
| Barnes & Noble | 1 | Motel 6 | 1 | |
| Baskin-Robbins | 2 | Motherhood Maternity | 2 | |
| Bath & Body Works | 1 | New Balance | 4 | |
| Baymont Inn | 1 | New York & Co | 1 | |
| Bed Bath & Beyond | 1 | Nike | 4 | |
| Best Western | 1 | Nissan | 1 | |
| Blockbuster | 1 | Office Depot | 2 | |
| Budget Car Rental | 2 | Old Navy | 1 | |
| Burger King | 2 | Olive Garden | 1 | |
| CVS | 4 | Outback | 1 | |
| Carl\s Jr. | 1 | Outback Steakhouse | 1 | |
| Catherines | 1 | Pac Sun | 1 | |
| Chevrolet | 1 | Papa John's Pizza | 1 | |
| Chick-Fil-A | 2 | Payless | 3 | |
| Chico's | 1 | Penske | 1 | |
| Chuck E. Cheese's | 1 | PetSmart | 1 | |
| Church's Chicken | 6 | Pier 1 Imports | 1 | |
| Cracker Barrel | 1 | Pizza Hut | 2 | |
| Cricket Wireless | 8 | Plato's Closet | 1 | |
| Curves | 1 | Popeyes | 4 | |
| Days Inn | 1 | Quality | 1 | |
| Discount Tire | 3 | Quiznos | 1 | |
| Domino's Pizza | 3 | RadioShack | 2 | |
| DressBarn | 1 | Ramada | 1 | |
| Dressbarn | 1 | Red Lobster | 1 | |
| Dunkin Donuts | 2 | Red Roof Inn | 1 | |
| Econo Lodge | 1 | Rodeway Inn | 1 | |
| Ethan Allen | 1 | Rue21 | 1 | |
| Express | 1 | Ryan's Grill | 1 | |
| FedEx | 18 | Ryder Rental & Truck Leasing | 1 | |
| Finish Line | 1 | SAS Shoes | 1 | |
| Firestone Complete Auto Care | 1 | SONIC Drive-In | 8 | |
| Foot Locker | 1 | Sam's Club | 1 | |
| Forever 21 | 1 | Sears | 3 | |
| Fredericks Of Hollywood | 1 | Shoe Carnival | 1 | |
| GNC | 1 | Sleep Inn | 1 | |
| GameStop | 3 | Spencer Gifts | 1 | |
| Gap | 1 | Sprint Nextel | 1 | |
| Goodwill | 2 | Starbucks | 3 | |
| Gymboree | 1 | Studio 6 | 1 | |
| H&R Block | 4 | Subway | 14 | |
| Hobby Lobby | 1 | Super 8 | 2 | |
| Holiday Inn | 3 | T-Mobile | 6 | |
| Hollister Co. | 1 | Taco Bell | 3 | |
| Home Depot | 1 | Talbots | 1 | |
| Honda | 1 | Target | 1 | |
| Hot Topic | 1 | The Room Place | 1 | |
| Howard Johnson | 2 | Toys"R"Us | 2 | |
| IHOP | 2 | U-Haul | 4 | |
| JCPenney | 1 | UPS | 17 | |
| Jack In The Box | 6 | Vans | 3 | |
| JoS. A. Bank | 1 | Verizon Wireless | 3 | |
| Jones New York | 4 | Victoria's Secret | 1 | |
| Journeys | 1 | Volkswagen | 1 | |
| Justice | 1 | Waffle House | 4 | |
| KFC | 2 | Walgreens | 4 | |
| Kincaid | 1 | Walmart | 1 | |
| Knights Inn | 1 | Wendy's | 2 | |
| Kohl's | 1 | Wet Seal | 1 | |
| Kroger | 2 | World Gym | 2 | |
| La Quinta | 2 | |||
Strongest AM radio stations in Beaumont:
- KIKR (1450 AM; 1 kW; BEAUMONT, TX; Owner: CUMULUS LICENSING CORP.)
- KRCM (1380 AM; 1 kW; BEAUMONT, TX; Owner: VOICE BROADCASTING, INC.)
- KZZB (990 AM; 1 kW; BEAUMONT, TX; Owner: MARTIN BROADCASTING, INC.)
- KQHN (1510 AM; daytime; 5 kW; NEDERLAND, TX; Owner: CUMULUS LICENSING CORP.)
- KLVI (560 AM; 5 kW; BEAUMONT, TX; Owner: CAPSTAR TX LIMITED PARTNERSHIP)
- KTRH (740 AM; 50 kW; HOUSTON, TX; Owner: AMFM TEXAS LICENSES LIMITED PARTNERSHIP)
- KDEI (1250 AM; 5 kW; PORT ARTHUR, TX; Owner: RADIO MARIA, INC.)
- KGOL (1180 AM; 50 kW; HUMBLE, TX; Owner: ENTRAVISION HOLDINGS, LLC)
- KUHD (1150 AM; 0 kW; PORT NECHES, TX; Owner: VISION LATINABROADCASTING, INC.)
- KILE (1560 AM; 50 kW; BELLAIRE, TX; Owner: THE RAFTT CORPORATION)
- KOLE (1340 AM; 1 kW; PORT ARTHUR, TX; Owner: CITYGATE MEDIA, INC.)
- KSEV (700 AM; 15 kW; TOMBALL, TX; Owner: LIBERMAN BROADCASTING OF HOUSTON LICENSE CORP.)
- KEEL (710 AM; 50 kW; SHREVEPORT, LA; Owner: CITICASTERS LICENSES, L.P.)
Strongest FM radio stations in Beaumont:
- K277AG (103.3 FM; BEAUMONT, TX; Owner: CAPSTAR TX LIMITED PARTNERSHIP)
- KRWP (97.5 FM; BEAUMONT, TX; Owner: CUMULUS LICENSING CORP.)
- KIOC (106.1 FM; ORANGE, TX; Owner: CAPSTAR TX LIMITED PARTNERSHIP)
- KYKR (95.1 FM; BEAUMONT, TX; Owner: CAPSTAR TX LIMITED PARTNERSHIP)
- KVLU (91.3 FM; BEAUMONT, TX; Owner: LAMAR UNIVERSITY)
- KQXY-FM (94.1 FM; BEAUMONT, TX; Owner: CUMULUS LICENSING CORP.)
- KOBT (100.7 FM; WINNIE, TX; Owner: TICHENOR LICENSE CORPORATION ("TLC"))
- KQBU-FM (93.3 FM; PORT ARTHUR, TX; Owner: TICHENOR LICENSE CORPORATION ("TLC"))
- KQQK (107.9 FM; BEAUMONT, TX; Owner: LIBERMAN BROADCASTING OF HOUSTON LICENSE CORP.)
- KTJM (98.5 FM; PORT ARTHUR, TX; Owner: LIBERMAN BROADCASTING OF HOUSTON LICENSE CORP.)
- KTCX (102.5 FM; BEAUMONT, TX; Owner: CUMULUS LICENSING CORP.)
- KKMY (104.5 FM; ORANGE, TX; Owner: CAPSTAR TX LIMITED PARTNERSHIP)
- KCOL-FM (92.5 FM; GROVES, TX; Owner: VOICE IN THE WILDERNESS BROADCASTING, INC.)
- KTXB (89.7 FM; BEAUMONT, TX; Owner: FAMILY STATIONS, INC.)
- KSHN (99.9 FM; LIBERTY, TX; Owner: TRINITY RIVER VALLEY BROADCASTING CO)
- KAYD-FM (101.7 FM; SILSBEE, TX; Owner: HILCO COMMUNICATIONS, INC.)
- KVST (103.7 FM; WILLIS, TX; Owner: NEW WAVO COMMUNICATION GROUP, INC.)
- KYKZ (96.1 FM; LAKE CHARLES, LA; Owner: CUMULUS LICENSING CORP.)
TV broadcast stations around Beaumont:
- KBMT (Channel 12; BEAUMONT, TX; Owner: CHANNEL 12 OF BEAUMONT, INC.)
- K09VO (Channel 9; BEAUMONT, TX; Owner: BEAUMONT BROADCASTING CORPORATION)
- KEBQ-LP (Channel 22; BEAUMONT-ORANGE, TX; Owner: WELLSPRINGS BEAUMONT TELEVISION, INC.)
- KBTV-TV (Channel 4; PORT ARTHUR, TX; Owner: NEXSTAR BROADCASTING OF BEAUMONT/PORT ARTHUR, L.L.C.)
- KFDM-TV (Channel 6; BEAUMONT, TX; Owner: FREEDOM BROADCASTING OF TEXAS, INC.)
- KJDF-LP (Channel 46; BEAUMONT, TX; Owner: ARACELIS ORTIZ, EXECUTRIX OF THE ESTATE OF CARLOS ORTIZ)
- KUIL-LP (Channel 64; BEAUMONT, TX; Owner: BLUE BONNET COMMUNICATIONS, INC.)
- KITU (Channel 34; BEAUMONT, TX; Owner: COMMUNITY EDUCATIONAL TELEVISION INC)
- KVHP (Channel 29; LAKE CHARLES, LA; Owner: NATIONAL COMMUNICATIONS, INC.)
- National Bridge Inventory (NBI) Statistics
- 287Number of bridges
- 5,636ft / 1,718mTotal length
- $3,363,000Total costs
- 6,502,917Total average daily traffic
- 760,533Total average daily truck traffic
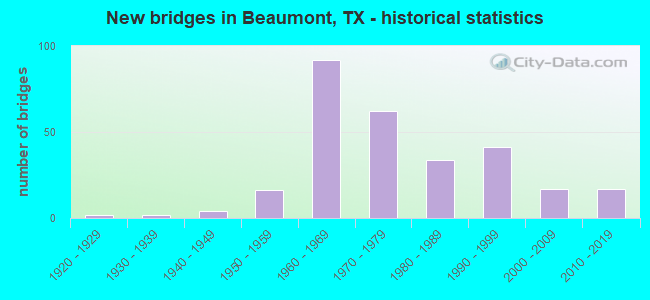
- New bridges - historical statistics
- 21920-1929
- 21930-1939
- 41940-1949
- 161950-1959
- 921960-1969
- 621970-1979
- 341980-1989
- 411990-1999
- 172000-2009
- 172010-2019
FCC Registered Commercial Land Mobile Towers: 12 (See the full list of FCC Registered Commercial Land Mobile Towers in Beaumont, TX)
FCC Registered Private Land Mobile Towers: 11 (See the full list of FCC Registered Private Land Mobile Towers)
FCC Registered Broadcast Land Mobile Towers: 170 (See the full list of FCC Registered Broadcast Land Mobile Towers)
FCC Registered Microwave Towers: 221 (See the full list of FCC Registered Microwave Towers in this town)
FCC Registered Paging Towers: 16 (See the full list of FCC Registered Paging Towers)
FCC Registered Maritime Coast & Aviation Ground Towers: 26 (See the full list of FCC Registered Maritime Coast & Aviation Ground Towers)
FCC Registered Amateur Radio Licenses: 447 (See the full list of FCC Registered Amateur Radio Licenses in Beaumont)
FAA Registered Aircraft Manufacturers and Dealers: 6 (See the full list of FAA Registered Manufacturers and Dealers in Beaumont)
FAA Registered Aircraft: 138 (See the full list of FAA Registered Aircraft)
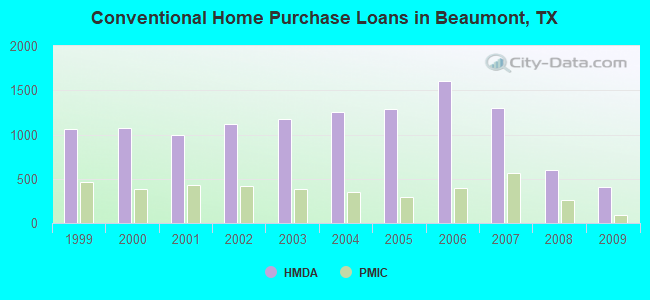
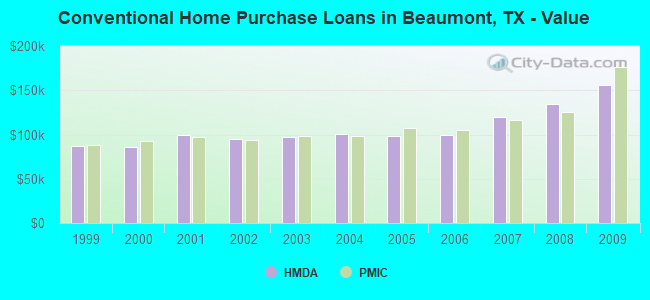
| Home Mortgage Disclosure Act Aggregated Statistics For Year 2009 (Based on 27 full and 4 partial tracts) | ||||||||||||||
| A) FHA, FSA/RHS & VA Home Purchase Loans | B) Conventional Home Purchase Loans | C) Refinancings | D) Home Improvement Loans | E) Loans on Dwellings For 5+ Families | F) Non-occupant Loans on < 5 Family Dwellings (A B C & D) | G) Loans On Manufactured Home Dwelling (A B C & D) | ||||||||
|---|---|---|---|---|---|---|---|---|---|---|---|---|---|---|
| Number | Average Value | Number | Average Value | Number | Average Value | Number | Average Value | Number | Average Value | Number | Average Value | Number | Average Value | |
| LOANS ORIGINATED | 378 | $124,680 | 411 | $156,170 | 638 | $135,506 | 98 | $45,762 | 6 | $982,680 | 74 | $75,677 | 2 | $34,985 |
| APPLICATIONS APPROVED, NOT ACCEPTED | 17 | $128,622 | 35 | $146,091 | 77 | $109,519 | 30 | $45,553 | 0 | $0 | 6 | $81,943 | 3 | $35,150 |
| APPLICATIONS DENIED | 74 | $111,379 | 88 | $111,652 | 337 | $112,459 | 233 | $27,926 | 0 | $0 | 61 | $77,049 | 9 | $47,376 |
| APPLICATIONS WITHDRAWN | 38 | $131,849 | 43 | $144,205 | 167 | $120,721 | 27 | $53,893 | 0 | $0 | 15 | $94,217 | 0 | $0 |
| FILES CLOSED FOR INCOMPLETENESS | 12 | $131,166 | 8 | $192,648 | 45 | $135,486 | 16 | $61,091 | 0 | $0 | 8 | $90,000 | 1 | $42,530 |
Detailed mortgage data for all 31 tracts in Beaumont, TX
| Private Mortgage Insurance Companies Aggregated Statistics For Year 2009 (Based on 16 full and 4 partial tracts) | ||||
| A) Conventional Home Purchase Loans | B) Refinancings | |||
|---|---|---|---|---|
| Number | Average Value | Number | Average Value | |
| LOANS ORIGINATED | 92 | $175,769 | 24 | $167,752 |
| APPLICATIONS APPROVED, NOT ACCEPTED | 25 | $156,737 | 6 | $171,295 |
| APPLICATIONS DENIED | 10 | $175,314 | 5 | $194,252 |
| APPLICATIONS WITHDRAWN | 7 | $151,557 | 1 | $88,510 |
| FILES CLOSED FOR INCOMPLETENESS | 1 | $108,000 | 1 | $209,530 |
2002 - 2018 National Fire Incident Reporting System (NFIRS) incidents
- Fire incident types reported to NFIRS in Beaumont, TX
- 3,98642.1%Structure Fires
- 3,13133.0%Outside Fires
- 2,15322.7%Mobile Property/Vehicle Fires
- 2062.2%Other
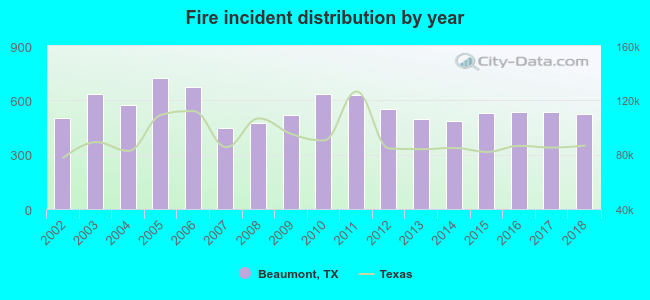 According to the data from the years 2002 - 2018 the average number of fire incidents per year is 557. The highest number of reported fire incidents - 723 took place in 2005, and the least - 447 in 2007. The data has a growing trend.
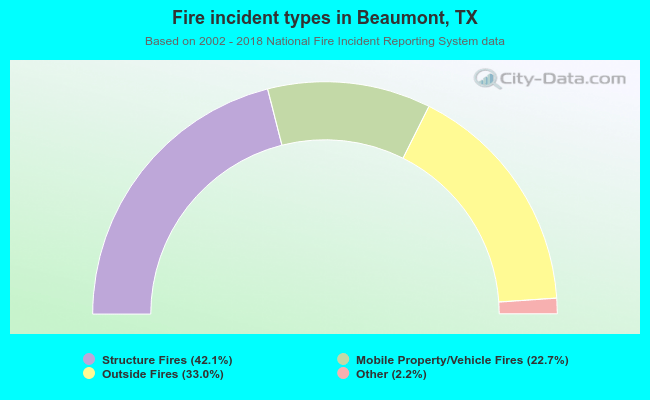 When looking into fire subcategories, the most incidents belonged to: Structure Fires (42.1%), and Outside Fires (33.0%).
Fire-safe hotels and motels in Beaumont, Texas:
- MCM Elegante' Hotel & Conference Center, 2355 Ih-10 S, Beaumont, Texas 77705 , Phone: (409) 842-3600, Fax: (409) 842-1355
- Days Inn, 2155 N 11TH St, Beaumont, Texas 77703 , Phone: (409) 898-8150, Fax: (409) 898-0078
- La Quinta Inn Beaumont, 220 I-10 N, Beaumont, Texas 77702 , Phone: (409) 838-9991
- Howard Johnson Beaumont, 1610 Ih-10 S, Beaumont, Texas 77707 , Phone: (409) 842-0037, Fax: (409) 842-0057
- Motel 6 #4060, 1155 I-10 S, Beaumont, Texas 77701 , Phone: (409) 835-5913, Fax: (409) 835-0216
- Rodeway Inn, 1295 N 11TH St, Beaumont, Texas 77702 , Phone: (409) 892-7722, Fax: (409) 892-6537
- Courtyard Beaumont, 2275 I-H 10 S, Beaumont, Texas 77705 , Phone: (409) 840-5750, Fax: (409) 840-6364
- Fairfield Inn & Suites Beaumont, 2265 I-h10 S, Beaumont, Texas 77705 , Phone: (409) 840-5751, Fax: (509) 840-5751
- 23 other hotels and motels
| Most common first names in Beaumont, TX among deceased individuals | ||
| Name | Count | Lived (average) |
|---|---|---|
| Mary | 998 | 77.3 years |
| John | 856 | 73.4 years |
| James | 723 | 71.0 years |
| William | 666 | 73.3 years |
| Robert | 535 | 70.7 years |
| Joseph | 492 | 71.6 years |
| Charles | 405 | 70.6 years |
| Willie | 398 | 73.0 years |
| George | 393 | 74.2 years |
| Dorothy | 264 | 73.5 years |
| Most common last names in Beaumont, TX among deceased individuals | ||
| Last name | Count | Lived (average) |
|---|---|---|
| Smith | 469 | 73.4 years |
| Jones | 437 | 71.5 years |
| Williams | 435 | 73.4 years |
| Johnson | 423 | 72.1 years |
| Davis | 299 | 73.7 years |
| Brown | 275 | 73.9 years |
| Thomas | 234 | 73.6 years |
| Lewis | 207 | 73.4 years |
| Broussard | 184 | 71.9 years |
| Jackson | 177 | 71.9 years |
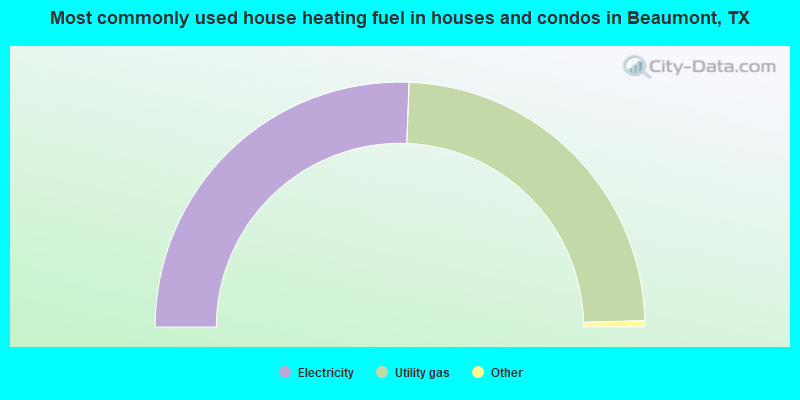
- 51.2%Electricity
- 48.0%Utility gas
- 0.4%Bottled, tank, or LP gas
- 0.2%No fuel used
- 0.1%Wood
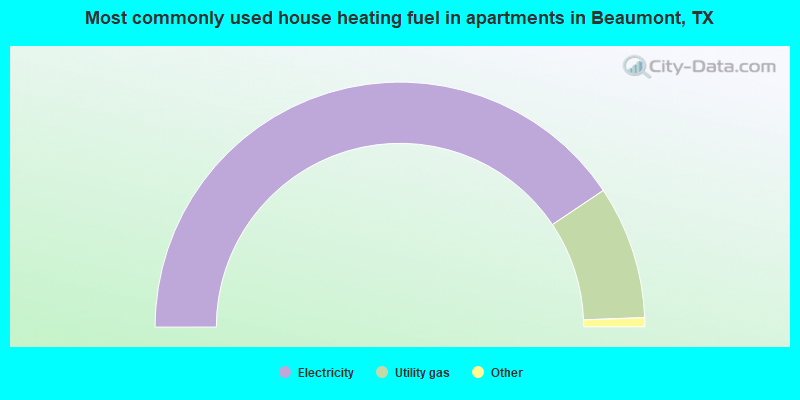
- 81.2%Electricity
- 17.6%Utility gas
- 0.8%No fuel used
- 0.3%Bottled, tank, or LP gas
Beaumont compared to Texas state average:
- Median house value below state average.
- Unemployed percentage below state average.
- Black race population percentage significantly above state average.
- Hispanic race population percentage below state average.
Beaumont on our top lists:
- #4 on the list of "Top 101 cities with the highest average humidity (population 50,000+)"
- #9 on the list of "Top 101 cities with the highest maximum monthly morning or afternoon humidity (population 50,000+)"
- #26 on the list of "Top 101 cities with the largest wind speed differences during a year (population 50,000+)"
- #26 on the list of "Top 101 cities with the largest house values disparities (population 50,000+)"
- #27 on the list of "Top 101 cities with largest percentage of females in occupations: installation, maintenance, and repair occupations (population 50,000+)"
- #46 on the list of "Top 101 cities with largest percentage of females in industries: real estate and rental and leasing (population 50,000+)"
- #48 on the list of "Top 101 cities with largest percentage of males in occupations: health technologists and technicians (population 50,000+)"
- #49 on the list of "Top 101 cities with the largest percentage of people in halfway houses (population 1,000+)"
- #54 on the list of "Top 101 cities with largest percentage of females in occupations: sales and related occupations (population 50,000+)"
- #55 on the list of "Top 101 cities with the highest average yearly precipitation (population 50,000+)"
- #57 on the list of "Top 101 cities with largest percentage of females in industries: mining, quarrying, and oil and gas extraction (population 50,000+)"
- #57 on the list of "Top 100 least-safe cities (highest city-data.com crime index) (pop. 50,000+)"
- #59 on the list of "Top 101 cities with largest percentage of females in occupations: building and grounds cleaning and maintenance occupations (population 50,000+)"
- #60 on the list of "Top 101 cities with the highest number of burglaries per 100,000 residents, excludes tourist destinations and others with a lot of outsiders visiting based on city industries data (population 50,000+)"
- #61 on the list of "Top 101 cities with the highest number of rapes per 100,000 residents, excludes tourist destinations and others with a lot of outsiders visiting based on city industries data (population 50,000+)"
- #62 on the list of "Top 101 cities with the highest number of assaults per 100,000 residents, excludes tourist destinations and others with a lot of outsiders visiting based on city industries data (population 50,000+)"
- #64 on the list of "Top 101 cities with the highest city-data.com crime index, excludes tourist destinations and others with a lot of outsiders visiting based on city industries data (population 50,000+)"
- #64 on the list of "Top 101 cities with the highest number of robberies per 100,000 residents, excludes tourist destinations and others with a lot of outsiders visiting based on city industries data (population 50,000+)"
- #69 on the list of "Top 101 cities with the largest household incomes disparities (population 50,000+)"
- #76 on the list of "Top 101 cities with largest percentage of males in occupations: healthcare support occupations (population 50,000+)"
- #27 on the list of "Top 101 counties with the largest increase in the number of births per 1000 residents 2000-2006 to 2007-2013 (pop 50,000+)"
- #41 on the list of "Top 101 counties with the most Black Protestant adherents"
- #43 on the list of "Top 101 counties with the most Black Protestant congregations"
- #49 on the list of "Top 101 counties with the highest number of infant deaths per 1000 residents 2007-2013 (pop. 50,000+)"
- #76 on the list of "Top 101 counties with the lowest Nitrogen Dioxide air pollution readings in 2012 (ppm)"

|
|
Total of 288 patent applications in 2008-2024.