Estimated zip code population in 2022: 14,846 Zip code population in 2010: 12,788 Zip code population in 2000: 9,439
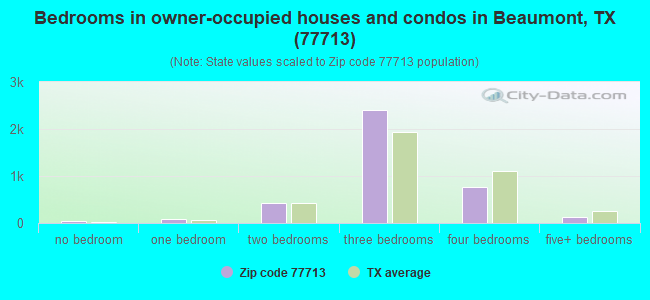
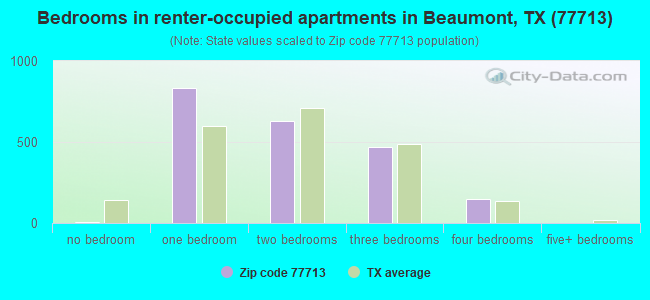
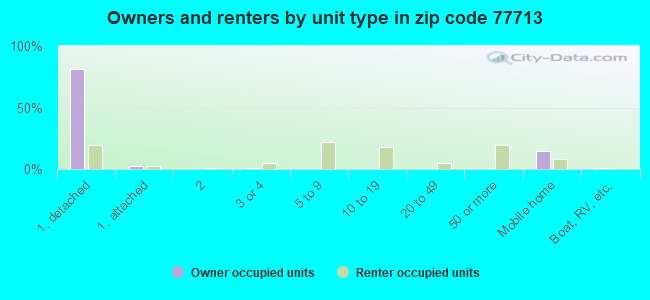
Houses and condos: 6,824 Renter-occupied apartments: 2,118
% of renters here:
36%
State:
38%
March 2022 cost of living index in zip code 77713: 80.6 (low, U.S. average is 100)
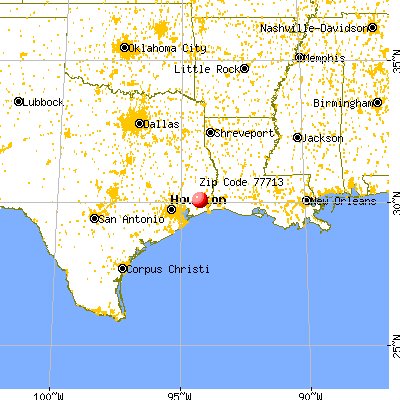
Land area: 99.7 sq. mi. Water area: 1.4 sq. mi.
Population density: 149 people per square mile
(very low).
OSM Map
General Map
Google Map
MSN Map
OSM Map
General Map
Google Map
MSN Map
OSM Map
General Map
Google Map
MSN Map
OSM Map
General Map
Google Map
MSN Map
Please wait while loading the map...
Real estate property taxes paid for housing units in 2022:
This zip code:
1.4% ($3,396)
Texas:
1.5% ($4,050)
Median real estate property taxes paid for housing units with mortgages in 2022: $3,928 (1.5%) Median real estate property taxes paid for housing units with no mortgage in 2022: $2,756 (1.4%)
Business Search- 14 Million verified businesses
Males: 7,403
(49.9%)
Females: 7,443
(50.1%)
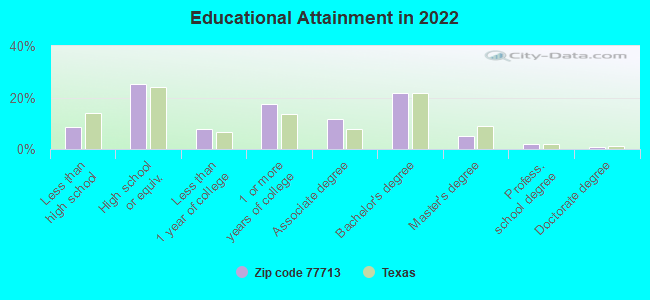
For population 25 years and over in 77713:
High school or higher: 91.3%
Bachelor's degree or higher: 29.3%
Graduate or professional degree: 7.7%
Unemployed: 2.7%
Mean travel time to work (commute): 23.6 minutes
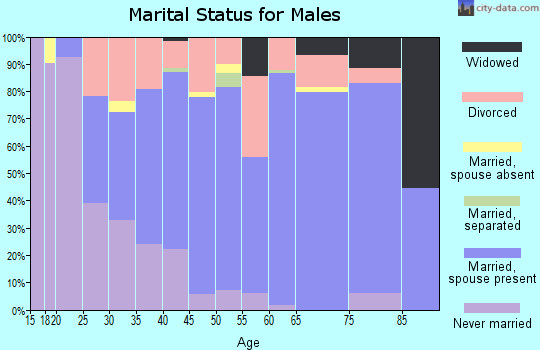
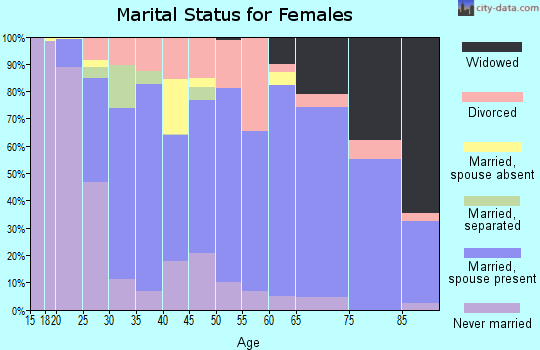
For population 15 years and over in 77713:
Never married: 28.6%
Now married: 55.0%
Separated: 0.8%
Widowed: 3.7%
Divorced: 11.8%
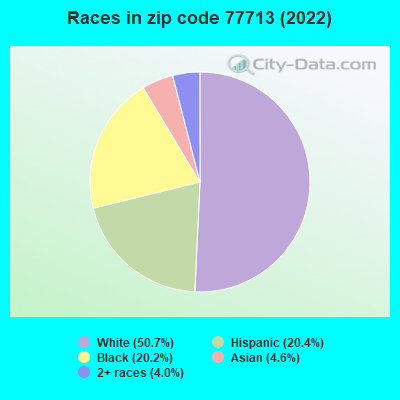
Zip code 77713 compared to state average:
Black race population percentage above state average.
Hispanic race population percentage below state average.
Foreign-born population percentage below state average.
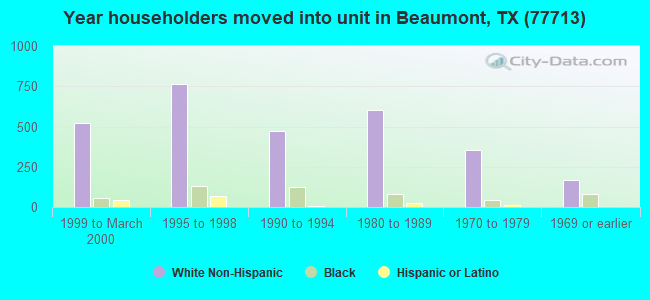
Length of stay since moving in significantly above state average.
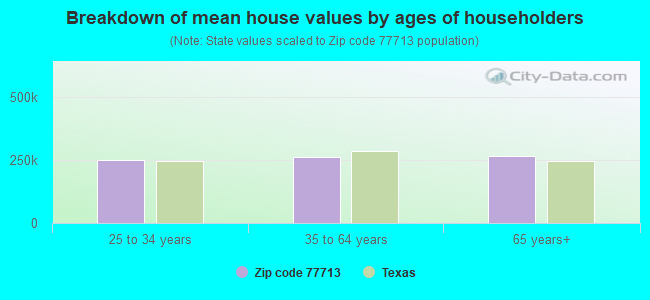
Estimated median house/condo value in 2022: $237,446
77713:
$237,446
Texas:
$275,400
According to our research of Texas and other state lists, there were 33 registered sex offenders living in 77713 zip code as of April 27, 2024. The ratio of all residents to sex offenders in zip code 77713 is 426 to 1. The ratio of registered sex offenders to all residents in this zip code is near the state average.
Median resident age:
This zip code:
36.2 years
Texas median age:
35.6 years
Average household size:
This zip code:
2.5 people
Texas:
2.6 people
Averages for the 2020 tax year for zip code 77713, filed in 2021:
Average Adjusted Gross Income (AGI) in 2020: $81,089 (Individual Income Tax Returns)
Here:
$81,089
State:
$77,054
Salary/wage: $65,881 (reported on 85.3% of returns)
Here:
$65,881
State:
$62,766
(% of AGI for various income ranges: 1232.9% for AGIs below $25k, 3492.8% for AGIs $25k-50k, 6594.7% for AGIs $50k-75k, 9504.8% for AGIs $75k-100k, 16814.7% for AGIs $100k-200k, 57082.0% for AGIs over 200k)
Taxable interest for individuals: $2,494 (reported on 29.4% of returns)
This zip code:
$2,494
Texas:
$2,665
(% of AGI for various income ranges: 10.8% for AGIs below $25k, 13.9% for AGIs $25k-50k, 44.7% for AGIs $50k-75k, 28.0% for AGIs $75k-100k, 71.3% for AGIs $100k-200k, 2280.0% for AGIs over 200k)
Ordinary dividends: $6,993 (reported on 14.7% of returns)
Here:
$6,993
State:
$10,044
(% of AGI for various income ranges: 13.0% for AGIs below $25k, 19.7% for AGIs $25k-50k, 79.3% for AGIs $50k-75k, 97.0% for AGIs $75k-100k, 197.6% for AGIs $100k-200k, 2479.3% for AGIs over 200k)
Net capital gain/loss in AGI: +$30,327 (reported on 13.6% of returns)
Here:
+$30,327
State:
+$39,590
(% of AGI for various income ranges: 12.7% for AGIs below $25k, 25.9% for AGIs $25k-50k, 89.3% for AGIs $50k-75k, 128.4% for AGIs $75k-100k, 282.9% for AGIs $100k-200k, 15228.7% for AGIs over 200k)
Profit/loss from business: +$5,399 (reported on 19.5% of returns)
Here:
+$5,399
State:
+$10,888
(% of AGI for various income ranges: 28.4% for AGIs below $25k, 271.2% for AGIs $100k-200k, 3373.3% for AGIs over 200k)
Taxable individual retirement arrangement distribution: $24,874 (reported on 7.7% of returns)
77713:
$24,874
Texas:
$24,740
(% of AGI for various income ranges: 37.7% for AGIs below $25k, 81.5% for AGIs $25k-50k, 210.6% for AGIs $50k-75k, 386.6% for AGIs $75k-100k, 659.3% for AGIs $100k-200k, 1792.7% for AGIs over 200k)
Total itemized deductions: $38,304 (reported on 10.8% of returns)
Here:
$38,304
State:
$40,428
(% of AGI for various income ranges: 28.8% for AGIs below $25k, 153.3% for AGIs $25k-50k, 527.2% for AGIs $50k-75k, 616.8% for AGIs $75k-100k, 1259.6% for AGIs $100k-200k, 5689.3% for AGIs over 200k)
Charity contributions: $16,042 (reported on 8.0% of returns)
Here:
$16,042
State:
$18,201
(% of AGI for various income ranges: 36.8% for AGIs $25k-50k, 97.6% for AGIs $50k-75k, 103.2% for AGIs $75k-100k, 348.3% for AGIs $100k-200k, 2749.3% for AGIs over 200k)
Taxes paid: $7,402 (reported on 9.0% of returns)
77713:
$7,402
State:
$7,821
(% of AGI for various income ranges: 4.8% for AGIs below $25k, 24.8% for AGIs $25k-50k, 73.6% for AGIs $50k-75k, 83.4% for AGIs $75k-100k, 227.9% for AGIs $100k-200k, 872.0% for AGIs over 200k)
Earned income credit: $2,558 (reported on 16.6% of returns)
Here:
$2,558
State:
$2,584
(% of AGI for various income ranges: 114.9% for AGIs below $25k, 76.5% for AGIs $25k-50k)
Percentage of individuals using paid preparers for their 2020 taxes: 92.0%
Here:
92%
State:
92%
(% for various income ranges: 89.6% for AGIs below $25k, 93.1% for AGIs $25k-50k, 92.5% for AGIs $50k-75k, 93.2% for AGIs $75k-100k, 92.9% for AGIs $100k-200k, 94.4% for AGIs over 200k)
Averages for the 2012 tax year for zip code 77713, filed in 2013:
Average Adjusted Gross Income (AGI) in 2012: $67,359 (Individual Income Tax Returns)
Here:
$67,359
State:
$65,384
Salary/wage: $57,833 (reported on 87.7% of returns)
Here:
$57,833
State:
$52,524
(% of AGI for various income ranges: 80.7% for AGIs below $25k, 82.0% for AGIs $25k-50k, 82.1% for AGIs $50k-75k, 84.5% for AGIs $75k-100k, 83.4% for AGIs $100k-200k, 53.3% for AGIs over 200k)
Taxable interest for individuals: $1,323 (reported on 30.8% of returns)
This zip code:
$1,323
Texas:
$2,372
(% of AGI for various income ranges: 0.7% for AGIs below $25k, 0.6% for AGIs $25k-50k, 0.5% for AGIs $50k-75k, 0.4% for AGIs $75k-100k, 0.3% for AGIs $100k-200k, 1.1% for AGIs over 200k)
Ordinary dividends: $5,303 (reported on 15.7% of returns)
Here:
$5,303
State:
$9,721
(% of AGI for various income ranges: 1.3% for AGIs below $25k, 0.8% for AGIs $25k-50k, 0.9% for AGIs $50k-75k, 0.9% for AGIs $75k-100k, 1.0% for AGIs $100k-200k, 2.0% for AGIs over 200k)
Net capital gain/loss in AGI: +$8,411 (reported on 12.2% of returns)
Here:
+$8,411
State:
+$35,319
(% of AGI for various income ranges: 0.3% for AGIs $25k-50k, 0.7% for AGIs $75k-100k, 1.2% for AGIs $100k-200k, 4.0% for AGIs over 200k)
Profit/loss from business: +$10,097 (reported on 15.7% of returns)
Here:
+$10,097
State:
+$13,732
(% of AGI for various income ranges: 5.3% for AGIs below $25k, 1.7% for AGIs $25k-50k, 1.9% for AGIs $50k-75k, 1.2% for AGIs $75k-100k, 3.0% for AGIs $100k-200k, 1.9% for AGIs over 200k)
Taxable individual retirement arrangement distribution: $20,798 (reported on 9.0% of returns)
77713:
$20,798
Texas:
$19,511
(% of AGI for various income ranges: 2.9% for AGIs below $25k, 3.2% for AGIs $25k-50k, 2.6% for AGIs $50k-75k, 3.4% for AGIs $75k-100k, 2.4% for AGIs $100k-200k, 2.8% for AGIs over 200k)
Total itemized deductions: $23,189 (17% of AGI, reported on 27.8% of returns)
Here:
$23,189
State:
$24,724
Here:
17.4% of AGI
State:
15.9% of AGI
(% of AGI for various income ranges: 5.8% for AGIs below $25k, 8.6% for AGIs $25k-50k, 10.8% for AGIs $50k-75k, 10.3% for AGIs $75k-100k, 10.7% for AGIs $100k-200k, 8.8% for AGIs over 200k)
Charity contributions: $7,484 (reported on 22.6% of returns)
Here:
$7,484
State:
$6,808
(% of AGI for various income ranges: 0.7% for AGIs below $25k, 1.3% for AGIs $25k-50k, 1.8% for AGIs $50k-75k, 2.0% for AGIs $75k-100k, 2.6% for AGIs $100k-200k, 4.0% for AGIs over 200k)
Taxes paid: $5,561 (reported on 27.0% of returns)
77713:
$5,561
State:
$6,921
(% of AGI for various income ranges: 0.9% for AGIs below $25k, 1.5% for AGIs $25k-50k, 2.4% for AGIs $50k-75k, 2.4% for AGIs $75k-100k, 3.0% for AGIs $100k-200k, 1.9% for AGIs over 200k)
Earned income credit: $2,245 (reported on 17.6% of returns)
Here:
$2,245
State:
$2,570
(% of AGI for various income ranges: 7.1% for AGIs below $25k, 1.0% for AGIs $25k-50k)
Percentage of individuals using paid preparers for their 2012 taxes: 53.9%
Here:
54%
State:
51%
(% for various income ranges: 50.3% for AGIs below $25k, 50.4% for AGIs $25k-50k, 54.4% for AGIs $50k-75k, 56.1% for AGIs $75k-100k, 59.8% for AGIs $100k-200k, 77.3% for AGIs over 200k)
Averages for the 2004 tax year for zip code 77713, filed in 2005:
Average Adjusted Gross Income (AGI) in 2004: $44,317 (Individual Income Tax Returns)
Here:
$44,317
State:
$47,881
Salary/wage: $42,211 (reported on 85.8% of returns)
Here:
$42,211
State:
$41,947
(% of AGI for various income ranges: 99.7% for AGIs below $10k, 81.3% for AGIs $10k-25k, 81.3% for AGIs $25k-50k, 83.4% for AGIs $50k-75k, 87.9% for AGIs $75k-100k, 76.0% for AGIs over 100k)
Taxable interest for individuals: $1,259 (reported on 40.5% of returns)
This zip code:
$1,259
Texas:
$2,255
(% of AGI for various income ranges: 3.5% for AGIs below $10k, 1.8% for AGIs $10k-25k, 1.5% for AGIs $25k-50k, 0.9% for AGIs $50k-75k, 0.7% for AGIs $75k-100k, 1.1% for AGIs over 100k)
Taxable dividends: $2,599 (reported on 18.7% of returns)
Here:
$2,599
State:
$4,261
(% of AGI for various income ranges: 2.5% for AGIs below $10k, 1.3% for AGIs $10k-25k, 0.9% for AGIs $25k-50k, 0.8% for AGIs $50k-75k, 0.7% for AGIs $75k-100k, 1.5% for AGIs over 100k)
Net capital gain/loss: +$1,658 (reported on 15.0% of returns)
Here:
+$1,658
State:
+$16,110
(% of AGI for various income ranges: -1.3% for AGIs below $10k, -0.1% for AGIs $10k-25k, 0.2% for AGIs $25k-50k, 0.1% for AGIs $50k-75k, 0.7% for AGIs $75k-100k, 1.3% for AGIs over 100k)
Profit/loss from business: +$6,237 (reported on 15.7% of returns)
Here:
+$6,237
State:
+$11,013
(% of AGI for various income ranges: -2.0% for AGIs below $10k, 2.9% for AGIs $10k-25k, 2.8% for AGIs $25k-50k, 0.3% for AGIs $50k-75k, 1.6% for AGIs $75k-100k, 3.5% for AGIs over 100k)
IRA payment deduction: $3,024 (reported on 1.9% of returns)
77713:
$3,024
Texas:
$3,120
(% of AGI for various income ranges: 0.1% for AGIs $10k-25k, 0.2% for AGIs $25k-50k, 0.1% for AGIs $50k-75k, 0.1% for AGIs $75k-100k, 0.1% for AGIs over 100k)
Self-employed pension: $12,421 (reported on 0.4% of returns)
Here:
$12,421
Texas:
$16,401
Total itemized deductions: $16,892 (21% of AGI, reported on 26.5% of returns)
Here:
$16,892
State:
$19,631
Here:
21.4% of AGI
State:
18.9% of AGI
(% of AGI for various income ranges: 8.3% for AGIs below $10k, 7.7% for AGIs $10k-25k, 9.0% for AGIs $25k-50k, 10.6% for AGIs $50k-75k, 12.7% for AGIs $75k-100k, 9.7% for AGIs over 100k)
Charity contributions deductions: $4,417 (5% of AGI, reported on 23.2% of returns)
Here:
$4,417
State:
$4,753
Here:
5.4% of AGI
State:
4.2% of AGI
(% of AGI for various income ranges: 1.0% for AGIs below $10k, 1.4% for AGIs $10k-25k, 1.6% for AGIs $25k-50k, 2.3% for AGIs $50k-75k, 3.1% for AGIs $75k-100k, 2.6% for AGIs over 100k)
Total tax: $6,691 (reported on 73.4% of returns)
77713:
$6,691
State:
$9,058
(% of AGI for various income ranges: 2.2% for AGIs below $10k, 3.9% for AGIs $10k-25k, 6.5% for AGIs $25k-50k, 9.1% for AGIs $50k-75k, 10.7% for AGIs $75k-100k, 18.2% for AGIs over 100k)
Earned income credit: $1,871 (reported on 17.0% of returns)
Here:
$1,871
State:
$2,024
Percentage of individuals using paid preparers for their 2004 taxes: 53.8%
Here:
54%
State:
57%
(% for various income ranges: 48.8% for AGIs below $10k, 53.3% for AGIs $10k-25k, 55.4% for AGIs $25k-50k, 53.5% for AGIs $50k-75k, 55.3% for AGIs $75k-100k, 61.3% for AGIs over 100k)
Likely homosexual households (counted as self-reported same-sex unmarried-partner households)
Lesbian couples: 0.2% of all households
Gay men: 0.3% of all households
Household received Food Stamps/SNAP in the past 12 months: 598 Household did not receive Food Stamps/SNAP in the past 12 months: 5,328
Women who had a birth in the past 12 months: 187 (148 now married, 39 unmarried) Women who did not have a birth in the past 12 months: 3,196 (1,472 now married, 1,721 unmarried)
Housing units in zip code 77713 with a mortgage: 1,996 (43 second mortgage, 38 both second mortgage and home equity loan) Median monthly owner costs for units with a mortgage: $1,887 Median monthly owner costs for units without a mortgage: $690
Residents with income below the poverty level in 2022:
This zip code:
13.0%
Whole state:
14.0%
Residents with income below 50% of the poverty level in 2022:
This zip code:
8.8%
Whole state:
7.4%
Median number of rooms in houses and condos:
Here:
6.1
State:
6.3
Median number of rooms in apartments:
Here:
3.8
State:
4.0
Notable locations in this zip code not listed on our city pages
Churches in zip code 77713 include: Holy Family Center (A), Pentecostal Holiness Church (B), First Baptist Church of Bevil Oaks (C), Greater Rising Sun Baptist Church (D). Display/hide their locations on the map
In group quarters: 175 (-1 institutionalized population)
Size of family households: 1,822 2-persons, 599 3-persons, 716 4-persons, 368 5-persons, 178 6-persons, 127 7-or-more-persons
Size of nonfamily households: 1,703 1-person, 431 2-persons, 5 3-persons
2,742 married couples with children.
873 single-parent households (154 men, 719 women).
80.6% of residents of 77713 zip code speak English at home.
14.6% of residents speak Spanish at home (60% very well, 22% well, 17% not well, 2% not at all).
1.6% of residents speak other Indo-European language at home (43% very well, 28% well, 29% not well).
2.4% of residents speak Asian or Pacific Island language at home (65% very well, 20% well, 13% not well, 2% not at all).
0.4% of residents speak other language at home (48% very well, 22% well, 30% not well).
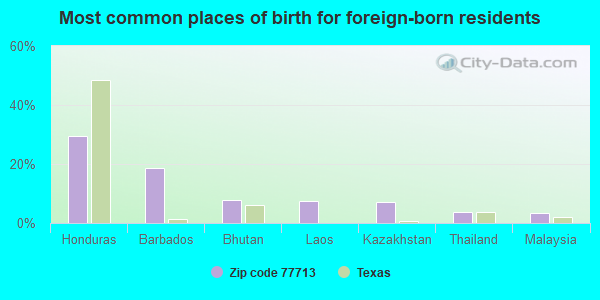
Foreign born population: 1,627 (11.0%) (39.9% of them are naturalized citizens)
This zip code:
11.0%
Whole state:
17.2%
29%Honduras
19%Barbados
8%Bhutan
7%Laos
7%Kazakhstan
4%Thailand
3%Malaysia
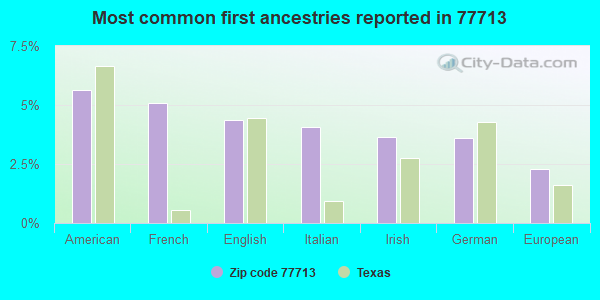
6%American
5%French
4%English
4%Italian
4%Irish
4%German
2%European
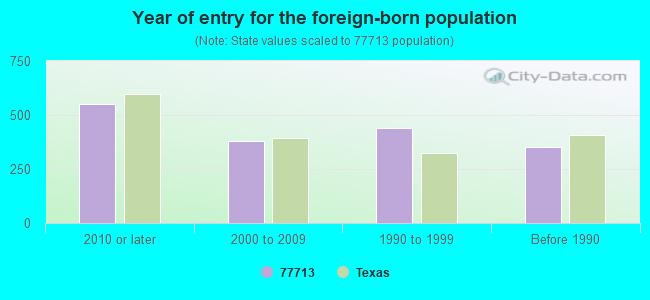
Year of entry for the foreign-born population
5522010 or later
3782000 to 2009
4421990 to 1999
350Before 1990
Facilities with environmental interests located in this zip code:
APAC-TEXAS INC (12907 HIGHWAY 90 W in BEAUMONT, TX)
(Resource Conservation and Recovery Act (tracking hazardous waste)) Alternative names: APAC OF TEXAS
ADVANTAGE BLASTING AND COATING (13879 US HWY 90 in BEAUMONT, TX)
Small Quantity Generators, between 100 kg and 1000 kg of hazardous waste/month (Resource Conservation and Recovery Act (tracking hazardous waste)) - notification Organizations: RACHEL CAMMACK (CONTACT/OWNER)
Housing units lacking complete plumbing facilities: 6.6% Housing units lacking complete kitchen facilities: 8.4%
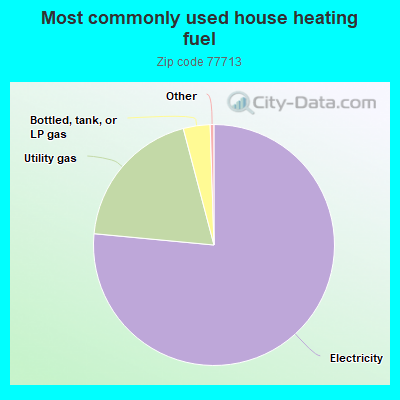
76.5%Electricity
19.4%Utility gas
3.6%Bottled, tank, or LP gas
Population in 1990: 10,798.
Place of birth for U.S.-born residents:
This state: 9,759
Northeast: 318
Midwest: 629
South: 2,024
West: 321
61% of the 77713 zip code residents lived in the same house 5 years ago. Out of people who lived in different houses, 55% lived in this county. Out of people who lived in different counties, 50% lived in Texas.
89% of the 77713 zip code residents lived in the same house 1 year ago. Out of people who lived in different houses, 50% moved from this county. Out of people who lived in different houses, 20% moved from different county within same state. Out of people who lived in different houses, 29% moved from different state. Out of people who lived in different houses, 2% moved from abroad.
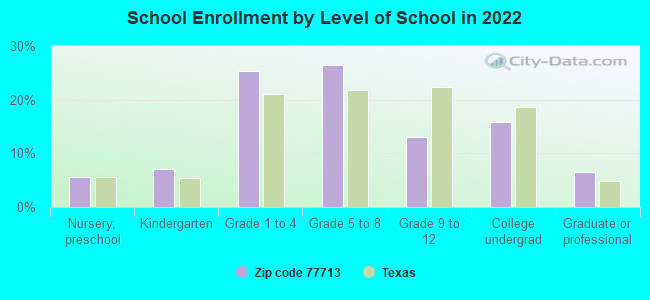
Private vs. public school enrollment:
Students in private schools in grades 1 to 8 (elementary and middle school): 316
Here:
16.1%
Texas:
8.8%
Students in private schools in grades 9 to 12 (high school):
Here:
0.0%
Texas:
8.0%
Students in private undergraduate colleges: 155
Here:
26.0%
Texas:
16.2%
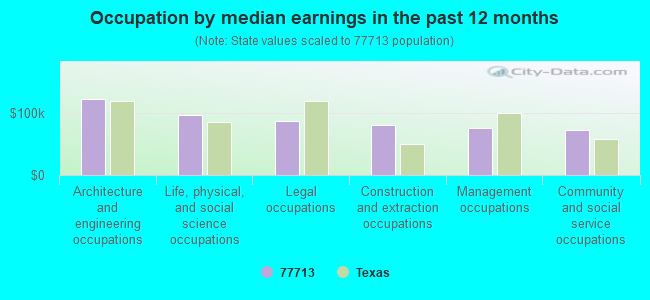
Occupation by median earnings in the past 12 months ($)
122,833Architecture and engineering occupations
96,506Life, physical, and social science occupations
86,907Legal occupations
80,830Construction and extraction occupations
75,516Management occupations
72,849Community and social service occupations
Companies with federal contracts located in this zip code (BEAUMONT, TX):
BEAUMONT WINGS, INC (455KEITH RD; small business)
$144,985 with Defense Logistics Agency for Liquid Propellants and Fuels, Petroleum Base. Signed on 2004-03-26. Completion date: 2007-03-31.
APAC-TEXAS, INC (12907 US HIGHWAY 90 WEST) : $65,490 in 5 contractsfrom 2001 to 2005
Contracts for Miscellaneous Construction Equipment, Construction of Structures and Facilities -- Sewage and Waste Facilities by Army, Navy Signed by year:2000: $0; 2001: $35,958; 2002: $0; 2003: $204,033; 2004: -$16,142; 2005: -$158,359; 2006: $0.
Biggest contracts:
$182,430 with Army for Miscellaneous Construction Equipment. Signed on 2003-12-22. Completion date: 2004-12-21.
$35,958 with Navy for Construction of Structures and Facilities -- Sewage and Waste Facilities. Signed on 2001-12-05. Completion date: 2002-01-18.
$21,603 with Army for Miscellaneous Construction Equipment. Signed on 2003-11-04. Completion date: 2003-12-31.
-$16,142, same as above.Signed on 2004-03-18. Completion date: 2003-12-31.
CARTER, REAGAN TYE (10588 KEITH RD; small business) : $16,228 in 5 contractsfrom 2003 to 2005
Contracts for Aircraft Ground Servicing Equipment, Warehouse Trucks and Tractors, Self-Propelled by Army Signed by year:2000: $0; 2001: $0; 2002: $0; 2003: $9,603; 2004: $0; 2005: $6,625; 2006: $0.
Biggest contracts:
$6,625 with Army for Aircraft Ground Servicing Equipment. Taking place in NY. Signed on 2005-04-28. Completion date: 2005-05-19.
$5,250 with Army for Warehouse Trucks and Tractors, Self-Propelled. Signed on 2003-05-01. Completion date: 2003-05-12.
$4,215 with Army for Aircraft Ground Servicing Equipment. Signed on 2003-09-23. Completion date: 2003-10-24.
$188 with Army for Warehouse Trucks and Tractors, Self-Propelled. Signed on 2003-06-13. Completion date: 2003-05-12.
HAMILTON LUMBER (; small business)
$3,286 with Bureau of Prisoners/Federal Prison System for . Signed on 2004-11-10. Completion date: 2004-11-24.
Top industries in this zip code by the number of employees in 2005:
Construction: Oil and Gas Pipeline and Related Structures Construction (500-999 employees: 1 establishment)
Professional, Scientific, and Technical Services: Administrative Management and General Management Consulting Services (100-249: 1)
Construction: Highway, Street, and Bridge Construction (100-249: 1)
2003 - 2018 National Fire Incident Reporting System (NFIRS) incidents
Based on the data from the years 2003 - 2018 the average number of fires per year is 14. The highest number of fire incidents - 24 took place in 2011, and the least - 2 in 2004. The data has a rising trend.
When looking into fire subcategories, the most incidents belonged to: Outside Fires (55.7%), and Structure Fires (26.8%).
Fire incident types reported to NFIRS in Zip Code 77713


 Nearest zip codes: 77707, 77706, 77613, 77708, 77702, 77701.


 Based on the data from the years 2003 - 2018 the average number of fires per year is 14. The highest number of fire incidents - 24 took place in 2011, and the least - 2 in 2004. The data has a rising trend.
 When looking into fire subcategories, the most incidents belonged to: Outside Fires (55.7%), and Structure Fires (26.8%).