Averages for the 2020 tax year for zip code 77702, filed in 2021:
Average Adjusted Gross Income (AGI) in 2020: $54,436 (Individual Income Tax Returns)
Here:
$54,436
State:
$77,054
Salary/wage: $41,354 (reported on 84.8% of returns)
Here:
$41,354
State:
$62,766
(% of AGI for various income ranges: 1321.7% for AGIs below $25k, 3530.3% for AGIs $25k-50k, 6619.1% for AGIs $50k-75k, 8434.0% for AGIs $75k-100k, 11841.4% for AGIs $100k-200k)
Taxable interest for individuals: $1,133 (reported on 16.8% of returns)
This zip code:
$1,133
Texas:
$2,665
(% of AGI for various income ranges: 1.7% for AGIs below $25k, 4.8% for AGIs $25k-50k, 10.0% for AGIs $50k-75k, 68.0% for AGIs $75k-100k, 50.0% for AGIs $100k-200k)
Ordinary dividends: $14,506 (reported on 12.8% of returns)
Here:
$14,506
State:
$10,044
(% of AGI for various income ranges: 10.0% for AGIs below $25k, 32.3% for AGIs $25k-50k, 100.0% for AGIs $50k-75k, 424.3% for AGIs $100k-200k)
Net capital gain/loss in AGI: +$14,960 (reported on 12.0% of returns)
Here:
+$14,960
State:
+$39,590
(% of AGI for various income ranges: 4.9% for AGIs below $25k, 18.4% for AGIs $25k-50k, 99.1% for AGIs $50k-75k, 431.4% for AGIs $100k-200k)
Profit/loss from business: +$3,177 (reported on 20.8% of returns)
Here:
+$3,177
State:
+$10,888
(% of AGI for various income ranges: 15.6% for AGIs below $25k, 5.2% for AGIs $25k-50k, 20.0% for AGIs $50k-75k, 1034.3% for AGIs $100k-200k)
Taxable individual retirement arrangement distribution: $17,171 (reported on 5.6% of returns)
77702:
$17,171
Texas:
$24,740
(% of AGI for various income ranges: 82.4% for AGIs below $25k, 326.4% for AGIs $50k-75k, 721.4% for AGIs $100k-200k)
Total itemized deductions: $39,130 (reported on 8.0% of returns)
Here:
$39,130
State:
$40,428
(% of AGI for various income ranges: 243.5% for AGIs $25k-50k, 912.7% for AGIs $50k-75k, 3077.1% for AGIs $100k-200k)
Charity contributions: $17,000 (reported on 4.8% of returns)
Here:
$17,000
State:
$18,201
(% of AGI for various income ranges: 91.0% for AGIs $25k-50k, 1054.3% for AGIs $100k-200k)
Taxes paid: $5,625 (reported on 6.4% of returns)
77702:
$5,625
State:
$7,821
(% of AGI for various income ranges: 45.5% for AGIs $25k-50k, 441.4% for AGIs $100k-200k)
Earned income credit: $2,662 (reported on 27.2% of returns)
Here:
$2,662
State:
$2,584
(% of AGI for various income ranges: 154.9% for AGIs below $25k, 87.1% for AGIs $25k-50k)
Percentage of individuals using paid preparers for their 2020 taxes: 86.4%
Here:
86%
State:
92%
(% for various income ranges: 84.9% for AGIs below $25k, 86.8% for AGIs $25k-50k, 80.0% for AGIs $50k-75k, 85.7% for AGIs $75k-100k, 100.0% for AGIs $100k-200k, 100.0% for AGIs over 200k)
Averages for the 2012 tax year for zip code 77702, filed in 2013:
Average Adjusted Gross Income (AGI) in 2012: $56,133 (Individual Income Tax Returns)
Here:
$56,133
State:
$65,384
Salary/wage: $39,476 (reported on 86.1% of returns)
Here:
$39,476
State:
$52,524
(% of AGI for various income ranges: 81.8% for AGIs below $25k, 89.9% for AGIs $25k-50k, 82.4% for AGIs $50k-75k, 77.0% for AGIs $75k-100k, 72.9% for AGIs $100k-200k, 26.2% for AGIs over 200k)
Taxable interest for individuals: $2,264 (reported on 20.4% of returns)
This zip code:
$2,264
Texas:
$2,372
(% of AGI for various income ranges: 0.4% for AGIs below $25k, 0.4% for AGIs $25k-50k, 0.2% for AGIs $50k-75k, 0.8% for AGIs $75k-100k, 0.7% for AGIs $100k-200k, 1.4% for AGIs over 200k)
Ordinary dividends: $14,000 (reported on 13.9% of returns)
Here:
$14,000
State:
$9,721
(% of AGI for various income ranges: 2.6% for AGIs below $25k, 0.5% for AGIs $25k-50k, 2.4% for AGIs $50k-75k, 1.5% for AGIs $100k-200k, 6.9% for AGIs over 200k)
Net capital gain/loss in AGI: +$18,700 (reported on 10.2% of returns)
Here:
+$18,700
State:
+$35,319
(% of AGI for various income ranges: 0.8% for AGIs $50k-75k, 1.1% for AGIs $100k-200k, 8.5% for AGIs over 200k)
Profit/loss from business: +$13,492 (reported on 17.5% of returns)
Here:
+$13,492
State:
+$13,732
(% of AGI for various income ranges: 8.3% for AGIs below $25k, 2.0% for AGIs $50k-75k, 21.2% for AGIs $100k-200k)
Taxable individual retirement arrangement distribution: $15,033 (reported on 6.6% of returns)
77702:
$15,033
Texas:
$19,511
(% of AGI for various income ranges: 3.1% for AGIs below $25k, 3.5% for AGIs $50k-75k, 6.6% for AGIs $100k-200k)
Total itemized deductions: $30,481 (19% of AGI, reported on 19.7% of returns)
Here:
$30,481
State:
$24,724
Here:
18.6% of AGI
State:
15.9% of AGI
(% of AGI for various income ranges: 10.2% for AGIs $25k-50k, 10.1% for AGIs $50k-75k, 11.9% for AGIs $75k-100k, 11.2% for AGIs $100k-200k, 13.9% for AGIs over 200k)
Charity contributions: $10,176 (reported on 15.3% of returns)
Here:
$10,176
State:
$6,808
(% of AGI for various income ranges: 1.7% for AGIs $25k-50k, 1.6% for AGIs $50k-75k, 2.5% for AGIs $75k-100k, 2.7% for AGIs $100k-200k, 4.6% for AGIs over 200k)
Taxes paid: $6,081 (reported on 19.0% of returns)
77702:
$6,081
State:
$6,921
(% of AGI for various income ranges: 2.0% for AGIs $25k-50k, 2.2% for AGIs $50k-75k, 3.3% for AGIs $75k-100k, 3.4% for AGIs $100k-200k, 1.8% for AGIs over 200k)
Earned income credit: $2,314 (reported on 27.0% of returns)
Here:
$2,314
State:
$2,570
(% of AGI for various income ranges: 8.0% for AGIs below $25k, 1.1% for AGIs $25k-50k)
Percentage of individuals using paid preparers for their 2012 taxes: 54.7%
Here:
55%
State:
51%
(% for various income ranges: 54.4% for AGIs below $25k, 51.4% for AGIs $25k-50k, 50.0% for AGIs $50k-75k, 57.1% for AGIs $75k-100k, 55.6% for AGIs $100k-200k, 100.0% for AGIs over 200k)
Averages for the 2004 tax year for zip code 77702, filed in 2005:
Average Adjusted Gross Income (AGI) in 2004: $57,230 (Individual Income Tax Returns)
Here:
$57,230
State:
$47,881
Salary/wage: $43,912 (reported on 84.8% of returns)
Here:
$43,912
State:
$41,947
(% of AGI for various income ranges: 99.6% for AGIs below $10k, 84.0% for AGIs $10k-25k, 88.4% for AGIs $25k-50k, 77.4% for AGIs $50k-75k, 75.9% for AGIs $75k-100k, 51.2% for AGIs over 100k)
Taxable interest for individuals: $2,168 (reported on 31.2% of returns)
This zip code:
$2,168
Texas:
$2,255
(% of AGI for various income ranges: 4.3% for AGIs below $10k, 2.0% for AGIs $10k-25k, 1.5% for AGIs $25k-50k, 1.3% for AGIs $50k-75k, 1.3% for AGIs $75k-100k, 0.8% for AGIs over 100k)
Taxable dividends: $7,896 (reported on 20.0% of returns)
Here:
$7,896
State:
$4,261
(% of AGI for various income ranges: 4.5% for AGIs below $10k, 1.5% for AGIs $10k-25k, 0.9% for AGIs $25k-50k, 2.1% for AGIs $50k-75k, 2.6% for AGIs $75k-100k, 3.5% for AGIs over 100k)
Net capital gain/loss: +$7,446 (reported on 16.8% of returns)
Here:
+$7,446
State:
+$16,110
(% of AGI for various income ranges: -4.6% for AGIs below $10k, -0.3% for AGIs $10k-25k, 0.1% for AGIs $25k-50k, -0.1% for AGIs $50k-75k, 1.0% for AGIs $75k-100k, 3.9% for AGIs over 100k)
Profit/loss from business: +$19,747 (reported on 14.5% of returns)
Here:
+$19,747
State:
+$11,013
(% of AGI for various income ranges: 2.7% for AGIs below $10k, 4.6% for AGIs $10k-25k, 0.1% for AGIs $25k-50k, 3.9% for AGIs $50k-75k, 7.2% for AGIs over 100k)
IRA payment deduction: $2,550 (reported on 1.7% of returns)
77702:
$2,550
Texas:
$3,120
Total itemized deductions: $21,235 (15% of AGI, reported on 19.5% of returns)
Here:
$21,235
State:
$19,631
Here:
15.0% of AGI
State:
18.9% of AGI
(% of AGI for various income ranges: 7.4% for AGIs $10k-25k, 6.5% for AGIs $25k-50k, 11.5% for AGIs $50k-75k, 12.0% for AGIs $75k-100k, 6.1% for AGIs over 100k)
Charity contributions deductions: $8,590 (5% of AGI, reported on 16.6% of returns)
Here:
$8,590
State:
$4,753
Here:
5.4% of AGI
State:
4.2% of AGI
(% of AGI for various income ranges: 1.2% for AGIs $10k-25k, 1.0% for AGIs $25k-50k, 2.5% for AGIs $50k-75k, 3.2% for AGIs $75k-100k, 3.1% for AGIs over 100k)
Total tax: $14,838 (reported on 67.1% of returns)
77702:
$14,838
State:
$9,058
(% of AGI for various income ranges: 2.4% for AGIs below $10k, 3.9% for AGIs $10k-25k, 6.0% for AGIs $25k-50k, 10.1% for AGIs $50k-75k, 11.7% for AGIs $75k-100k, 25.1% for AGIs over 100k)
Earned income credit: $1,909 (reported on 28.3% of returns)
Here:
$1,909
State:
$2,024
Percentage of individuals using paid preparers for their 2004 taxes: 59.7%
Here:
60%
State:
57%
(% for various income ranges: 62.1% for AGIs below $10k, 58.9% for AGIs $10k-25k, 58.0% for AGIs $25k-50k, 52.8% for AGIs $50k-75k, 50.8% for AGIs $75k-100k, 76.3% for AGIs over 100k)
Household received Food Stamps/SNAP in the past 12 months: 183 Household did not receive Food Stamps/SNAP in the past 12 months: 1,369
Women who had a birth in the past 12 months: 65 (66 now married, 0 unmarried) Women who did not have a birth in the past 12 months: 780 (366 now married, 412 unmarried)
Housing units in zip code 77702 with a mortgage: 309 Median monthly owner costs for units with a mortgage: $1,553 Median monthly owner costs for units without a mortgage: $549
Residents with income below the poverty level in 2022:
This zip code:
10.5%
Whole state:
14.0%
Residents with income below 50% of the poverty level in 2022:
This zip code:
9.2%
Whole state:
7.4%
Median number of rooms in houses and condos:
Here:
7.2
State:
6.3
Median number of rooms in apartments:
Here:
4.0
State:
4.0
Notable locations in this zip code not listed on our city pages
Parks in zip code 77702 include: Hebert Park (1), Gilbert Park (2), Reed Park (3), Purple Stadium (4), Central Senior High School Football Field (5). Display/hide their locations on the map
Facilities with environmental interests located in this zip code:
A-1 DRY CLEANERS (1115 NORTH 11TH STREET in BEAUMONT, TX)
Small Quantity Generators, between 100 kg and 1000 kg of hazardous waste/month (Resource Conservation and Recovery Act (tracking hazardous waste)) - notification (Resource Conservation and Recovery Act (tracking hazardous waste)) Organizations: ALEX CHUN (CONTACT/OWNER)
Alternative names: A-1 DRY CLNRS, A-1 DRYCLEANERS
AMERICAN TELEPHONE AND TELEGRAPH COMPANY (RURAL ROUTE FELECIA in BEAUMONT, TX)
(Resource Conservation and Recovery Act (tracking hazardous waste)) Organizations: AMERICAN TELEPHONE & TELEPHONE COMPANY (CONTACT/OPERATOR)
Alternative names: AMERICAN TEL & TEL CO LONG LINES
ARCHIES PAINT & BODY SHOP (3050 RUSK in BEAUMONT, TX)
(Resource Conservation and Recovery Act (tracking hazardous waste)) Alternative names: ARCHIES COLLISION REPAIR
BAKER AUTO REPAIR (2310 CALDER STREET in BEAUMONT, TX)
(Resource Conservation and Recovery Act (tracking hazardous waste)) Business NAICS classification: ALL OTHER AUTOMOTIVE REPAIR AND MAINTENANCE.
AMERICAN TRANSMISSION (510 N IH 10 in BEAUMONT, TX)
(Resource Conservation and Recovery Act (tracking hazardous waste)) Business NAICS classification: AUTOMOTIVE TRANSMISSION REPAIR. Alternative names: AMERICAN TRNSMSN
BAKER AUTO REPAIR (2025 CALDER in BEAUMONT, TX)
(Resource Conservation and Recovery Act (tracking hazardous waste))
Housing units lacking complete plumbing facilities: 1.6% Housing units lacking complete kitchen facilities: 4.2%
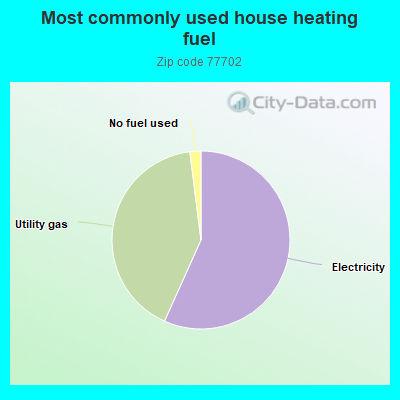
56.8%Electricity
41.3%Utility gas
2.0%No fuel used
Population in 1990: 4,396.
Place of birth for U.S.-born residents:
This state: 2,343
Northeast: 37
Midwest: 12
South: 235
West: 73
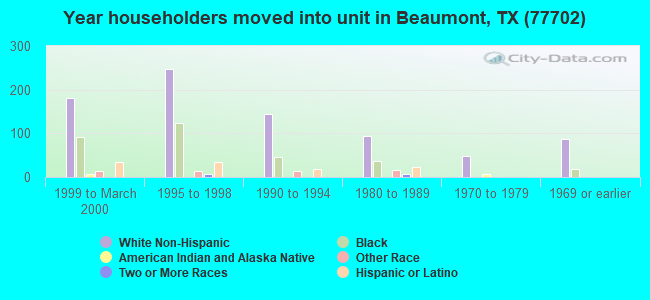
49% of the 77702 zip code residents lived in the same house 5 years ago. Out of people who lived in different houses, 61% lived in this county. Out of people who lived in different counties, 50% lived in Texas.
94% of the 77702 zip code residents lived in the same house 1 year ago. Out of people who lived in different houses, 79% moved from this county. Out of people who lived in different houses, 15% moved from different county within same state. Out of people who lived in different houses, 2% moved from abroad.
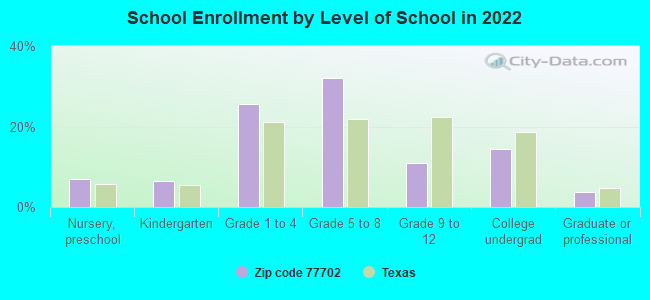
Private vs. public school enrollment:
Students in private schools in grades 1 to 8 (elementary and middle school): 72
Here:
16.1%
Texas:
8.8%
Students in private schools in grades 9 to 12 (high school): 3
Here:
3.7%
Texas:
8.0%
Students in private undergraduate colleges: 38
Here:
33.5%
Texas:
16.2%
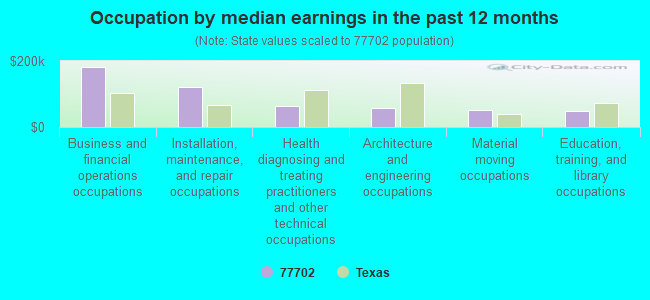
Occupation by median earnings in the past 12 months ($)
183,183Business and financial operations occupations
120,176Installation, maintenance, and repair occupations
64,471Health diagnosing and treating practitioners and other technical occupations
58,666Architecture and engineering occupations
50,291Material moving occupations
49,457Education, training, and library occupations
Companies with federal contracts located in this zip code (BEAUMONT, TX):
WATKINS COMPANY (65 SAWYER; small business) : $58,918 in 2 contractsin 2000
$58,918 with Air Force for Maintenance, Repair or Alteration of Real Property -- Recreational Buildings. Taking place in OK. Signed on 2000-09-20. Completion date: 2000-09-20.
$0, same as above.Signed on 2000-09-20. Completion date: 2000-09-20.
CHRISTUS HOSPITAL ST ELIZABET (3030 NORTH ST) : $49,295 in 10 contractsfrom 2003 to 2006
Contracts for Recreational Services, Recreational and Gymnastic Equipment by Army Signed by year:2000: $0; 2001: $0; 2002: $0; 2003: $4,428; 2004: $9,912; 2005: $9,974; 2006: $24,981.
Biggest contracts:
$25,000 with Army for Recreational Services. Signed on 2006-01-18. Completion date: 2006-12-31.
$12,610 with Army for Recreational and Gymnastic Equipment. Signed on 2006-01-24. Completion date: 2005-12-31.
$5,712, same as above.Signed on 2004-12-15. Completion date: 2005-12-31.
$4,950, same as above.Signed on 2005-03-22. Completion date: 2005-12-31.
DELI MANAGEMENT, INC (2400 BROADWAY ST) : $12,661 in 2 contractsfrom 2005 to 2006
$8,795 with Army for Composite Food Packages. Taking place in AL. Signed on 2006-01-19. Completion date: 2006-02-05.
$3,866, same as above.Signed on 2005-10-19. Completion date: 2005-10-23.
DIXON & SON INC (2540 NORTH ST; small business)
$5,788 with Army for Miscellaneous Items. Signed on 2003-09-29. Completion date: 2003-10-15.
THE PIANO CENTER (33 NORTH 11TH STREET; small business)
$3,828 with Bureau of Prisoners/Federal Prison System for . Signed on 2005-07-19. Completion date: 2005-07-29.
dr. michael thomas - gulf coast inf (2965 HARRISON; small business) : $780 in 2 contractsin 2005
$500 with Bureau of Prisoners/Federal Prison System for . Signed on 2005-06-21. Completion date: 2005-06-30.
$280, same as above.Signed on 2005-04-28. Completion date: 2005-04-28.
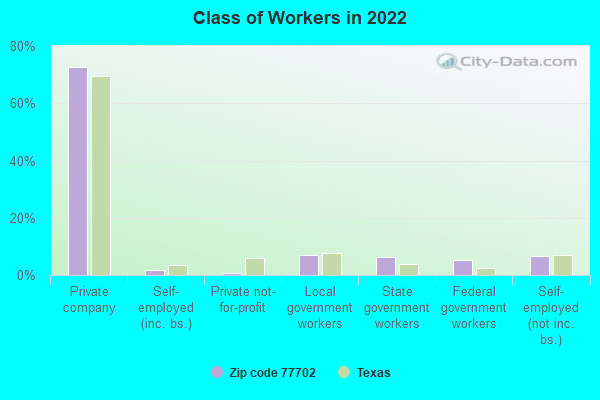
Top industries in this zip code by the number of employees in 2005:
Health Care and Social Assistance: General Medical and Surgical Hospitals (over 1000 employees: 1 establishment)
Health Care and Social Assistance: Offices of Physicians (except Mental Health Specialists) (100-249: 1, 50-99: 4, 20-49: 9, 10-19: 8, 5-9: 15, 1-4: 59)
Health Care and Social Assistance: Home Health Care Services (500-999: 1, 20-49: 3, 10-19: 2, 5-9: 1)
Health Care and Social Assistance: Services for the Elderly and Persons with Disabilities (100-249: 2)
Professional, Scientific, and Technical Services: Offices of Lawyers (100-249: 1, 20-49: 2, 10-19: 1, 5-9: 2, 1-4: 16)
Management of Companies and Enterprises: Corporate, Subsidiary, and Regional Managing Offices (100-249: 1, 20-49: 1, 10-19: 1, 1-4: 2)
Administrative and Support and Waste Management and Remediation Services: Temporary Help Services (100-249: 1, 1-4: 1)
Accommodation and Food Services: Food Service Contractors (100-249: 1)
Information: Radio Stations (50-99: 1, 20-49: 1, 1-4: 4)
Arts, Entertainment, and Recreation: Fitness and Recreational Sports Centers (50-99: 1, 20-49: 1)
People in group quarters in 2010:
6 people in other noninstitutional facilities
People in group quarters in 2000:
6 people in wards in general hospitals for patients who have no usual home elsewhere
5 people in religious group quarters
Fatal accident statistics in 2014:
Fatal accident count: 1
Vehicles involved in fatal accidents: 1
Fatal accidents caused by drunken drivers: 0
Fatalities: 1
Persons involved in fatal accidents: 4
Pedestrians involved in fatal accidents: 1
Fatal accident statistics in 2012:
Fatal accident count: 1
Vehicles involved in fatal accidents: 1
Fatal accidents caused by drunken drivers: 0
Fatalities: 1
Persons involved in fatal accidents: 1
Pedestrians involved in fatal accidents: 1
Home Mortgage Disclosure Act Aggregated Statistics For Year 2009 (Based on 4 partial tracts)
A) FHA, FSA/RHS & VA Home Purchase Loans
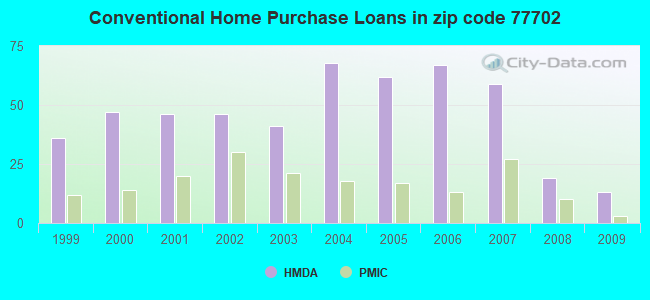
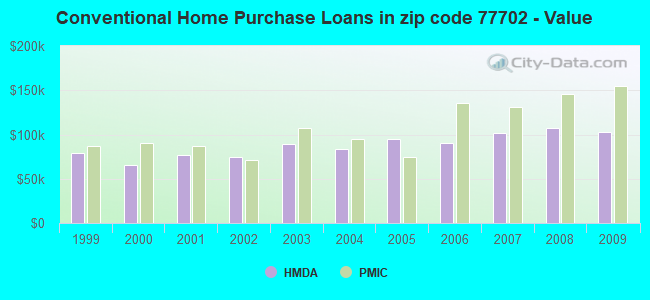
B) Conventional Home Purchase Loans
C) Refinancings
D) Home Improvement Loans
E) Loans on Dwellings For 5+ Families
F) Non-occupant Loans on < 5 Family Dwellings (A B C & D)
Number
Average Value
Number
Average Value
Number
Average Value
Number
Average Value
Number
Average Value
Number
Average Value
LOANS ORIGINATED
18
$116,751
13
$103,295
20
$173,706
6
$18,895
1
$56,470
6
$75,073
APPLICATIONS APPROVED, NOT ACCEPTED
0
$0
2
$76,405
3
$58,393
1
$7,100
0
$0
0
$0
APPLICATIONS DENIED
6
$122,968
3
$120,830
16
$99,699
12
$18,079
0
$0
4
$87,778
APPLICATIONS WITHDRAWN
1
$140,660
3
$133,080
6
$113,900
0
$0
0
$0
0
$0
FILES CLOSED FOR INCOMPLETENESS
0
$0
0
$0
1
$160,550
1
$45,960
0
$0
2
$103,255
Aggregated Statistics For Year 2008 (Based on 4 partial tracts)
A) FHA, FSA/RHS & VA Home Purchase Loans
B) Conventional Home Purchase Loans
C) Refinancings
D) Home Improvement Loans
E) Loans on Dwellings For 5+ Families
F) Non-occupant Loans on < 5 Family Dwellings (A B C & D)
G) Loans On Manufactured Home Dwelling (A B C & D)
Number
Average Value
Number
Average Value
Number
Average Value
Number
Average Value
Number
Average Value
Number
Average Value
Number
Average Value
LOANS ORIGINATED
11
$111,600
19
$107,811
16
$101,893
6
$22,683
0
$0
12
$81,608
0
$0
APPLICATIONS APPROVED, NOT ACCEPTED
1
$38,740
5
$134,832
1
$13,130
2
$20,065
0
$0
4
$159,840
1
$34,800
APPLICATIONS DENIED
3
$109,453
17
$116,748
24
$130,352
18
$34,291
3
$1,462,950
8
$124,494
1
$53,840
APPLICATIONS WITHDRAWN
1
$74,850
3
$155,180
1
$83,830
1
$88,640
0
$0
0
$0
0
$0
FILES CLOSED FOR INCOMPLETENESS
0
$0
0
$0
1
$191,810
3
$63,937
0
$0
0
$0
0
$0
Aggregated Statistics For Year 2007 (Based on 4 partial tracts)
A) FHA, FSA/RHS & VA Home Purchase Loans
B) Conventional Home Purchase Loans
C) Refinancings
D) Home Improvement Loans
E) Loans on Dwellings For 5+ Families
F) Non-occupant Loans on < 5 Family Dwellings (A B C & D)
G) Loans On Manufactured Home Dwelling (A B C & D)
Number
Average Value
Number
Average Value
Number
Average Value
Number
Average Value
Number
Average Value
Number
Average Value
Number
Average Value
LOANS ORIGINATED
10
$122,092
59
$101,212
24
$100,350
22
$46,955
3
$363,947
13
$89,303
0
$0
APPLICATIONS APPROVED, NOT ACCEPTED
1
$49,240
10
$137,676
3
$141,410
3
$18,883
0
$0
1
$86,670
1
$149,180
APPLICATIONS DENIED
1
$56,830
14
$92,193
34
$100,594
17
$57,574
1
$315,170
7
$66,873
6
$45,355
APPLICATIONS WITHDRAWN
2
$138,995
9
$116,253
13
$89,128
3
$51,897
1
$281,020
4
$124,945
0
$0
FILES CLOSED FOR INCOMPLETENESS
0
$0
4
$82,050
2
$34,830
1
$56,830
0
$0
0
$0
0
$0
Aggregated Statistics For Year 2006 (Based on 4 partial tracts)
A) FHA, FSA/RHS & VA Home Purchase Loans
B) Conventional Home Purchase Loans
C) Refinancings
D) Home Improvement Loans
E) Loans on Dwellings For 5+ Families
F) Non-occupant Loans on < 5 Family Dwellings (A B C & D)
G) Loans On Manufactured Home Dwelling (A B C & D)
Number
Average Value
Number
Average Value
Number
Average Value
Number
Average Value
Number
Average Value
Number
Average Value
Number
Average Value
LOANS ORIGINATED
3
$115,243
67
$89,956
19
$91,615
12
$29,387
3
$186,600
11
$75,600
0
$0
APPLICATIONS APPROVED, NOT ACCEPTED
1
$68,290
5
$112,592
11
$96,377
3
$15,420
0
$0
1
$30,200
1
$36,110
APPLICATIONS DENIED
1
$82,730
46
$75,732
38
$80,591
14
$21,496
0
$0
17
$68,990
6
$34,810
APPLICATIONS WITHDRAWN
0
$0
18
$74,850
22
$99,638
0
$0
0
$0
12
$67,638
0
$0
FILES CLOSED FOR INCOMPLETENESS
0
$0
1
$85,250
5
$130,722
0
$0
0
$0
0
$0
0
$0
Aggregated Statistics For Year 2005 (Based on 4 partial tracts)
A) FHA, FSA/RHS & VA Home Purchase Loans
B) Conventional Home Purchase Loans
C) Refinancings
D) Home Improvement Loans
E) Loans on Dwellings For 5+ Families
F) Non-occupant Loans on < 5 Family Dwellings (A B C & D)
G) Loans On Manufactured Home Dwelling (A B C & D)
Number
Average Value
Number
Average Value
Number
Average Value
Number
Average Value
Number
Average Value
Number
Average Value
Number
Average Value
LOANS ORIGINATED
8
$82,540
62
$94,855
40
$108,948
18
$43,060
1
$211,700
17
$59,739
0
$0
APPLICATIONS APPROVED, NOT ACCEPTED
0
$0
15
$53,738
8
$78,111
3
$51,557
1
$325,360
4
$49,115
0
$0
APPLICATIONS DENIED
0
$0
35
$78,076
46
$86,384
20
$35,158
0
$0
6
$41,158
2
$28,910
APPLICATIONS WITHDRAWN
1
$69,620
24
$82,115
24
$109,321
14
$338,881
1
$606,680
5
$149,792
0
$0
FILES CLOSED FOR INCOMPLETENESS
0
$0
3
$101,263
5
$85,524
0
$0
0
$0
1
$38,740
0
$0
Aggregated Statistics For Year 2004 (Based on 4 partial tracts)
A) FHA, FSA/RHS & VA Home Purchase Loans
B) Conventional Home Purchase Loans
C) Refinancings
D) Home Improvement Loans
E) Loans on Dwellings For 5+ Families
F) Non-occupant Loans on < 5 Family Dwellings (A B C & D)
G) Loans On Manufactured Home Dwelling (A B C & D)
Number
Average Value
Number
Average Value
Number
Average Value
Number
Average Value
Number
Average Value
Number
Average Value
Number
Average Value
LOANS ORIGINATED
7
$80,911
68
$84,167
55
$93,327
20
$46,070
4
$110,822
16
$57,844
0
$0
APPLICATIONS APPROVED, NOT ACCEPTED
1
$73,880
18
$67,927
7
$107,831
3
$91,083
0
$0
5
$64,554
0
$0
APPLICATIONS DENIED
0
$0
35
$53,347
48
$84,954
19
$26,156
0
$0
11
$58,767
4
$37,295
APPLICATIONS WITHDRAWN
0
$0
8
$72,508
33
$81,248
1
$63,030
0
$0
2
$72,555
0
$0
FILES CLOSED FOR INCOMPLETENESS
0
$0
6
$55,170
8
$139,650
0
$0
0
$0
0
$0
0
$0
Aggregated Statistics For Year 2003 (Based on 4 partial tracts)
A) FHA, FSA/RHS & VA Home Purchase Loans
B) Conventional Home Purchase Loans
C) Refinancings
D) Home Improvement Loans
E) Loans on Dwellings For 5+ Families
F) Non-occupant Loans on < 5 Family Dwellings (A B C & D)
Number
Average Value
Number
Average Value
Number
Average Value
Number
Average Value
Number
Average Value
Number
Average Value
LOANS ORIGINATED
14
$89,875
41
$89,439
46
$100,667
15
$32,252
5
$128,716
17
$59,853
APPLICATIONS APPROVED, NOT ACCEPTED
1
$83,830
11
$58,361
6
$48,485
2
$88,860
0
$0
3
$39,230
APPLICATIONS DENIED
0
$0
13
$64,631
44
$95,056
11
$65,692
0
$0
11
$52,465
APPLICATIONS WITHDRAWN
0
$0
7
$98,699
19
$75,940
0
$0
0
$0
3
$80,197
FILES CLOSED FOR INCOMPLETENESS
0
$0
6
$47,663
2
$183,570
0
$0
0
$0
1
$45,470
Aggregated Statistics For Year 2002 (Based on 4 partial tracts)
A) FHA, FSA/RHS & VA Home Purchase Loans
B) Conventional Home Purchase Loans
C) Refinancings
D) Home Improvement Loans
E) Loans on Dwellings For 5+ Families
F) Non-occupant Loans on < 5 Family Dwellings (A B C & D)
Number
Average Value
Number
Average Value
Number
Average Value
Number
Average Value
Number
Average Value
Number
Average Value
LOANS ORIGINATED
11
$56,931
46
$74,197
50
$83,859
10
$28,025
7
$358,853
13
$38,138
APPLICATIONS APPROVED, NOT ACCEPTED
1
$85,250
13
$54,990
16
$89,058
11
$22,306
0
$0
6
$66,390
APPLICATIONS DENIED
1
$49,730
17
$49,825
31
$59,188
9
$39,446
1
$943,410
12
$39,517
APPLICATIONS WITHDRAWN
1
$46,620
8
$49,115
8
$66,498
0
$0
0
$0
1
$90,930
FILES CLOSED FOR INCOMPLETENESS
0
$0
6
$31,210
6
$65,543
0
$0
0
$0
3
$31,460
Aggregated Statistics For Year 2001 (Based on 4 partial tracts)
A) FHA, FSA/RHS & VA Home Purchase Loans
B) Conventional Home Purchase Loans
C) Refinancings
D) Home Improvement Loans
E) Loans on Dwellings For 5+ Families
F) Non-occupant Loans on < 5 Family Dwellings (A B C & D)
Number
Average Value
Number
Average Value
Number
Average Value
Number
Average Value
Number
Average Value
Number
Average Value
LOANS ORIGINATED
12
$61,962
46
$77,021
39
$79,482
13
$43,555
3
$55,410
15
$71,838
APPLICATIONS APPROVED, NOT ACCEPTED
1
$181,860
8
$63,326
6
$64,453
4
$49,758
3
$81,460
3
$83,097
APPLICATIONS DENIED
0
$0
18
$65,896
31
$50,942
7
$26,733
0
$0
10
$37,389
APPLICATIONS WITHDRAWN
0
$0
10
$47,944
19
$63,798
1
$117,930
0
$0
4
$89,155
FILES CLOSED FOR INCOMPLETENESS
0
$0
6
$61,332
11
$71,455
0
$0
0
$0
0
$0
Aggregated Statistics For Year 2000 (Based on 4 partial tracts)
A) FHA, FSA/RHS & VA Home Purchase Loans
B) Conventional Home Purchase Loans
C) Refinancings
D) Home Improvement Loans
E) Loans on Dwellings For 5+ Families
F) Non-occupant Loans on < 5 Family Dwellings (A B C & D)
Number
Average Value
Number
Average Value
Number
Average Value
Number
Average Value
Number
Average Value
Number
Average Value
LOANS ORIGINATED
10
$81,623
47
$65,984
19
$50,913
15
$40,879
2
$140,225
13
$50,759
APPLICATIONS APPROVED, NOT ACCEPTED
0
$0
5
$43,000
8
$45,135
3
$14,253
0
$0
1
$19,040
APPLICATIONS DENIED
1
$48,310
20
$63,174
17
$49,544
8
$19,622
0
$0
8
$40,052
APPLICATIONS WITHDRAWN
0
$0
13
$104,602
3
$39,327
3
$14,077
0
$0
3
$57,780
FILES CLOSED FOR INCOMPLETENESS
1
$63,940
1
$5,250
4
$45,305
1
$11,370
0
$0
0
$0
Aggregated Statistics For Year 1999 (Based on 2 partial tracts)
A) FHA, FSA/RHS & VA Home Purchase Loans
B) Conventional Home Purchase Loans
C) Refinancings
D) Home Improvement Loans
E) Loans on Dwellings For 5+ Families
F) Non-occupant Loans on < 5 Family Dwellings (A B C & D)
Detailed PMIC statistics for the following Tracts:0011.00
, 0012.00
2002 - 2018 National Fire Incident Reporting System (NFIRS) incidents
Based on the data from the years 2002 - 2018 the average number of fires per year is 19. The highest number of fires - 31 took place in 2003, and the least - 12 in 2016. The data has a rising trend.
When looking into fire subcategories, the most incidents belonged to: Structure Fires (40.8%), and Outside Fires (30.7%).
Fire incident types reported to NFIRS in Zip Code 77702
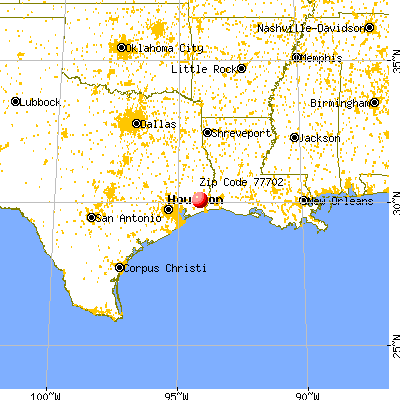


 Nearest zip codes: 77701, 77706, 77703, 77707, 77708, 77713.


 Based on the data from the years 2002 - 2018 the average number of fires per year is 19. The highest number of fires - 31 took place in 2003, and the least - 12 in 2016. The data has a rising trend.
 When looking into fire subcategories, the most incidents belonged to: Structure Fires (40.8%), and Outside Fires (30.7%).