Estimated zip code population in 2022: 30,491 Zip code population in 2010: 28,258 Zip code population in 2000: 26,359
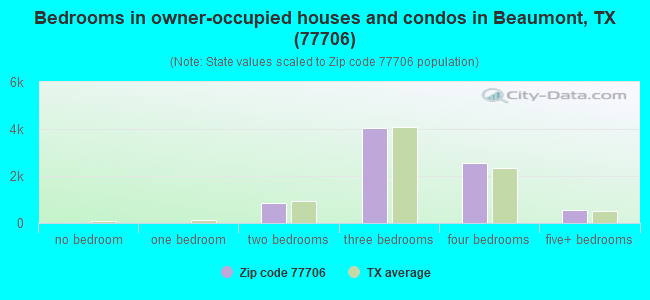
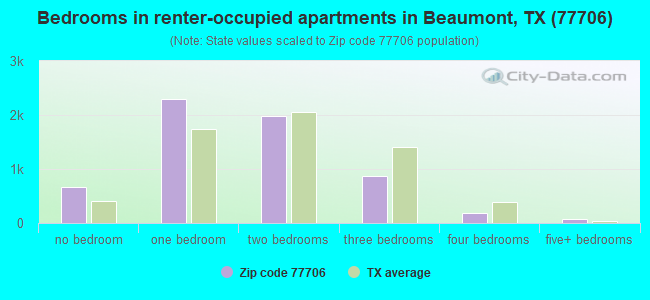
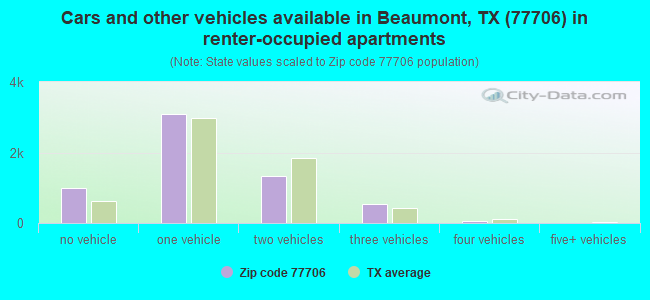
Houses and condos: 15,230 Renter-occupied apartments: 5,991
% of renters here:
43%
State:
38%
March 2022 cost of living index in zip code 77706: 83.1 (low, U.S. average is 100)
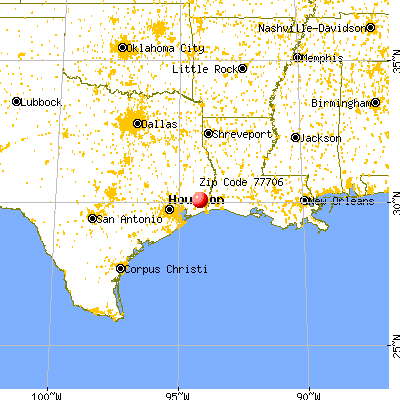
Land area: 11.3 sq. mi. Water area: 0.0 sq. mi.
Population density: 2,702 people per square mile
(average).
OSM Map
General Map
Google Map
MSN Map
OSM Map
General Map
Google Map
MSN Map
OSM Map
General Map
Google Map
MSN Map
OSM Map
General Map
Google Map
MSN Map
Please wait while loading the map...
Real estate property taxes paid for housing units in 2022:
This zip code:
1.8% ($4,400)
Texas:
1.5% ($4,050)
Median real estate property taxes paid for housing units with mortgages in 2022: $5,129 (2.0%) Median real estate property taxes paid for housing units with no mortgage in 2022: $3,883 (1.6%)
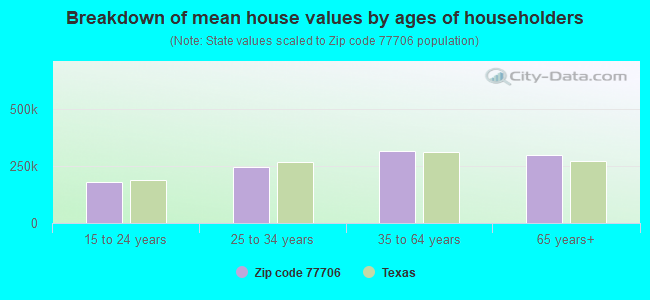
Estimated median house/condo value in 2022: $251,331
77706:
$251,331
Texas:
$275,400
According to our research of Texas and other state lists, there were 27 registered sex offenders living in 77706 zip code as of April 27, 2024. The ratio of all residents to sex offenders in zip code 77706 is 1,098 to 1. The ratio of registered sex offenders to all residents in this zip code is much lower than the state average.
Median resident age:
This zip code:
38.7 years
Texas median age:
35.6 years
Average household size:
This zip code:
2.1 people
Texas:
2.6 people
Averages for the 2020 tax year for zip code 77706, filed in 2021:
Average Adjusted Gross Income (AGI) in 2020: $104,353 (Individual Income Tax Returns)
Here:
$104,353
State:
$77,054
Salary/wage: $70,953 (reported on 81.8% of returns)
Here:
$70,953
State:
$62,766
(% of AGI for various income ranges: 1283.9% for AGIs below $25k, 3560.7% for AGIs $25k-50k, 6239.3% for AGIs $50k-75k, 9345.3% for AGIs $75k-100k, 16919.6% for AGIs $100k-200k, 80565.8% for AGIs over 200k)
Taxable interest for individuals: $4,116 (reported on 35.3% of returns)
This zip code:
$4,116
Texas:
$2,665
(% of AGI for various income ranges: 17.3% for AGIs below $25k, 21.3% for AGIs $25k-50k, 57.2% for AGIs $50k-75k, 108.4% for AGIs $75k-100k, 247.0% for AGIs $100k-200k, 4080.0% for AGIs over 200k)
Ordinary dividends: $15,863 (reported on 24.3% of returns)
Here:
$15,863
State:
$10,044
(% of AGI for various income ranges: 37.3% for AGIs below $25k, 64.2% for AGIs $25k-50k, 149.6% for AGIs $50k-75k, 383.3% for AGIs $75k-100k, 568.2% for AGIs $100k-200k, 10952.1% for AGIs over 200k)
Net capital gain/loss in AGI: +$35,807 (reported on 22.6% of returns)
Here:
+$35,807
State:
+$39,590
(% of AGI for various income ranges: 10.2% for AGIs below $25k, 35.5% for AGIs $25k-50k, 100.1% for AGIs $50k-75k, 293.5% for AGIs $75k-100k, 723.7% for AGIs $100k-200k, 28433.3% for AGIs over 200k)
Profit/loss from business: +$20,676 (reported on 18.6% of returns)
Here:
+$20,676
State:
+$10,888
(% of AGI for various income ranges: 3.7% for AGIs below $25k, 56.0% for AGIs $50k-75k, 189.9% for AGIs $75k-100k, 487.1% for AGIs $100k-200k, 12904.2% for AGIs over 200k)
Taxable individual retirement arrangement distribution: $30,214 (reported on 11.2% of returns)
77706:
$30,214
Texas:
$24,740
(% of AGI for various income ranges: 54.5% for AGIs below $25k, 116.4% for AGIs $25k-50k, 311.0% for AGIs $50k-75k, 602.2% for AGIs $75k-100k, 1216.8% for AGIs $100k-200k, 4673.3% for AGIs over 200k)
Self-employed (Keogh) retirement plans: $28,810 (reported on 0.7% of returns)
77706:
$28,810
Texas:
$29,298
(% of AGI for various income ranges: 43.6% for AGIs $100k-200k, 693.3% for AGIs over 200k)
Total itemized deductions: $43,980 (reported on 11.4% of returns)
Here:
$43,980
State:
$40,428
(% of AGI for various income ranges: 56.6% for AGIs below $25k, 178.7% for AGIs $25k-50k, 425.4% for AGIs $50k-75k, 747.5% for AGIs $75k-100k, 1211.2% for AGIs $100k-200k, 10062.1% for AGIs over 200k)
Charity contributions: $21,032 (reported on 9.0% of returns)
Here:
$21,032
State:
$18,201
(% of AGI for various income ranges: 7.0% for AGIs below $25k, 39.5% for AGIs $25k-50k, 89.4% for AGIs $50k-75k, 178.0% for AGIs $75k-100k, 307.9% for AGIs $100k-200k, 5236.1% for AGIs over 200k)
Taxes paid: $7,323 (reported on 9.9% of returns)
77706:
$7,323
State:
$7,821
(% of AGI for various income ranges: 9.7% for AGIs below $25k, 20.7% for AGIs $25k-50k, 64.5% for AGIs $50k-75k, 115.3% for AGIs $75k-100k, 220.1% for AGIs $100k-200k, 1268.2% for AGIs over 200k)
Earned income credit: $2,455 (reported on 15.1% of returns)
Here:
$2,455
State:
$2,584
(% of AGI for various income ranges: 112.4% for AGIs below $25k, 68.6% for AGIs $25k-50k, 1.0% for AGIs $50k-75k)
Percentage of individuals using paid preparers for their 2020 taxes: 91.1%
Here:
91%
State:
92%
(% for various income ranges: 91.0% for AGIs below $25k, 92.4% for AGIs $25k-50k, 90.7% for AGIs $50k-75k, 90.2% for AGIs $75k-100k, 90.2% for AGIs $100k-200k, 92.0% for AGIs over 200k)
Averages for the 2012 tax year for zip code 77706, filed in 2013:
Average Adjusted Gross Income (AGI) in 2012: $101,681 (Individual Income Tax Returns)
Here:
$101,681
State:
$65,384
Salary/wage: $68,180 (reported on 81.7% of returns)
Here:
$68,180
State:
$52,524
(% of AGI for various income ranges: 78.2% for AGIs below $25k, 77.7% for AGIs $25k-50k, 72.7% for AGIs $50k-75k, 73.4% for AGIs $75k-100k, 71.5% for AGIs $100k-200k, 37.5% for AGIs over 200k)
Taxable interest for individuals: $3,612 (reported on 40.2% of returns)
This zip code:
$3,612
Texas:
$2,372
(% of AGI for various income ranges: 1.6% for AGIs below $25k, 1.2% for AGIs $25k-50k, 1.1% for AGIs $50k-75k, 0.9% for AGIs $75k-100k, 1.0% for AGIs $100k-200k, 1.8% for AGIs over 200k)
Ordinary dividends: $11,933 (reported on 27.6% of returns)
Here:
$11,933
State:
$9,721
(% of AGI for various income ranges: 2.8% for AGIs below $25k, 2.0% for AGIs $25k-50k, 2.2% for AGIs $50k-75k, 2.0% for AGIs $75k-100k, 2.7% for AGIs $100k-200k, 4.0% for AGIs over 200k)
Net capital gain/loss in AGI: +$30,770 (reported on 23.5% of returns)
Here:
+$30,770
State:
+$35,319
(% of AGI for various income ranges: 0.5% for AGIs $25k-50k, 0.5% for AGIs $50k-75k, 1.2% for AGIs $75k-100k, 2.1% for AGIs $100k-200k, 12.5% for AGIs over 200k)
Profit/loss from business: +$24,669 (reported on 17.2% of returns)
Here:
+$24,669
State:
+$13,732
(% of AGI for various income ranges: 5.6% for AGIs below $25k, 1.2% for AGIs $25k-50k, 2.6% for AGIs $50k-75k, 2.1% for AGIs $75k-100k, 3.8% for AGIs $100k-200k, 5.2% for AGIs over 200k)
Taxable individual retirement arrangement distribution: $24,761 (reported on 14.3% of returns)
77706:
$24,761
Texas:
$19,511
(% of AGI for various income ranges: 3.4% for AGIs below $25k, 3.7% for AGIs $25k-50k, 4.6% for AGIs $50k-75k, 5.3% for AGIs $75k-100k, 5.4% for AGIs $100k-200k, 2.2% for AGIs over 200k)
Self-employment retirement plans: $24,943 (reported on 1.0% of returns)
77706:
$24,943
Texas:
$23,938
Total itemized deductions: $30,856 (15% of AGI, reported on 34.7% of returns)
Here:
$30,856
State:
$24,724
Here:
14.6% of AGI
State:
15.9% of AGI
(% of AGI for various income ranges: 10.1% for AGIs below $25k, 10.0% for AGIs $25k-50k, 11.2% for AGIs $50k-75k, 11.8% for AGIs $75k-100k, 12.2% for AGIs $100k-200k, 9.7% for AGIs over 200k)
Charity contributions: $9,554 (reported on 28.9% of returns)
Here:
$9,554
State:
$6,808
(% of AGI for various income ranges: 1.3% for AGIs below $25k, 1.6% for AGIs $25k-50k, 2.1% for AGIs $50k-75k, 2.5% for AGIs $75k-100k, 3.0% for AGIs $100k-200k, 3.0% for AGIs over 200k)
Taxes paid: $8,367 (reported on 34.2% of returns)
77706:
$8,367
State:
$6,921
(% of AGI for various income ranges: 2.0% for AGIs below $25k, 2.2% for AGIs $25k-50k, 2.8% for AGIs $50k-75k, 3.0% for AGIs $75k-100k, 3.7% for AGIs $100k-200k, 2.6% for AGIs over 200k)
Earned income credit: $2,244 (reported on 14.8% of returns)
Here:
$2,244
State:
$2,570
(% of AGI for various income ranges: 6.6% for AGIs below $25k, 0.8% for AGIs $25k-50k)
Percentage of individuals using paid preparers for their 2012 taxes: 54.2%
Here:
54%
State:
51%
(% for various income ranges: 49.3% for AGIs below $25k, 49.5% for AGIs $25k-50k, 52.8% for AGIs $50k-75k, 56.3% for AGIs $75k-100k, 58.0% for AGIs $100k-200k, 80.2% for AGIs over 200k)
Averages for the 2004 tax year for zip code 77706, filed in 2005:
Average Adjusted Gross Income (AGI) in 2004: $71,808 (Individual Income Tax Returns)
Here:
$71,808
State:
$47,881
Salary/wage: $58,734 (reported on 79.7% of returns)
Here:
$58,734
State:
$41,947
(% of AGI for various income ranges: 136.0% for AGIs below $10k, 73.3% for AGIs $10k-25k, 75.5% for AGIs $25k-50k, 73.8% for AGIs $50k-75k, 74.4% for AGIs $75k-100k, 58.4% for AGIs over 100k)
Taxable interest for individuals: $2,888 (reported on 53.6% of returns)
This zip code:
$2,888
Texas:
$2,255
(% of AGI for various income ranges: 13.7% for AGIs below $10k, 4.2% for AGIs $10k-25k, 2.6% for AGIs $25k-50k, 2.1% for AGIs $50k-75k, 2.1% for AGIs $75k-100k, 1.8% for AGIs over 100k)
Taxable dividends: $6,932 (reported on 34.0% of returns)
Here:
$6,932
State:
$4,261
(% of AGI for various income ranges: 12.3% for AGIs below $10k, 2.6% for AGIs $10k-25k, 2.1% for AGIs $25k-50k, 1.9% for AGIs $50k-75k, 2.2% for AGIs $75k-100k, 3.9% for AGIs over 100k)
Net capital gain/loss: +$15,856 (reported on 29.1% of returns)
Here:
+$15,856
State:
+$16,110
(% of AGI for various income ranges: -6.1% for AGIs below $10k, 0.2% for AGIs $10k-25k, 0.5% for AGIs $25k-50k, 1.0% for AGIs $50k-75k, 0.7% for AGIs $75k-100k, 10.3% for AGIs over 100k)
Profit/loss from business: +$18,958 (reported on 16.1% of returns)
Here:
+$18,958
State:
+$11,013
(% of AGI for various income ranges: 16.2% for AGIs below $10k, 3.4% for AGIs $10k-25k, 2.5% for AGIs $25k-50k, 2.8% for AGIs $50k-75k, 2.4% for AGIs $75k-100k, 5.1% for AGIs over 100k)
IRA payment deduction: $3,738 (reported on 2.9% of returns)
77706:
$3,738
Texas:
$3,120
(% of AGI for various income ranges: 0.3% for AGIs $10k-25k, 0.3% for AGIs $25k-50k, 0.2% for AGIs $50k-75k, 0.1% for AGIs $75k-100k, 0.1% for AGIs over 100k)
Self-employed pension: $19,829 (reported on 1.4% of returns)
Here:
$19,829
Texas:
$16,401
(% of AGI for various income ranges: 0.1% for AGIs $10k-25k, 0.1% for AGIs $50k-75k, 0.1% for AGIs $75k-100k, 0.6% for AGIs over 100k)
Total itemized deductions: $19,758 (16% of AGI, reported on 35.6% of returns)
Here:
$19,758
State:
$19,631
Here:
15.7% of AGI
State:
18.9% of AGI
(% of AGI for various income ranges: 14.6% for AGIs below $10k, 10.1% for AGIs $10k-25k, 12.2% for AGIs $25k-50k, 12.0% for AGIs $50k-75k, 13.1% for AGIs $75k-100k, 8.2% for AGIs over 100k)
Charity contributions deductions: $5,689 (4% of AGI, reported on 31.3% of returns)
Here:
$5,689
State:
$4,753
Here:
4.3% of AGI
State:
4.2% of AGI
(% of AGI for various income ranges: 1.4% for AGIs below $10k, 1.5% for AGIs $10k-25k, 2.0% for AGIs $25k-50k, 2.6% for AGIs $50k-75k, 3.1% for AGIs $75k-100k, 2.5% for AGIs over 100k)
Total tax: $15,537 (reported on 77.9% of returns)
77706:
$15,537
State:
$9,058
(% of AGI for various income ranges: 3.8% for AGIs below $10k, 4.0% for AGIs $10k-25k, 7.4% for AGIs $25k-50k, 9.9% for AGIs $50k-75k, 11.3% for AGIs $75k-100k, 22.1% for AGIs over 100k)
Earned income credit: $1,784 (reported on 11.5% of returns)
Here:
$1,784
State:
$2,024
Percentage of individuals using paid preparers for their 2004 taxes: 55.4%
Here:
55%
State:
57%
(% for various income ranges: 50.9% for AGIs below $10k, 57.0% for AGIs $10k-25k, 53.4% for AGIs $25k-50k, 51.3% for AGIs $50k-75k, 54.1% for AGIs $75k-100k, 65.2% for AGIs over 100k)
Likely homosexual households (counted as self-reported same-sex unmarried-partner households)
Lesbian couples: 0.3% of all households
Gay men: 0.0% of all households
Household received Food Stamps/SNAP in the past 12 months: 1,234 Household did not receive Food Stamps/SNAP in the past 12 months: 12,784
Women who had a birth in the past 12 months: 455 (366 now married, 92 unmarried) Women who did not have a birth in the past 12 months: 6,458 (2,462 now married, 4,007 unmarried)
Housing units in zip code 77706 with a mortgage: 4,550 (156 second mortgage, 5 home equity loan, 100 both second mortgage and home equity loan) Houses without a mortgage: 182
Median monthly owner costs for units with a mortgage: $2,009 Median monthly owner costs for units without a mortgage: $753
Residents with income below the poverty level in 2022:
This zip code:
10.8%
Whole state:
14.0%
Residents with income below 50% of the poverty level in 2022:
This zip code:
5.0%
Whole state:
7.4%
Median number of rooms in houses and condos:
Here:
7.0
State:
6.3
Median number of rooms in apartments:
Here:
3.7
State:
4.0
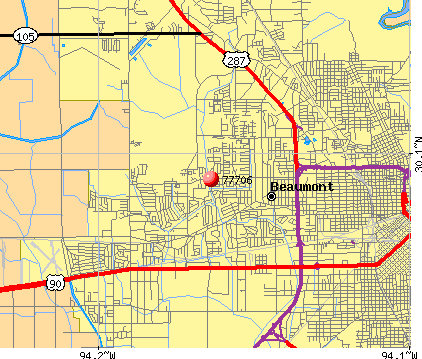
Notable locations in this zip code not listed on our city pages
Notable locations in zip code 77706: Oaks Country Club (A), French Home Trading Post (B), Miller Library (C), Beaumont Fire and Rescue Station 9 (D), Beaumont Fire and Rescue Station 4 (E), Beaumont Fire and Rescue Station 8 (F), John French Museum (G), John Jay French Historic House Museum (H). Display/hide their locations on the map
Churches in zip code 77706 include: Saint Andrews Church (A), Trinity Church (B), Saint Jude Church (C), Parkdale Church (D), Redeemer Church (E), North End Church (F), Westwood Church (G), Woodland Church (H), Dawndale Church (I). Display/hide their locations on the map
Parks in zip code 77706 include: Forest Park (1), Durley Stadium (2), Rogers Park (3), Wuthering Heights Park (4), Durley Stadium (5), Westbrook Senior High School Baseball Fields (6). Display/hide their locations on the map
In group quarters: 270 (-1 institutionalized population)
Size of family households: 4,593 2-persons, 1,985 3-persons, 1,091 4-persons, 617 5-persons, 206 6-persons, 25 7-or-more-persons
Size of nonfamily households: 5,082 1-person, 520 2-persons, 6 3-persons
3,961 married couples with children.
2,277 single-parent households (99 men, 2,178 women).
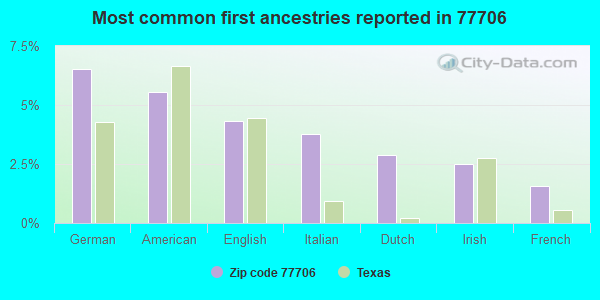
88.8% of residents of 77706 zip code speak English at home.
6.4% of residents speak Spanish at home (70% very well, 17% well, 14% not well).
3.1% of residents speak other Indo-European language at home (73% very well, 16% well, 11% not well).
1.5% of residents speak Asian or Pacific Island language at home (77% very well, 20% well, 1% not well, 1% not at all).
0.5% of residents speak other language at home (79% very well, 14% well, 7% not well).
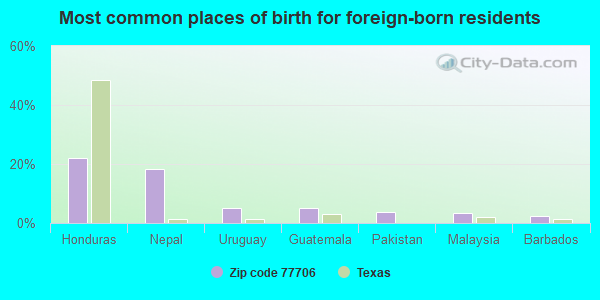
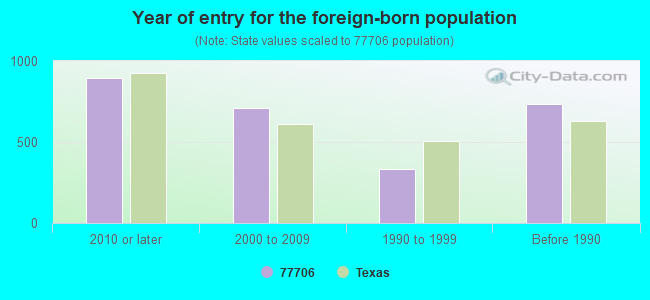
Foreign born population: 2,392 (7.8%) (56.6% of them are naturalized citizens)
Facilities with environmental interests located in this zip code:
AUSTIN MIDDLE (3410 AUSTIN ST in BEAUMONT, TX)
(National Center for Education Statistics) - STATE ID-123910041 Organizations: BEAUMONT ISD (SCHOOL DISTRICT)
ANT FIRE INC (5000 BELMONT in BEAUMONT, TX)
(Integrated Compliance Information System) - ICIS-06-1988-0410, FORMAL ENFORCEMENT ACTION
A B DICK COMPANY (4785 EASTEX FREEWAY in BEAUMONT, TX)
(Resource Conservation and Recovery Act (tracking hazardous waste)) Alternative names: AB DICK CO
ACC ENTERPRISE (3990 W LUCAS in BEAUMONT, TX)
Conditionally Exempt Small Quantity Generators, less than 100 kg/month of hazardous waste (Resource Conservation and Recovery Act (tracking hazardous waste)) - notification Organizations: JIM PETERSON (CONTACT/OWNER)
Housing units lacking complete plumbing facilities: 0.9% Housing units lacking complete kitchen facilities: 1.2%
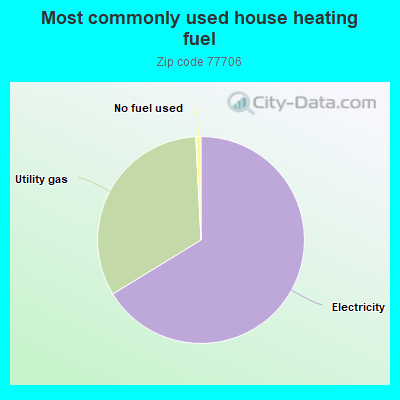
65.8%Electricity
32.7%Utility gas
0.8%No fuel used
Population in 1990: 25,388. Population change in the 1990s: +971 (+3.8%).
Place of birth for U.S.-born residents:
This state: 20,624
Northeast: 777
Midwest: 1,184
South: 3,866
West: 1,243
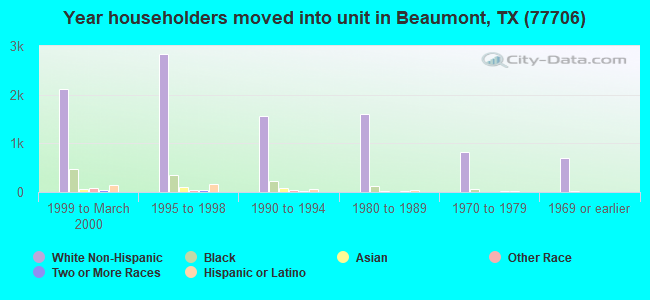
50% of the 77706 zip code residents lived in the same house 5 years ago. Out of people who lived in different houses, 53% lived in this county. Out of people who lived in different counties, 50% lived in Texas.
88% of the 77706 zip code residents lived in the same house 1 year ago. Out of people who lived in different houses, 59% moved from this county. Out of people who lived in different houses, 22% moved from different county within same state. Out of people who lived in different houses, 18% moved from different state.
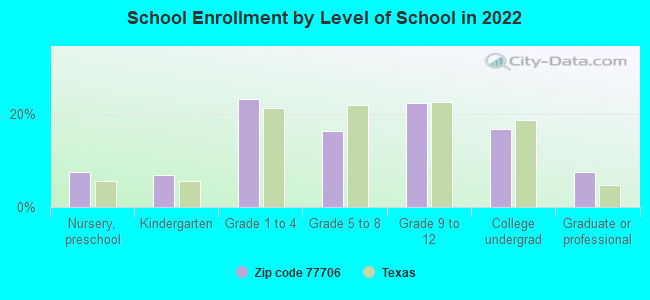
Private vs. public school enrollment:
Students in private schools in grades 1 to 8 (elementary and middle school): 878
Here:
31.6%
Texas:
8.8%
Students in private schools in grades 9 to 12 (high school): 121
Here:
7.9%
Texas:
8.0%
Students in private undergraduate colleges: 124
Here:
10.9%
Texas:
16.2%
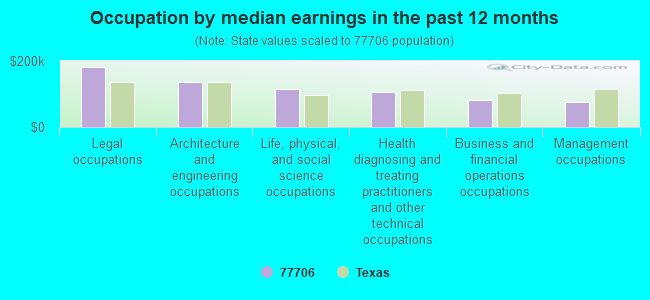
Occupation by median earnings in the past 12 months ($)
182,400Legal occupations
137,806Architecture and engineering occupations
114,373Life, physical, and social science occupations
107,417Health diagnosing and treating practitioners and other technical occupations
82,029Business and financial operations occupations
76,192Management occupations
Companies with federal contracts located in this zip code (BEAUMONT, TX):
STAR GRAPHICS COPIERS INC (4785 EASTEX FREEWAY; small business) : $57,078 in 56 contractsfrom 2001 to 2005
Contracts for Lease or Rental of Equipment -- Special Industry Machinery, Other ADP and Telecommunications Services (includes data storage on tapes, compact disks, etc.), Printing, Duplicating, and Bookbinding Equipment, Miscellaneous Office Machines, and moreby Army Signed by year:2000: $0; 2001: $6,605; 2002: $9,453; 2003: $21,926; 2004: $17,514; 2005: $1,580; 2006: $0.
Biggest contracts:
$11,520 with Army for Lease or Rental of Equipment -- Special Industry Machinery. Signed on 2003-03-03. Completion date: 2003-09-02.
$5,550 with Army for Other ADP and Telecommunications Services (includes data storage on tapes, compact disks, etc.). Taking place in LA. Signed on 2004-07-27. Completion date: 2004-09-30.
$5,448 with Army for Printing, Duplicating, and Bookbinding Equipment. Taking place in LA. Signed on 2004-08-27. Completion date: 2004-11-12.
$3,610 with Army for Miscellaneous Office Machines. Taking place in LA. Signed on 2003-05-12. Completion date: 2003-06-03.
Contracts for Telephone and Telegraph Equipment by Army Signed by year:2000: $0; 2001: $0; 2002: $0; 2003: $0; 2004: $46,324; 2005: $0; 2006: $0.
Biggest contracts:
$22,570 with Army for Telephone and Telegraph Equipment. Taking place in LA. Signed on 2004-08-27. Completion date: 2004-08-27.
$12,459, same as above.Signed on 2004-08-05. Completion date: 2004-09-03.
$8,000, same as above.Signed on 2004-11-30. Completion date: 2004-10-01.
$4,035, same as above.Signed on 2004-08-27. Completion date: 2004-08-27.
STAR GRAPHICS INC (4785 EASTEX FWY; small business) : $20,339 in 16 contractsfrom 2002 to 2005
Contracts for Printing, Duplicating, and Bookbinding Equipment, Lease or Rental of Equipment -- Office Machines, Text Processing Systems and Visible Record Equipment, Wrapping and Packaging Machinery, Lease or Rental of Equipment -- Office Supplies and Devices, and moreby Army Signed by year:2000: $0; 2001: $0; 2002: -$4,318; 2003: $3,046; 2004: $1,497; 2005: $20,114; 2006: $0.
Biggest contracts:
$14,811 with Army for Printing, Duplicating, and Bookbinding Equipment. Signed on 2005-08-04. Completion date: 2005-08-25.
$4,900 with Army for Lease or Rental of Equipment -- Office Machines, Text Processing Systems and Visible Record Equipment. Taking place in LA. Signed on 2005-06-02. Completion date: 2005-06-02.
$3,495 with Army for Printing, Duplicating, and Bookbinding Equipment. Signed on 2004-05-07. Completion date: 2000-09-30.
$3,046 with Army for Wrapping and Packaging Machinery. Signed on 2003-08-13. Completion date: 2003-08-29.
SHIELD FITNESS (229 DOWLEN RD; small business) : $17,996 in 7 contractsfrom 2003 to 2006
Contracts for Tuition, Registration, and Membership Fees by Army Signed by year:2000: $0; 2001: $0; 2002: $0; 2003: $8,998; 2004: $4,499; 2005: $0; 2006: $4,499.
Biggest contracts:
$4,499 with Army for Tuition, Registration, and Membership Fees. Signed on 2006-01-26. Completion date: 2006-12-31.
$4,499, same as above.Signed on 2004-12-15. Completion date: 2006-12-31.
$4,499, same as above.Signed on 2003-12-15. Completion date: 2004-12-31.
$4,499, same as above.Signed on 2003-06-20. Completion date: 2004-12-31.
STEWART TITLE CO (2390 N DOWLEN RD) : $3,506 in 7 contractsfrom 2004 to 2006
Contracts for Real Property Appraisals Services (SIC 6531), Other Professional Services by U.S. Army Corps of Engineers - civil program financing only, Army Signed by year:2000: $0; 2001: $0; 2002: $0; 2003: $0; 2004: $4,240; 2005: -$1,208; 2006: $474.
Biggest contracts:
$1,612 with U.S. Army Corps of Engineers - civil program financing only for Real Property Appraisals Services (SIC 6531). Signed on 2004-07-28. Completion date: 2005-07-27.
$1,612 with Army for Real Property Appraisals Services (SIC 6531). Signed on 2004-07-28. Completion date: 2005-07-27.
$508 with U.S. Army Corps of Engineers - civil program financing only for Other Professional Services. Signed on 2004-12-08. Completion date: 2005-08-25.
$508 with Army for Other Professional Services. Signed on 2004-12-08. Completion date: 2005-08-25.
RED B 4 BOOKS (4495 CALDER STREET; small business)
$201 with Bureau of Prisoners/Federal Prison System for . Signed on 2006-03-22. Completion date: 2006-04-05.
Top industries in this zip code by the number of employees in 2005:
2002 - 2018 National Fire Incident Reporting System (NFIRS) incidents
Based on the data from the years 2002 - 2018 the average number of fires per year is 77. The highest number of reported fire incidents - 102 took place in 2005, and the least - 59 in 2002. The data has a growing trend.
When looking into fire subcategories, the most incidents belonged to: Structure Fires (45.3%), and Outside Fires (33.5%).
Fire incident types reported to NFIRS in Zip Code 77706


 Nearest zip codes: 77708, 77702, 77707, 77703, 77701, 77713.


 Based on the data from the years 2002 - 2018 the average number of fires per year is 77. The highest number of reported fire incidents - 102 took place in 2005, and the least - 59 in 2002. The data has a growing trend.
 When looking into fire subcategories, the most incidents belonged to: Structure Fires (45.3%), and Outside Fires (33.5%).