Estimated zip code population in 2022: 12,018
Zip code population in 2010: 15,006
Zip code population in 2000: 15,851
Houses and condos: 5,539
Renter-occupied apartments: 2,445
% of renters here:
53%State:
38%
March 2022 cost of living index in zip code 77703: 82.4
(low, U.S. average is 100)
Land area: 13.2
sq. mi.
Water area: 0.8
sq. mi.
Population density: 908 people per square mile (low).
OSM Map
General Map
Google Map
MSN Map
OSM Map
General Map
Google Map
MSN Map
OSM Map
General Map
Google Map
MSN Map
OSM Map
General Map
Google Map
MSN Map
Please wait while loading the map...
Real estate property taxes paid for housing units in 2022:
This zip code:
0.9% ($878)Texas:
1.5% ($4,050)
Median real estate property taxes paid for housing units with mortgages in 2022: $1,781 (1.4%)
Median real estate property taxes paid for housing units with no mortgage in 2022: $710 (0.7%)
Business Search - 14 Million verified businesses
Males: 6,276 Females: 5,742
For population 25 years and over in 77703:
High school or higher: 75.8%Bachelor's degree or higher: 7.8%Graduate or professional degree: 2.9%Unemployed: 5.9%Mean travel time to work (commute): 21.5 minutes
For population 15 years and over in 77703:
Never married: 46.5%Now married: 35.3%Separated: 1.5%Widowed: 4.9%Divorced: 11.8%
Zip code 77703 compared to state average:
Median household income significantly below state average. Median house value significantly below state average. Black race population percentage significantly above state average. Length of stay since moving in significantly above state average. Percentage of population with a bachelor's degree or higher significantly below state average. 7,634 63.5% Black 3,353 27.9% Hispanic or Latino 651 5.4% White 342 2.8% Two or more races 27 0.2% Asian 8 0.07% American Indian
Data:
Median household income ($)
Median household income (% change since 2000)
Household income diversity
Ratio of average income to average house value (%)
Ratio of average income to average rent
Median household income ($) - White
Median household income ($) - Black or African American
Median household income ($) - Asian
Median household income ($) - Hispanic or Latino
Median household income ($) - American Indian and Alaska Native
Median household income ($) - Multirace
Median household income ($) - Other Race
Median household income for houses/condos with a mortgage ($)
Median household income for apartments without a mortgage ($)
Races - White alone (%)
Races - White alone (% change since 2000)
Races - Black alone (%)
Races - Black alone (% change since 2000)
Races - American Indian alone (%)
Races - American Indian alone (% change since 2000)
Races - Asian alone (%)
Races - Asian alone (% change since 2000)
Races - Hispanic (%)
Races - Hispanic (% change since 2000)
Races - Native Hawaiian and Other Pacific Islander alone (%)
Races - Native Hawaiian and Other Pacific Islander alone (% change since 2000)
Races - Two or more races (%)
Races - Two or more races (% change since 2000)
Races - Other race alone (%)
Races - Other race alone (% change since 2000)
Racial diversity
Unemployment (%)
Unemployment (% change since 2000)
Unemployment (%) - White
Unemployment (%) - Black or African American
Unemployment (%) - Asian
Unemployment (%) - Hispanic or Latino
Unemployment (%) - American Indian and Alaska Native
Unemployment (%) - Multirace
Unemployment (%) - Other Race
Population density (people per square mile)
Population - Males (%)
Population - Females (%)
Population - Males (%) - White
Population - Males (%) - Black or African American
Population - Males (%) - Asian
Population - Males (%) - Hispanic or Latino
Population - Males (%) - American Indian and Alaska Native
Population - Males (%) - Multirace
Population - Males (%) - Other Race
Population - Females (%) - White
Population - Females (%) - Black or African American
Population - Females (%) - Asian
Population - Females (%) - Hispanic or Latino
Population - Females (%) - American Indian and Alaska Native
Population - Females (%) - Multirace
Population - Females (%) - Other Race
Coronavirus confirmed cases (Apr 27, 2024)
Deaths caused by coronavirus (Apr 27, 2024)
Coronavirus confirmed cases (per 100k population) (Apr 27, 2024)
Deaths caused by coronavirus (per 100k population) (Apr 27, 2024)
Daily increase in number of cases (Apr 27, 2024)
Weekly increase in number of cases (Apr 27, 2024)
Cases doubled (in days) (Apr 27, 2024)
Hospitalized patients (Apr 18, 2022)
Negative test results (Apr 18, 2022)
Total test results (Apr 18, 2022)
COVID Vaccine doses distributed (per 100k population) (Sep 19, 2023)
COVID Vaccine doses administered (per 100k population) (Sep 19, 2023)
COVID Vaccine doses distributed (Sep 19, 2023)
COVID Vaccine doses administered (Sep 19, 2023)
Likely homosexual households (%)
Likely homosexual households (% change since 2000)
Likely homosexual households - Lesbian couples (%)
Likely homosexual households - Lesbian couples (% change since 2000)
Likely homosexual households - Gay men (%)
Likely homosexual households - Gay men (% change since 2000)
Cost of living index
Median gross rent ($)
Median contract rent ($)
Median monthly housing costs ($)
Median house or condo value ($)
Median house or condo value ($ change since 2000)
Mean house or condo value by units in structure - 1, detached ($)
Mean house or condo value by units in structure - 1, attached ($)
Mean house or condo value by units in structure - 2 ($)
Mean house or condo value by units in structure by units in structure - 3 or 4 ($)
Mean house or condo value by units in structure - 5 or more ($)
Mean house or condo value by units in structure - Boat, RV, van, etc. ($)
Mean house or condo value by units in structure - Mobile home ($)
Median house or condo value ($) - White
Median house or condo value ($) - Black or African American
Median house or condo value ($) - Asian
Median house or condo value ($) - Hispanic or Latino
Median house or condo value ($) - American Indian and Alaska Native
Median house or condo value ($) - Multirace
Median house or condo value ($) - Other Race
Median resident age
Resident age diversity
Median resident age - Males
Median resident age - Females
Median resident age - White
Median resident age - Black or African American
Median resident age - Asian
Median resident age - Hispanic or Latino
Median resident age - American Indian and Alaska Native
Median resident age - Multirace
Median resident age - Other Race
Median resident age - Males - White
Median resident age - Males - Black or African American
Median resident age - Males - Asian
Median resident age - Males - Hispanic or Latino
Median resident age - Males - American Indian and Alaska Native
Median resident age - Males - Multirace
Median resident age - Males - Other Race
Median resident age - Females - White
Median resident age - Females - Black or African American
Median resident age - Females - Asian
Median resident age - Females - Hispanic or Latino
Median resident age - Females - American Indian and Alaska Native
Median resident age - Females - Multirace
Median resident age - Females - Other Race
Commute - mean travel time to work (minutes)
Travel time to work - Less than 5 minutes (%)
Travel time to work - Less than 5 minutes (% change since 2000)
Travel time to work - 5 to 9 minutes (%)
Travel time to work - 5 to 9 minutes (% change since 2000)
Travel time to work - 10 to 19 minutes (%)
Travel time to work - 10 to 19 minutes (% change since 2000)
Travel time to work - 20 to 29 minutes (%)
Travel time to work - 20 to 29 minutes (% change since 2000)
Travel time to work - 30 to 39 minutes (%)
Travel time to work - 30 to 39 minutes (% change since 2000)
Travel time to work - 40 to 59 minutes (%)
Travel time to work - 40 to 59 minutes (% change since 2000)
Travel time to work - 60 to 89 minutes (%)
Travel time to work - 60 to 89 minutes (% change since 2000)
Travel time to work - 90 or more minutes (%)
Travel time to work - 90 or more minutes (% change since 2000)
Marital status - Never married (%)
Marital status - Now married (%)
Marital status - Separated (%)
Marital status - Widowed (%)
Marital status - Divorced (%)
Median family income ($)
Median family income (% change since 2000)
Median non-family income ($)
Median non-family income (% change since 2000)
Median per capita income ($)
Median per capita income (% change since 2000)
Median family income ($) - White
Median family income ($) - Black or African American
Median family income ($) - Asian
Median family income ($) - Hispanic or Latino
Median family income ($) - American Indian and Alaska Native
Median family income ($) - Multirace
Median family income ($) - Other Race
Median year house/condo built
Median year apartment built
Year house built - Built 2005 or later (%)
Year house built - Built 2000 to 2004 (%)
Year house built - Built 1990 to 1999 (%)
Year house built - Built 1980 to 1989 (%)
Year house built - Built 1970 to 1979 (%)
Year house built - Built 1960 to 1969 (%)
Year house built - Built 1950 to 1959 (%)
Year house built - Built 1940 to 1949 (%)
Year house built - Built 1939 or earlier (%)
Average household size
Household density (households per square mile)
Average household size - White
Average household size - Black or African American
Average household size - Asian
Average household size - Hispanic or Latino
Average household size - American Indian and Alaska Native
Average household size - Multirace
Average household size - Other Race
Occupied housing units (%)
Vacant housing units (%)
Owner occupied housing units (%)
Renter occupied housing units (%)
Vacancy status - For rent (%)
Vacancy status - For sale only (%)
Vacancy status - Rented or sold, not occupied (%)
Vacancy status - For seasonal, recreational, or occasional use (%)
Vacancy status - For migrant workers (%)
Vacancy status - Other vacant (%)
Residents with income below the poverty level (%)
Residents with income below 50% of the poverty level (%)
Children below poverty level (%)
Poor families by family type - Married-couple family (%)
Poor families by family type - Male, no wife present (%)
Poor families by family type - Female, no husband present (%)
Poverty status for native-born residents (%)
Poverty status for foreign-born residents (%)
Poverty among high school graduates not in families (%)
Poverty among people who did not graduate high school not in families (%)
Residents with income below the poverty level (%) - White
Residents with income below the poverty level (%) - Black or African American
Residents with income below the poverty level (%) - Asian
Residents with income below the poverty level (%) - Hispanic or Latino
Residents with income below the poverty level (%) - American Indian and Alaska Native
Residents with income below the poverty level (%) - Multirace
Residents with income below the poverty level (%) - Other Race
Air pollution - Air Quality Index (AQI)
Air pollution - CO
Air pollution - NO2
Air pollution - SO2
Air pollution - Ozone
Air pollution - PM10
Air pollution - PM25
Air pollution - Pb
Crime - Murders per 100,000 population
Crime - Rapes per 100,000 population
Crime - Robberies per 100,000 population
Crime - Assaults per 100,000 population
Crime - Burglaries per 100,000 population
Crime - Thefts per 100,000 population
Crime - Auto thefts per 100,000 population
Crime - Arson per 100,000 population
Crime - City-data.com crime index
Crime - Violent crime index
Crime - Property crime index
Crime - Murders per 100,000 population (5 year average)
Crime - Rapes per 100,000 population (5 year average)
Crime - Robberies per 100,000 population (5 year average)
Crime - Assaults per 100,000 population (5 year average)
Crime - Burglaries per 100,000 population (5 year average)
Crime - Thefts per 100,000 population (5 year average)
Crime - Auto thefts per 100,000 population (5 year average)
Crime - Arson per 100,000 population (5 year average)
Crime - City-data.com crime index (5 year average)
Crime - Violent crime index (5 year average)
Crime - Property crime index (5 year average)
1996 Presidential Elections Results (%) - Democratic Party (Clinton)
1996 Presidential Elections Results (%) - Republican Party (Dole)
1996 Presidential Elections Results (%) - Other
2000 Presidential Elections Results (%) - Democratic Party (Gore)
2000 Presidential Elections Results (%) - Republican Party (Bush)
2000 Presidential Elections Results (%) - Other
2004 Presidential Elections Results (%) - Democratic Party (Kerry)
2004 Presidential Elections Results (%) - Republican Party (Bush)
2004 Presidential Elections Results (%) - Other
2008 Presidential Elections Results (%) - Democratic Party (Obama)
2008 Presidential Elections Results (%) - Republican Party (McCain)
2008 Presidential Elections Results (%) - Other
2012 Presidential Elections Results (%) - Democratic Party (Obama)
2012 Presidential Elections Results (%) - Republican Party (Romney)
2012 Presidential Elections Results (%) - Other
2016 Presidential Elections Results (%) - Democratic Party (Clinton)
2016 Presidential Elections Results (%) - Republican Party (Trump)
2016 Presidential Elections Results (%) - Other
2020 Presidential Elections Results (%) - Democratic Party (Biden)
2020 Presidential Elections Results (%) - Republican Party (Trump)
2020 Presidential Elections Results (%) - Other
Ancestries Reported - Arab (%)
Ancestries Reported - Czech (%)
Ancestries Reported - Danish (%)
Ancestries Reported - Dutch (%)
Ancestries Reported - English (%)
Ancestries Reported - French (%)
Ancestries Reported - French Canadian (%)
Ancestries Reported - German (%)
Ancestries Reported - Greek (%)
Ancestries Reported - Hungarian (%)
Ancestries Reported - Irish (%)
Ancestries Reported - Italian (%)
Ancestries Reported - Lithuanian (%)
Ancestries Reported - Norwegian (%)
Ancestries Reported - Polish (%)
Ancestries Reported - Portuguese (%)
Ancestries Reported - Russian (%)
Ancestries Reported - Scotch-Irish (%)
Ancestries Reported - Scottish (%)
Ancestries Reported - Slovak (%)
Ancestries Reported - Subsaharan African (%)
Ancestries Reported - Swedish (%)
Ancestries Reported - Swiss (%)
Ancestries Reported - Ukrainian (%)
Ancestries Reported - United States (%)
Ancestries Reported - Welsh (%)
Ancestries Reported - West Indian (%)
Ancestries Reported - Other (%)
Educational Attainment - No schooling completed (%)
Educational Attainment - Less than high school (%)
Educational Attainment - High school or equivalent (%)
Educational Attainment - Less than 1 year of college (%)
Educational Attainment - 1 or more years of college (%)
Educational Attainment - Associate degree (%)
Educational Attainment - Bachelor's degree (%)
Educational Attainment - Master's degree (%)
Educational Attainment - Professional school degree (%)
Educational Attainment - Doctorate degree (%)
School Enrollment - Nursery, preschool (%)
School Enrollment - Kindergarten (%)
School Enrollment - Grade 1 to 4 (%)
School Enrollment - Grade 5 to 8 (%)
School Enrollment - Grade 9 to 12 (%)
School Enrollment - College undergrad (%)
School Enrollment - Graduate or professional (%)
School Enrollment - Not enrolled in school (%)
School enrollment - Public schools (%)
School enrollment - Private schools (%)
School enrollment - Not enrolled (%)
Median number of rooms in houses and condos
Median number of rooms in apartments
Housing units lacking complete plumbing facilities (%)
Housing units lacking complete kitchen facilities (%)
Density of houses
Urban houses (%)
Rural houses (%)
Households with people 60 years and over (%)
Households with people 65 years and over (%)
Households with people 75 years and over (%)
Households with one or more nonrelatives (%)
Households with no nonrelatives (%)
Population in households (%)
Family households (%)
Nonfamily households (%)
Population in families (%)
Family households with own children (%)
Median number of bedrooms in owner occupied houses
Mean number of bedrooms in owner occupied houses
Median number of bedrooms in renter occupied houses
Mean number of bedrooms in renter occupied houses
Median number of vehichles in owner occupied houses
Mean number of vehichles in owner occupied houses
Median number of vehichles in renter occupied houses
Mean number of vehichles in renter occupied houses
Mortgage status - with mortgage (%)
Mortgage status - with second mortgage (%)
Mortgage status - with home equity loan (%)
Mortgage status - with both second mortgage and home equity loan (%)
Mortgage status - without a mortgage (%)
Average family size
Average family size - White
Average family size - Black or African American
Average family size - Asian
Average family size - Hispanic or Latino
Average family size - American Indian and Alaska Native
Average family size - Multirace
Average family size - Other Race
Geographical mobility - Same house 1 year ago (%)
Geographical mobility - Moved within same county (%)
Geographical mobility - Moved from different county within same state (%)
Geographical mobility - Moved from different state (%)
Geographical mobility - Moved from abroad (%)
Place of birth - Born in state of residence (%)
Place of birth - Born in other state (%)
Place of birth - Native, outside of US (%)
Place of birth - Foreign born (%)
Housing units in structures - 1, detached (%)
Housing units in structures - 1, attached (%)
Housing units in structures - 2 (%)
Housing units in structures - 3 or 4 (%)
Housing units in structures - 5 to 9 (%)
Housing units in structures - 10 to 19 (%)
Housing units in structures - 20 to 49 (%)
Housing units in structures - 50 or more (%)
Housing units in structures - Mobile home (%)
Housing units in structures - Boat, RV, van, etc. (%)
House/condo owner moved in on average (years ago)
Renter moved in on average (years ago)
Year householder moved into unit - Moved in 1999 to March 2000 (%)
Year householder moved into unit - Moved in 1995 to 1998 (%)
Year householder moved into unit - Moved in 1990 to 1994 (%)
Year householder moved into unit - Moved in 1980 to 1989 (%)
Year householder moved into unit - Moved in 1970 to 1979 (%)
Year householder moved into unit - Moved in 1969 or earlier (%)
Means of transportation to work - Drove car alone (%)
Means of transportation to work - Carpooled (%)
Means of transportation to work - Public transportation (%)
Means of transportation to work - Bus or trolley bus (%)
Means of transportation to work - Streetcar or trolley car (%)
Means of transportation to work - Subway or elevated (%)
Means of transportation to work - Railroad (%)
Means of transportation to work - Ferryboat (%)
Means of transportation to work - Taxicab (%)
Means of transportation to work - Motorcycle (%)
Means of transportation to work - Bicycle (%)
Means of transportation to work - Walked (%)
Means of transportation to work - Other means (%)
Working at home (%)
Industry diversity
Most Common Industries - Agriculture, forestry, fishing and hunting, and mining (%)
Most Common Industries - Agriculture, forestry, fishing and hunting (%)
Most Common Industries - Mining, quarrying, and oil and gas extraction (%)
Most Common Industries - Construction (%)
Most Common Industries - Manufacturing (%)
Most Common Industries - Wholesale trade (%)
Most Common Industries - Retail trade (%)
Most Common Industries - Transportation and warehousing, and utilities (%)
Most Common Industries - Transportation and warehousing (%)
Most Common Industries - Utilities (%)
Most Common Industries - Information (%)
Most Common Industries - Finance and insurance, and real estate and rental and leasing (%)
Most Common Industries - Finance and insurance (%)
Most Common Industries - Real estate and rental and leasing (%)
Most Common Industries - Professional, scientific, and management, and administrative and waste management services (%)
Most Common Industries - Professional, scientific, and technical services (%)
Most Common Industries - Management of companies and enterprises (%)
Most Common Industries - Administrative and support and waste management services (%)
Most Common Industries - Educational services, and health care and social assistance (%)
Most Common Industries - Educational services (%)
Most Common Industries - Health care and social assistance (%)
Most Common Industries - Arts, entertainment, and recreation, and accommodation and food services (%)
Most Common Industries - Arts, entertainment, and recreation (%)
Most Common Industries - Accommodation and food services (%)
Most Common Industries - Other services, except public administration (%)
Most Common Industries - Public administration (%)
Occupation diversity
Most Common Occupations - Management, business, science, and arts occupations (%)
Most Common Occupations - Management, business, and financial occupations (%)
Most Common Occupations - Management occupations (%)
Most Common Occupations - Business and financial operations occupations (%)
Most Common Occupations - Computer, engineering, and science occupations (%)
Most Common Occupations - Computer and mathematical occupations (%)
Most Common Occupations - Architecture and engineering occupations (%)
Most Common Occupations - Life, physical, and social science occupations (%)
Most Common Occupations - Education, legal, community service, arts, and media occupations (%)
Most Common Occupations - Community and social service occupations (%)
Most Common Occupations - Legal occupations (%)
Most Common Occupations - Education, training, and library occupations (%)
Most Common Occupations - Arts, design, entertainment, sports, and media occupations (%)
Most Common Occupations - Healthcare practitioners and technical occupations (%)
Most Common Occupations - Health diagnosing and treating practitioners and other technical occupations (%)
Most Common Occupations - Health technologists and technicians (%)
Most Common Occupations - Service occupations (%)
Most Common Occupations - Healthcare support occupations (%)
Most Common Occupations - Protective service occupations (%)
Most Common Occupations - Fire fighting and prevention, and other protective service workers including supervisors (%)
Most Common Occupations - Law enforcement workers including supervisors (%)
Most Common Occupations - Food preparation and serving related occupations (%)
Most Common Occupations - Building and grounds cleaning and maintenance occupations (%)
Most Common Occupations - Personal care and service occupations (%)
Most Common Occupations - Sales and office occupations (%)
Most Common Occupations - Sales and related occupations (%)
Most Common Occupations - Office and administrative support occupations (%)
Most Common Occupations - Natural resources, construction, and maintenance occupations (%)
Most Common Occupations - Farming, fishing, and forestry occupations (%)
Most Common Occupations - Construction and extraction occupations (%)
Most Common Occupations - Installation, maintenance, and repair occupations (%)
Most Common Occupations - Production, transportation, and material moving occupations (%)
Most Common Occupations - Production occupations (%)
Most Common Occupations - Transportation occupations (%)
Most Common Occupations - Material moving occupations (%)
People in Group quarters - Institutionalized population (%)
People in Group quarters - Correctional institutions (%)
People in Group quarters - Federal prisons and detention centers (%)
People in Group quarters - Halfway houses (%)
People in Group quarters - Local jails and other confinement facilities (including police lockups) (%)
People in Group quarters - Military disciplinary barracks (%)
People in Group quarters - State prisons (%)
People in Group quarters - Other types of correctional institutions (%)
People in Group quarters - Nursing homes (%)
People in Group quarters - Hospitals/wards, hospices, and schools for the handicapped (%)
People in Group quarters - Hospitals/wards and hospices for chronically ill (%)
People in Group quarters - Hospices or homes for chronically ill (%)
People in Group quarters - Military hospitals or wards for chronically ill (%)
People in Group quarters - Other hospitals or wards for chronically ill (%)
People in Group quarters - Hospitals or wards for drug/alcohol abuse (%)
People in Group quarters - Mental (Psychiatric) hospitals or wards (%)
People in Group quarters - Schools, hospitals, or wards for the mentally retarded (%)
People in Group quarters - Schools, hospitals, or wards for the physically handicapped (%)
People in Group quarters - Institutions for the deaf (%)
People in Group quarters - Institutions for the blind (%)
People in Group quarters - Orthopedic wards and institutions for the physically handicapped (%)
People in Group quarters - Wards in general hospitals for patients who have no usual home elsewhere (%)
People in Group quarters - Wards in military hospitals for patients who have no usual home elsewhere (%)
People in Group quarters - Juvenile institutions (%)
People in Group quarters - Long-term care (%)
People in Group quarters - Homes for abused, dependent, and neglected children (%)
People in Group quarters - Residential treatment centers for emotionally disturbed children (%)
People in Group quarters - Training schools for juvenile delinquents (%)
People in Group quarters - Short-term care, detention or diagnostic centers for delinquent children (%)
People in Group quarters - Type of juvenile institution unknown (%)
People in Group quarters - Noninstitutionalized population (%)
People in Group quarters - College dormitories (includes college quarters off campus) (%)
People in Group quarters - Military quarters (%)
People in Group quarters - On base (%)
People in Group quarters - Barracks, unaccompanied personnel housing (UPH), (Enlisted/Officer), ;and similar group living quarters for military personnel (%)
People in Group quarters - Transient quarters for temporary residents (%)
People in Group quarters - Military ships (%)
People in Group quarters - Group homes (%)
People in Group quarters - Homes or halfway houses for drug/alcohol abuse (%)
People in Group quarters - Homes for the mentally ill (%)
People in Group quarters - Homes for the mentally retarded (%)
People in Group quarters - Homes for the physically handicapped (%)
People in Group quarters - Other group homes (%)
People in Group quarters - Religious group quarters (%)
People in Group quarters - Dormitories (%)
People in Group quarters - Agriculture workers' dormitories on farms (%)
People in Group quarters - Job Corps and vocational training facilities (%)
People in Group quarters - Other workers' dormitories (%)
People in Group quarters - Crews of maritime vessels (%)
People in Group quarters - Other nonhousehold living situations (%)
People in Group quarters - Other noninstitutional group quarters (%)
Residents speaking English at home (%)
Residents speaking English at home - Born in the United States (%)
Residents speaking English at home - Native, born elsewhere (%)
Residents speaking English at home - Foreign born (%)
Residents speaking Spanish at home (%)
Residents speaking Spanish at home - Born in the United States (%)
Residents speaking Spanish at home - Native, born elsewhere (%)
Residents speaking Spanish at home - Foreign born (%)
Residents speaking other language at home (%)
Residents speaking other language at home - Born in the United States (%)
Residents speaking other language at home - Native, born elsewhere (%)
Residents speaking other language at home - Foreign born (%)
Class of Workers - Employee of private company (%)
Class of Workers - Self-employed in own incorporated business (%)
Class of Workers - Private not-for-profit wage and salary workers (%)
Class of Workers - Local government workers (%)
Class of Workers - State government workers (%)
Class of Workers - Federal government workers (%)
Class of Workers - Self-employed workers in own not incorporated business and Unpaid family workers (%)
House heating fuel used in houses and condos - Utility gas (%)
House heating fuel used in houses and condos - Bottled, tank, or LP gas (%)
House heating fuel used in houses and condos - Electricity (%)
House heating fuel used in houses and condos - Fuel oil, kerosene, etc. (%)
House heating fuel used in houses and condos - Coal or coke (%)
House heating fuel used in houses and condos - Wood (%)
House heating fuel used in houses and condos - Solar energy (%)
House heating fuel used in houses and condos - Other fuel (%)
House heating fuel used in houses and condos - No fuel used (%)
House heating fuel used in apartments - Utility gas (%)
House heating fuel used in apartments - Bottled, tank, or LP gas (%)
House heating fuel used in apartments - Electricity (%)
House heating fuel used in apartments - Fuel oil, kerosene, etc. (%)
House heating fuel used in apartments - Coal or coke (%)
House heating fuel used in apartments - Wood (%)
House heating fuel used in apartments - Solar energy (%)
House heating fuel used in apartments - Other fuel (%)
House heating fuel used in apartments - No fuel used (%)
Armed forces status - In Armed Forces (%)
Armed forces status - Civilian (%)
Armed forces status - Civilian - Veteran (%)
Armed forces status - Civilian - Nonveteran (%)
Fatal accidents locations in years 2005-2021
Fatal accidents locations in 2005
Fatal accidents locations in 2006
Fatal accidents locations in 2007
Fatal accidents locations in 2008
Fatal accidents locations in 2009
Fatal accidents locations in 2010
Fatal accidents locations in 2011
Fatal accidents locations in 2012
Fatal accidents locations in 2013
Fatal accidents locations in 2014
Fatal accidents locations in 2015
Fatal accidents locations in 2016
Fatal accidents locations in 2017
Fatal accidents locations in 2018
Fatal accidents locations in 2019
Fatal accidents locations in 2020
Fatal accidents locations in 2021
Alcohol use - People drinking some alcohol every month (%)
Alcohol use - People not drinking at all (%)
Alcohol use - Average days/month drinking alcohol
Alcohol use - Average drinks/week
Alcohol use - Average days/year people drink much
Audiometry - Average condition of hearing (%)
Audiometry - People that can hear a whisper from across a quiet room (%)
Audiometry - People that can hear normal voice from across a quiet room (%)
Audiometry - Ears ringing, roaring, buzzing (%)
Audiometry - Had a job exposure to loud noise (%)
Audiometry - Had off-work exposure to loud noise (%)
Blood Pressure & Cholesterol - Has high blood pressure (%)
Blood Pressure & Cholesterol - Checking blood pressure at home (%)
Blood Pressure & Cholesterol - Frequently checking blood cholesterol (%)
Blood Pressure & Cholesterol - Has high cholesterol level (%)
Consumer Behavior - Money monthly spent on food at supermarket/grocery store
Consumer Behavior - Money monthly spent on food at other stores
Consumer Behavior - Money monthly spent on eating out
Consumer Behavior - Money monthly spent on carryout/delivered foods
Consumer Behavior - Income spent on food at supermarket/grocery store (%)
Consumer Behavior - Income spent on food at other stores (%)
Consumer Behavior - Income spent on eating out (%)
Consumer Behavior - Income spent on carryout/delivered foods (%)
Current Health Status - General health condition (%)
Current Health Status - Blood donors (%)
Current Health Status - Has blood ever tested for HIV virus (%)
Current Health Status - Left-handed people (%)
Dermatology - People using sunscreen (%)
Diabetes - Diabetics (%)
Diabetes - Had a blood test for high blood sugar (%)
Diabetes - People taking insulin (%)
Diet Behavior & Nutrition - Diet health (%)
Diet Behavior & Nutrition - Milk product consumption (# of products/month)
Diet Behavior & Nutrition - Meals not home prepared (#/week)
Diet Behavior & Nutrition - Meals from fast food or pizza place (#/week)
Diet Behavior & Nutrition - Ready-to-eat foods (#/month)
Diet Behavior & Nutrition - Frozen meals/pizza (#/month)
Drug Use - People that ever used marijuana or hashish (%)
Drug Use - Ever used hard drugs (%)
Drug Use - Ever used any form of cocaine (%)
Drug Use - Ever used heroin (%)
Drug Use - Ever used methamphetamine (%)
Health Insurance - People covered by health insurance (%)
Kidney Conditions-Urology - Avg. # of times urinating at night
Medical Conditions - People with asthma (%)
Medical Conditions - People with anemia (%)
Medical Conditions - People with psoriasis (%)
Medical Conditions - People with overweight (%)
Medical Conditions - Elderly people having difficulties in thinking or remembering (%)
Medical Conditions - People who ever received blood transfusion (%)
Medical Conditions - People having trouble seeing even with glass/contacts (%)
Medical Conditions - People with arthritis (%)
Medical Conditions - People with gout (%)
Medical Conditions - People with congestive heart failure (%)
Medical Conditions - People with coronary heart disease (%)
Medical Conditions - People with angina pectoris (%)
Medical Conditions - People who ever had heart attack (%)
Medical Conditions - People who ever had stroke (%)
Medical Conditions - People with emphysema (%)
Medical Conditions - People with thyroid problem (%)
Medical Conditions - People with chronic bronchitis (%)
Medical Conditions - People with any liver condition (%)
Medical Conditions - People who ever had cancer or malignancy (%)
Mental Health - People who have little interest in doing things (%)
Mental Health - People feeling down, depressed, or hopeless (%)
Mental Health - People who have trouble sleeping or sleeping too much (%)
Mental Health - People feeling tired or having little energy (%)
Mental Health - People with poor appetite or overeating (%)
Mental Health - People feeling bad about themself (%)
Mental Health - People who have trouble concentrating on things (%)
Mental Health - People moving or speaking slowly or too fast (%)
Mental Health - People having thoughts they would be better off dead (%)
Oral Health - Average years since last visit a dentist
Oral Health - People embarrassed because of mouth (%)
Oral Health - People with gum disease (%)
Oral Health - General health of teeth and gums (%)
Oral Health - Average days a week using dental floss/device
Oral Health - Average days a week using mouthwash for dental problem
Oral Health - Average number of teeth
Pesticide Use - Households using pesticides to control insects (%)
Pesticide Use - Households using pesticides to kill weeds (%)
Physical Activity - People doing vigorous-intensity work activities (%)
Physical Activity - People doing moderate-intensity work activities (%)
Physical Activity - People walking or bicycling (%)
Physical Activity - People doing vigorous-intensity recreational activities (%)
Physical Activity - People doing moderate-intensity recreational activities (%)
Physical Activity - Average hours a day doing sedentary activities
Physical Activity - Average hours a day watching TV or videos
Physical Activity - Average hours a day using computer
Physical Functioning - People having limitations keeping them from working (%)
Physical Functioning - People limited in amount of work they can do (%)
Physical Functioning - People that need special equipment to walk (%)
Physical Functioning - People experiencing confusion/memory problems (%)
Physical Functioning - People requiring special healthcare equipment (%)
Prescription Medications - Average number of prescription medicines taking
Preventive Aspirin Use - Adults 40+ taking low-dose aspirin (%)
Reproductive Health - Vaginal deliveries (%)
Reproductive Health - Cesarean deliveries (%)
Reproductive Health - Deliveries resulted in a live birth (%)
Reproductive Health - Pregnancies resulted in a delivery (%)
Reproductive Health - Women breastfeeding newborns (%)
Reproductive Health - Women that had a hysterectomy (%)
Reproductive Health - Women that had both ovaries removed (%)
Reproductive Health - Women that have ever taken birth control pills (%)
Reproductive Health - Women taking birth control pills (%)
Reproductive Health - Women that have ever used Depo-Provera or injectables (%)
Reproductive Health - Women that have ever used female hormones (%)
Sexual Behavior - People 18+ that ever had sex (vaginal, anal, or oral) (%)
Sexual Behavior - Males 18+ that ever had vaginal sex with a woman (%)
Sexual Behavior - Males 18+ that ever performed oral sex on a woman (%)
Sexual Behavior - Males 18+ that ever had anal sex with a woman (%)
Sexual Behavior - Males 18+ that ever had any sex with a man (%)
Sexual Behavior - Females 18+ that ever had vaginal sex with a man (%)
Sexual Behavior - Females 18+ that ever performed oral sex on a man (%)
Sexual Behavior - Females 18+ that ever had anal sex with a man (%)
Sexual Behavior - Females 18+ that ever had any kind of sex with a woman (%)
Sexual Behavior - Average age people first had sex
Sexual Behavior - Average number of female sex partners in lifetime (males 18+)
Sexual Behavior - Average number of female vaginal sex partners in lifetime (males 18+)
Sexual Behavior - Average age people first performed oral sex on a woman (18+)
Sexual Behavior - Average number of woman performed oral sex on in lifetime (18+)
Sexual Behavior - Average number of male sex partners in lifetime (males 18+)
Sexual Behavior - Average number of male anal sex partners in lifetime (males 18+)
Sexual Behavior - Average age people first performed oral sex on a man (18+)
Sexual Behavior - Average number of male oral sex partners in lifetime (18+)
Sexual Behavior - People using protection when performing oral sex (%)
Sexual Behavior - Average number of times people have vaginal or anal sex a year
Sexual Behavior - People having sex without condom (%)
Sexual Behavior - Average number of male sex partners in lifetime (females 18+)
Sexual Behavior - Average number of male vaginal sex partners in lifetime (females 18+)
Sexual Behavior - Average number of female sex partners in lifetime (females 18+)
Sexual Behavior - Circumcised males 18+ (%)
Sleep Disorders - Average hours sleeping at night
Sleep Disorders - People that has trouble sleeping (%)
Smoking-Cigarette Use - People smoking cigarettes (%)
Taste & Smell - People 40+ having problems with smell (%)
Taste & Smell - People 40+ having problems with taste (%)
Taste & Smell - People 40+ that ever had wisdom teeth removed (%)
Taste & Smell - People 40+ that ever had tonsils teeth removed (%)
Taste & Smell - People 40+ that ever had a loss of consciousness because of a head injury (%)
Taste & Smell - People 40+ that ever had a broken nose or other serious injury to face or skull (%)
Taste & Smell - People 40+ that ever had two or more sinus infections (%)
Weight - Average height (inches)
Weight - Average weight (pounds)
Weight - Average BMI
Weight - People that are obese (%)
Weight - People that ever were obese (%)
Weight - People trying to lose weight (%)
Urban population: 11,118
Rural population: 899
Estimated median house/condo value in 2022: $100,787
77703:
$100,787Texas:
$275,400
Median resident age: This zip code:
32.6 yearsTexas median age:
35.6 years
Average household size: This zip code:
2.6 peopleTexas:
2.6 people
Averages for the 2020 tax year for zip code 77703, filed in 2021:
Average Adjusted Gross Income (AGI) in 2020: $28,204 (Individual Income Tax Returns) Here:
$28,204State:
$77,054
Salary/wage: $26,009 (reported on 85.8% of returns )Here:
$26,009State:
$62,766
(% of AGI for various income ranges: 1137.5% for AGIs below $25k , 3407.1% for AGIs $25k-50k , 6562.4% for AGIs $50k-75k , 10422.2% for AGIs $75k-100k , 12916.7% for AGIs $100k-200k ) Taxable interest for individuals: $505 (reported on 8.0% of returns )This zip code:
$505Texas:
$2,665
(% of AGI for various income ranges: 1.2% for AGIs below $25k , 8.0% for AGIs $25k-50k , 8.2% for AGIs $50k-75k , 14.4% for AGIs $75k-100k , 41.1% for AGIs $100k-200k ) Ordinary dividends: $4,800 (reported on 2.0% of returns )(% of AGI for various income ranges: 0.9% for AGIs below $25k , 2.7% for AGIs $25k-50k , 520.0% for AGIs $75k-100k ) Net capital gain/loss in AGI: +$5,811 (reported on 1.6% of returns )Here:
+$5,811State:
+$39,590
(% of AGI for various income ranges: 0.7% for AGIs below $25k , 7.6% for AGIs $25k-50k , 444.4% for AGIs $75k-100k ) Profit/loss from business: +$3,029 (reported on 18.4% of returns )Here:
+$3,029State:
+$10,888
(% of AGI for various income ranges: 105.8% for AGIs below $25k , 6.1% for AGIs $50k-75k , 120.0% for AGIs $75k-100k , 415.6% for AGIs $100k-200k ) Taxable individual retirement arrangement distribution: $13,581 (reported on 2.9% of returns )77703:
$13,581Texas:
$24,740
(% of AGI for various income ranges: 12.9% for AGIs below $25k , 36.1% for AGIs $25k-50k , 80.5% for AGIs $50k-75k , 1146.7% for AGIs $75k-100k ) Total itemized deductions: $30,792 (reported on 4.4% of returns )Here:
$30,792State:
$40,428
(% of AGI for various income ranges: 29.1% for AGIs below $25k , 175.6% for AGIs $25k-50k , 448.4% for AGIs $50k-75k , 773.3% for AGIs $75k-100k , 2014.4% for AGIs $100k-200k ) Charity contributions: $11,264 (reported on 2.5% of returns )Here:
$11,264State:
$18,201
(% of AGI for various income ranges: 43.3% for AGIs $25k-50k , 170.3% for AGIs $50k-75k , 374.4% for AGIs $100k-200k ) Taxes paid: $4,957 (reported on 2.5% of returns )(% of AGI for various income ranges: 25.0% for AGIs $25k-50k , 43.2% for AGIs $50k-75k , 207.8% for AGIs $100k-200k ) Earned income credit: $2,936 (reported on 42.4% of returns )(% of AGI for various income ranges: 198.4% for AGIs below $25k , 115.5% for AGIs $25k-50k ) Percentage of individuals using paid preparers for their 2020 taxes: 88.4%(% for various income ranges: 88.9% for AGIs below $25k , 90.0% for AGIs $25k-50k , 81.6% for AGIs $50k-75k , 85.7% for AGIs $75k-100k , 84.6% for AGIs $100k-200k )
Averages for the 2012 tax year for zip code 77703, filed in 2013:
Average Adjusted Gross Income (AGI) in 2012: $25,143 (Individual Income Tax Returns) Here:
$25,143State:
$65,384
Salary/wage: $23,361 (reported on 88.4% of returns )Here:
$23,361State:
$52,524
(% of AGI for various income ranges: 82.5% for AGIs below $25k , 89.5% for AGIs $25k-50k , 85.8% for AGIs $50k-75k , 80.2% for AGIs $75k-100k , 53.9% for AGIs $100k-200k ) Taxable interest for individuals: $562 (reported on 8.3% of returns )This zip code:
$562Texas:
$2,372
(% of AGI for various income ranges: 0.2% for AGIs below $25k , 0.1% for AGIs $50k-75k , 0.4% for AGIs $75k-100k , 0.2% for AGIs $100k-200k ) Ordinary dividends: $5,350 (reported on 2.8% of returns )(% of AGI for various income ranges: 0.5% for AGIs below $25k , 0.2% for AGIs $25k-50k , 0.5% for AGIs $50k-75k , 2.5% for AGIs $100k-200k ) Net capital gain/loss in AGI: +$991 (reported on 1.9% of returns )(% of AGI for various income ranges: 0.1% for AGIs $25k-50k , 0.5% for AGIs $75k-100k ) Profit/loss from business: +$5,478 (reported on 16.1% of returns )Here:
+$5,478State:
+$13,732
(% of AGI for various income ranges: 9.3% for AGIs below $25k , 0.3% for AGIs $25k-50k , 0.6% for AGIs $50k-75k , 1.7% for AGIs $75k-100k ) Taxable individual retirement arrangement distribution: $12,990 (reported on 3.5% of returns )77703:
$12,990Texas:
$19,511
(% of AGI for various income ranges: 0.9% for AGIs below $25k , 0.9% for AGIs $25k-50k , 2.0% for AGIs $50k-75k , 10.3% for AGIs $75k-100k ) Total itemized deductions: $18,054 (32% of AGI, reported on 8.3% of returns )Here:
$18,054State:
$24,724
Here:
32.0% of AGIState:
15.9% of AGI
(% of AGI for various income ranges: 2.2% for AGIs below $25k , 6.9% for AGIs $25k-50k , 10.0% for AGIs $50k-75k , 7.7% for AGIs $75k-100k , 8.1% for AGIs $100k-200k ) Charity contributions: $5,495 (reported on 6.6% of returns )(% of AGI for various income ranges: 0.5% for AGIs below $25k , 1.2% for AGIs $25k-50k , 2.8% for AGIs $50k-75k , 1.8% for AGIs $75k-100k , 2.8% for AGIs $100k-200k ) Taxes paid: $2,780 (reported on 7.8% of returns )(% of AGI for various income ranges: 0.4% for AGIs below $25k , 0.8% for AGIs $25k-50k , 1.4% for AGIs $50k-75k , 1.2% for AGIs $75k-100k , 1.6% for AGIs $100k-200k ) Earned income credit: $2,865 (reported on 47.2% of returns )(% of AGI for various income ranges: 14.1% for AGIs below $25k , 1.9% for AGIs $25k-50k ) Percentage of individuals using paid preparers for their 2012 taxes: 63.4%(% for various income ranges: 64.1% for AGIs below $25k , 58.8% for AGIs $25k-50k , 68.4% for AGIs $50k-75k , 66.7% for AGIs $75k-100k , 70.0% for AGIs $100k-200k )
Averages for the 2004 tax year for zip code 77703, filed in 2005:
Average Adjusted Gross Income (AGI) in 2004: $21,556 (Individual Income Tax Returns) Here:
$21,556State:
$47,881
Salary/wage: $19,803 (reported on 91.6% of returns )Here:
$19,803State:
$41,947
(% of AGI for various income ranges: 99.1% for AGIs below $10k , 90.2% for AGIs $10k-25k , 87.6% for AGIs $25k-50k , 82.8% for AGIs $50k-75k , 77.9% for AGIs $75k-100k , 47.4% for AGIs over 100k ) Taxable interest for individuals: $1,408 (reported on 14.4% of returns )This zip code:
$1,408Texas:
$2,255
(% of AGI for various income ranges: 1.2% for AGIs below $10k , 0.4% for AGIs $10k-25k , 0.8% for AGIs $25k-50k , 1.7% for AGIs $50k-75k , 0.7% for AGIs $75k-100k , 2.0% for AGIs over 100k ) Taxable dividends: $1,646 (reported on 4.4% of returns )(% of AGI for various income ranges: 0.2% for AGIs below $10k , 0.2% for AGIs $10k-25k , 0.2% for AGIs $25k-50k , 0.5% for AGIs $50k-75k , 0.9% for AGIs $75k-100k , 0.5% for AGIs over 100k ) Net capital gain/loss: +$3,340 (reported on 2.8% of returns )Here:
+$3,340State:
+$16,110
(% of AGI for various income ranges: 0.1% for AGIs below $10k , -0.1% for AGIs $10k-25k , 0.2% for AGIs $25k-50k , -0.1% for AGIs $50k-75k , 1.2% for AGIs $75k-100k , 3.3% for AGIs over 100k ) Profit/loss from business: +$2,530 (reported on 9.0% of returns )Here:
+$2,530State:
+$11,013
(% of AGI for various income ranges: 6.1% for AGIs below $10k , 1.8% for AGIs $10k-25k , 0.6% for AGIs $25k-50k , -0.5% for AGIs $50k-75k , -0.6% for AGIs $75k-100k , 0.0% for AGIs over 100k ) IRA payment deduction: $1,423 (reported on 0.5% of returns )Total itemized deductions: $16,355 (32% of AGI, reported on 7.9% of returns )Here:
$16,355State:
$19,631
Here:
31.7% of AGIState:
18.9% of AGI
(% of AGI for various income ranges: 1.5% for AGIs below $10k , 3.1% for AGIs $10k-25k , 6.1% for AGIs $25k-50k , 9.8% for AGIs $50k-75k , 9.3% for AGIs $75k-100k , 10.0% for AGIs over 100k ) Charity contributions deductions: $5,030 (9% of AGI, reported on 6.8% of returns )Here:
9.4% of AGIState:
4.2% of AGI
(% of AGI for various income ranges: 0.6% for AGIs $10k-25k , 1.5% for AGIs $25k-50k , 2.9% for AGIs $50k-75k , 3.4% for AGIs $75k-100k , 2.5% for AGIs over 100k ) Total tax: $2,979 (reported on 46.3% of returns )(% of AGI for various income ranges: 1.6% for AGIs below $10k , 2.3% for AGIs $10k-25k , 5.1% for AGIs $25k-50k , 8.8% for AGIs $50k-75k , 11.3% for AGIs $75k-100k , 20.2% for AGIs over 100k ) Earned income credit: $2,094 (reported on 50.3% of returns )Percentage of individuals using paid preparers for their 2004 taxes: 69.1%(% for various income ranges: 67.7% for AGIs below $10k , 72.5% for AGIs $10k-25k , 64.4% for AGIs $25k-50k , 71.0% for AGIs $50k-75k , 64.9% for AGIs $75k-100k , 66.7% for AGIs over 100k )
Estimated median household income in 2022: This zip code:
$27,684Texas:
$72,284
Nearest zip codes: 77708 ,
77702 ,
77701 ,
77706 ,
77662 ,
77707 .
Beaumont Zip Code Map
Percentage of family households: This zip code:
42.3%Texas:
50.5%
Percentage of households with unmarried partners: This zip code:
11.3%Texas:
48.7%
No gay or lesbian households reported
Household received Food Stamps/SNAP in the past 12 months: 1,549Household did not receive Food Stamps/SNAP in the past 12 months: 3,090
Women who had a birth in the past 12 months: 111 (25 now married , 83 unmarried) Women who did not have a birth in the past 12 months: 2,405 (556 now married , 1,864 unmarried)
Housing units in zip code 77703 with a mortgage: 342 (7
second mortgage , 7
home equity loan )
Houses without a mortgage: 15
Median monthly owner costs for units with a mortgage: $1,143
Median monthly owner costs for units without a mortgage: $370
Residents with income below the poverty level in 2022:
This zip code:
40.0%Whole state:
14.0%
Residents with income below 50% of the poverty level in 2022:
This zip code:
19.7%Whole state:
7.4%
Median number of rooms in houses and condos: Median number of rooms in apartments: Notable locations in this zip code not listed on our city pages
Click to draw/clear zip code borders Notable locations in zip code 77703: (A) , Beaumont Yacht Club Marina (B) , Colliers Ferry (C) , South Texas State Fairground (D) , Beaumont Emergency Services Training Complex (E) , Babe Didrikson Zaharias Museum (F) , Beaumont Fire and Rescue Station 2 (G) . Display/hide their locations on the map
Churches in zip code 77703 include: (A) , Greater Little Zion Church (B) , Mount Gilead Church (C) , Rising Sun Church (D) , New Birth Church (E) , Beacon Church (F) , New Life Deliverance Holiness Church (G) , Beacon Church (H) , Emmanuel Temple Seventh Day Adventist Church (I) . Display/hide their locations on the map
Cemeteries: (1) , Forest Lawn Memorial Park (2) , Magnolia Cemetery (3) . Display/hide their locations on the map
Parks in zip code 77703 include: (1) , Babe Zaharias Memorial Stadium (2) , Babe Zaharias Park (3) , Cottonwood Park (4) , Morgan Park (5) , Pine Street Park (6) , Magnolia Park (7) , Fairpark Coliseum (8) . Display/hide their locations on the map
Year house built (houses)
61 2020 or later670 2010 to 2019891 2000 to 2009502 1990 to 1999196 1980 to 1989416 1970 to 1979917 1960 to 19691,136 1950 to 1959318 1940 to 1949199 1939 or earlier
Zip code 77703 household income distribution in 2022 941 Less than $10,000496 $10,000 to $14,999184 $15,000 to $19,999395 $20,000 to $24,999472 $25,000 to $29,999283 $30,000 to $34,999381 $35,000 to $39,999243 $40,000 to $44,999165 $45,000 to $49,999232 $50,000 to $59,999218 $60,000 to $74,999340 $75,000 to $99,999142 $100,000 to $124,99967 $125,000 to $149,99971 $150,000 to $199,999Estimate of home value of owner-occupied houses/condos in 2022 in zip code 77703 41 Less than $10,00077 $15,000 to $19,9994 $20,000 to $24,99956 $25,000 to $29,999113 $30,000 to $34,99916 $35,000 to $39,99944 $40,000 to $49,999199 $50,000 to $59,999126 $60,000 to $69,99960 $70,000 to $79,999266 $80,000 to $89,999147 $90,000 to $99,999363 $100,000 to $124,99949 $125,000 to $149,99970 $150,000 to $174,9999 $175,000 to $199,99971 $200,000 to $249,99919 $250,000 to $299,9996 $300,000 to $399,99920 $400,000 to $499,999Rent paid by renters in 2022 in zip code 77703 124 Less than $10028 $100 to $14971 $150 to $19941 $200 to $24940 $250 to $29980 $300 to $349197 $350 to $39972 $400 to $449107 $450 to $499129 $500 to $549149 $550 to $59982 $600 to $649124 $650 to $699142 $700 to $749126 $750 to $799368 $800 to $89990 $900 to $999112 $1,000 to $1,24914 $1,250 to $1,499159 No cash rent
Median gross rent in 2022: $864.
Median price asked for vacant for-sale houses and condos in 2022: $873,236.
Estimated median house (or condo) value in 2022 for: White Non-Hispanic householders: $113,085Black or African American householders: $97,187Asian householders: $219,272Some other race householders: $86,988Two or more races householders: $59,992Hispanic or Latino householders: $98,987Estimated median house or condo value in 2022: $100,787
77703:
$100,787Texas:
$275,400
Lower value quartile - upper value quartile: $65,188 - $126,506
Mean price in 2022: Detached houses: $267,535Here:
$267,535State:
$369,058
Townhouses or other attached units: $274,521Here:
$274,521State:
$327,631
In 5-or-more-unit structures: $370,246Here:
$370,246State:
$413,944
Mobile homes: $55,781Here:
$55,781State:
$124,413
Housing units in structures:
One, detached: 3,992One, attached: 122Two: 1543 or 4: 2635 to 9: 52110 to 19: 19420 to 49: 650 or more: 134Mobile homes: 128Unemployment : 5.9%
Means of transportation to work in zip code 77703 76.2% 2,932 Drove a car alone11.8% 455 Carpooled0.6% 22 Bus or trolley bus0.4% 16 Taxi1.8% 71 Walked5.1% 196 Other means1.1% 44 Worked at homeTravel time to work (commute) in zip code 77703 40 Less than 5 minutes185 5 to 9 minutes628 10 to 14 minutes620 15 to 19 minutes1,112 20 to 24 minutes80 25 to 29 minutes625 30 to 34 minutes28 35 to 39 minutes52 40 to 44 minutes135 45 to 59 minutes153 60 to 89 minutes
Percentage of zip code residents living and working in this county: 90.2%
Household type by relationship:
Households: 12,018
Male householders: 1,844 (985 living alone ), Female householders: 2,756 (581 living alone )1,191 spouses (1,191 opposite-sex spouses ), 311 unmarried partners , (311 opposite-sex unmarried partners ), 4,009 children (3,846 natural , 31 adopted , 130 stepchildren ), 438 grandchildren , 356 brothers or sisters , 301 parents , 0 foster children , 407 other relatives , 112 non-relatives In group quarters: 273 (-1 institutionalized population )
Size of family households: 1,120 2-persons , 604 3-persons , 738 4-persons , 108 5-persons , 155 6-persons , 75 7-or-more-persons
Size of nonfamily households: 1,566 1-person , 218 2-persons , 12 5-persons
708 married couples with children. single-parent households (291 men , 1,786 women ).
72.2% of residents of 77703 zip code speak English at home. of residents speak Spanish at home (54% very well, 13% well, 15% not well, 18% not at all ).of residents speak other Indo-European language at home (100% very well ).of residents speak Asian or Pacific Island language at home (100% not well ).
Foreign born population: 1,494 (12.4%)
(14.4%
of them are naturalized citizens )
This zip code:
12.4%Whole state:
17.2%
61% Honduras 34% El Salvador 2% Guatemala 2% Uganda 1% American 1% Irish 1% English 1% German 1% Italian 0% African 0% Scotch-Irish
Year of entry for the foreign-born population
586 2010 or later 699 2000 to 2009 141 1990 to 1999 148 Before 1990
There are
14 Medical Specialists in Zip Code 77703 .
Facilities with environmental interests located in this zip code:
AMERICAN TRANSMISSION (4110 E LUCAS in BEAUMONT, TX)
(Resource Conservation and Recovery Act (tracking hazardous waste))
Housing units lacking complete plumbing facilities: 5.4%
Housing units lacking complete kitchen facilities: 4.3%
59.1% Electricity 40.1% Utility gas
Population in 1990: 16,003.
Place of birth for U.S.-born residents:
This state: 8,884Northeast: 70Midwest: 34South: 1,182West: 206
59% of the 77703 zip code residents lived in the same house 5 years ago.
Out of people who lived in different houses, 80% lived in this county.
Out of people who lived in different counties, 50% lived in Texas.
92% of the 77703 zip code residents lived in the same house 1 year ago.
Out of people who lived in different houses, 56% moved from this county.
Out of people who lived in different houses, 35% moved from different county within same state.
Out of people who lived in different houses, 8% moved from different state.
Out of people who lived in different houses, 1% moved from abroad.
Private vs. public school enrollment:
Students in private schools in grades 1 to 8 (elementary and middle school): 34
Students in private schools in grades 9 to 12 (high school): 89
Students in private undergraduate colleges: 9
Occupation by median earnings in the past 12 months ($)
60,624 Transportation occupations 58,991 Health diagnosing and treating practitioners and other technical occupations 42,615 Health technologists and technicians 40,282 Education, training, and library occupations 36,629 Fire fighting and prevention, and other protective service workers including supervisors 32,148 Production occupations
Companies with federal contracts located in this zip code (BEAUMONT, TX):
SIX CONTINENTS (2095 NORTH 11TH ST; small business) in 28 contracts from 2001 to 2005
Contracts for Lodging - Hotel/Motel, Lease or Rental of Facilities -- Family Housing Facilities, Lease or Rental of Facilities -- Troop Housing Facilities, Lease or Rental of Equipment -- Special Industry Machinery, and more by ArmySigned by year: 2000: $0; 2001: $76,427; 2002: $142,610; 2003: $198,276; 2004: $117,163; 2005: -$21,373; 2006: $0.
Biggest contracts: with Army for Lodging - Hotel/Motel. Signed on 2002-12-19. Completion date: 2003-02-09.
, same as above. Signed on 2002-07-16. Completion date: 2002-07-31.
, same as above. Signed on 2001-03-29. Completion date: 2001-04-12.
, same as above. Signed on 2004-04-12. Completion date: 2004-09-04.
DSF ADVANCED STAFFING, INC (2358 EASTEX FWY; small business) in 14 contracts from 2004 to 2005
Contracts for Other Professional Services, Civilian Personnel Recruitment by Army, U.S. Army Corps of Engineers - civil program financing only, Maritime AdministrationSigned by year: 2000: $0; 2001: $0; 2002: $0; 2003: $0; 2004: $66,048; 2005: $100,264; 2006: $0.
Biggest contracts: with Army for Other Professional Services. Signed on 2004-11-09. Completion date: 2004-10-25.
with U.S. Army Corps of Engineers - civil program financing only for Other Professional Services. Signed on 2004-11-09. Completion date: 2004-10-25.
, same as above. Signed on 2005-01-05. Completion date: 2004-12-15.
with Army for Other Professional Services. Signed on 2005-01-05. Completion date: 2004-12-15.
WARREN EQUIPMENT COMPANY (; small business)
$13,995 with Bureau of Prisoners/Federal Prison System for . Signed on 2005-01-20. Completion date: 2005-04-30.
ALH PROPERTIES # ONE INC (2155 NORTH 11TH STREET) in 6 contracts from 2003 to 2005
Contracts for Lodging - Hotel/Motel, Lease or Rental of Facilities -- Family Housing Facilities by ArmySigned by year: 2000: $0; 2001: $0; 2002: $0; 2003: $0; 2004: $9,000; 2005: $1,450; 2006: $0.
Biggest contracts: with Army for Lodging - Hotel/Motel. Signed on 2003-02-13. Completion date: 2004-03-09.
with Army for Lease or Rental of Facilities -- Family Housing Facilities. Signed on 2005-01-05. Completion date: 2005-09-30.
with Army for Lodging - Hotel/Motel. Signed on 2004-04-12. Completion date: 2004-09-01.
, same as above. Signed on 2005-12-19. Completion date: 2004-09-01.
BILL CLARK PEST CONTROL, INC (2975 N 11TH STREET; small business) in 4 contracts from 2002 to 2003
$2,114 with Navy for Insect and Rodent Control Services. Signed on 2003-04-03. Completion date: 2004-03-15.
, same as above. Signed on 2002-03-12. Completion date: 2003-03-15.
, same as above. Signed on 2002-12-05. Completion date: 2004-03-15.
, same as above. Signed on 2002-03-12. Completion date: 2003-03-15.
BICYCLE SPORTS (2770 INTERSTATE 10 EAST; small business)
$3,594 with Bureau of Prisoners/Federal Prison System for . Signed on 2005-09-13. Completion date: 2005-09-30.
Top industries in this zip code by the number of employees in 2005:
Administrative and Support and Waste Management and Remediation Services: Telemarketing Bureaus (over 1000 employees: 1 establishment)Administrative and Support and Waste Management and Remediation Services: Temporary Help Services (250-499: 2, 50-99: 1)Other Services (except Public Administration): Religious Organizations (100-249: 1, 50-99: 1, 10-19: 1, 5-9: 4, 1-4: 6)Professional, Scientific, and Technical Services: Tax Preparation Services (100-249: 1, 5-9: 1)Information: Directory and Mailing List Publishers (100-249: 1)Accommodation and Food Services: Full-Service Restaurants (50-99: 1, 20-49: 1, 10-19: 3, 5-9: 1, 1-4: 1)Professional, Scientific, and Technical Services: Offices of Certified Public Accountants (20-49: 2, 10-19: 1, 1-4: 7)Construction: Plumbing, Heating, and Air-Conditioning Contractors (50-99: 1, 10-19: 1, 1-4: 1)
People in group quarters in 2010:
175 people in correctional residential facilities
64 people in group homes intended for adults
39 people in emergency and transitional shelters (with sleeping facilities) for people experiencing homelessness
35 people in nursing facilities/skilled-nursing facilities
19 people in other noninstitutional facilities
People in group quarters in 2000:
50 people in nursing homes
19 people in homes or halfway houses for drug/alcohol abuse
7 people in other noninstitutional group quarters
6 people in other nonhousehold living situations
Fatal accident statistics in 2014:
Fatal accident count: 1Vehicles involved in fatal accidents: 3Fatal accidents caused by drunken drivers: 0Fatalities: 1Persons involved in fatal accidents: 3Pedestrians involved in fatal accidents: 0
Fatal accident statistics in 2010:
Fatal accident count: 3Vehicles involved in fatal accidents: 5Fatal accidents caused by drunken drivers: 1Fatalities: 3Persons involved in fatal accidents: 6Pedestrians involved in fatal accidents: 1
Home Mortgage Disclosure Act Aggregated Statistics For Year 2009(Based on 5 full and 6 partial tracts) A) FHA, FSA/RHS & VA B) Conventional C) Refinancings D) Home Improvement Loans F) Non-occupant Loans on G) Loans On Manufactured Number Average Value Number Average Value Number Average Value Number Average Value Number Average Value Number Average Value
LOANS ORIGINATED 39 $85,995 23 $128,533 55 $72,449 24 $31,973 19 $48,369 0 $0 APPLICATIONS APPROVED, NOT ACCEPTED 2 $88,460 2 $39,095 3 $61,670 3 $22,363 2 $39,095 2 $39,095 APPLICATIONS DENIED 10 $110,614 17 $50,134 44 $79,795 60 $20,568 22 $54,278 0 $0 APPLICATIONS WITHDRAWN 8 $105,818 5 $65,376 19 $89,537 6 $64,427 2 $87,675 0 $0 FILES CLOSED FOR INCOMPLETENESS 0 $0 0 $0 4 $52,500 9 $49,122 2 $42,000 0 $0
Aggregated Statistics For Year 2008(Based on 5 full and 6 partial tracts) A) FHA, FSA/RHS & VA B) Conventional C) Refinancings D) Home Improvement Loans F) Non-occupant Loans on G) Loans On Manufactured Number Average Value Number Average Value Number Average Value Number Average Value Number Average Value Number Average Value
LOANS ORIGINATED 29 $84,581 51 $84,354 32 $83,350 24 $24,288 11 $64,623 5 $71,754 APPLICATIONS APPROVED, NOT ACCEPTED 10 $68,424 11 $45,107 7 $55,174 6 $22,913 9 $38,369 2 $29,890 APPLICATIONS DENIED 10 $76,165 43 $54,020 114 $56,203 65 $17,048 16 $36,211 2 $60,005 APPLICATIONS WITHDRAWN 6 $84,680 8 $71,649 27 $102,856 5 $20,294 2 $49,000 0 $0 FILES CLOSED FOR INCOMPLETENESS 4 $73,660 0 $0 8 $61,369 4 $57,015 0 $0 0 $0
Aggregated Statistics For Year 2007(Based on 5 full and 6 partial tracts) A) FHA, FSA/RHS & VA B) Conventional C) Refinancings D) Home Improvement Loans E) Loans on Dwellings For 5+ Families F) Non-occupant Loans on G) Loans On Manufactured Number Average Value Number Average Value Number Average Value Number Average Value Number Average Value Number Average Value Number Average Value
LOANS ORIGINATED 12 $74,555 96 $69,781 100 $63,900 47 $27,462 4 $5,313,835 42 $46,398 5 $42,440 APPLICATIONS APPROVED, NOT ACCEPTED 0 $0 27 $60,991 26 $50,591 9 $13,896 0 $0 2 $59,390 8 $59,546 APPLICATIONS DENIED 16 $72,086 63 $62,750 220 $59,409 159 $29,269 0 $0 75 $47,758 8 $53,212 APPLICATIONS WITHDRAWN 2 $55,000 26 $75,769 56 $76,001 11 $31,973 0 $0 9 $67,260 0 $0 FILES CLOSED FOR INCOMPLETENESS 4 $62,112 10 $92,052 14 $82,457 2 $43,835 0 $0 0 $0 0 $0
Aggregated Statistics For Year 2006(Based on 5 full and 6 partial tracts) A) FHA, FSA/RHS & VA B) Conventional C) Refinancings D) Home Improvement Loans E) Loans on Dwellings For 5+ Families F) Non-occupant Loans on G) Loans On Manufactured Number Average Value Number Average Value Number Average Value Number Average Value Number Average Value Number Average Value Number Average Value
LOANS ORIGINATED 31 $68,969 158 $65,240 53 $120,979 40 $25,955 2 $2,712,425 39 $129,579 5 $57,984 APPLICATIONS APPROVED, NOT ACCEPTED 2 $58,000 25 $46,804 18 $54,541 18 $23,128 0 $0 12 $63,152 2 $44,050 APPLICATIONS DENIED 8 $58,008 126 $53,313 199 $54,298 137 $22,802 0 $0 52 $38,938 12 $50,110 APPLICATIONS WITHDRAWN 2 $51,045 36 $65,899 125 $63,482 23 $29,526 0 $0 10 $51,366 0 $0 FILES CLOSED FOR INCOMPLETENESS 2 $44,000 9 $58,991 15 $82,601 1 $23,850 0 $0 0 $0 0 $0
Aggregated Statistics For Year 2005(Based on 5 full and 6 partial tracts) A) FHA, FSA/RHS & VA B) Conventional C) Refinancings D) Home Improvement Loans E) Loans on Dwellings For 5+ Families F) Non-occupant Loans on G) Loans On Manufactured Number Average Value Number Average Value Number Average Value Number Average Value Number Average Value Number Average Value Number Average Value
LOANS ORIGINATED 23 $60,073 118 $62,337 96 $61,239 68 $35,368 1 $147,160 54 $29,266 0 $0 APPLICATIONS APPROVED, NOT ACCEPTED 0 $0 50 $54,554 28 $51,997 7 $38,061 0 $0 6 $39,277 4 $36,805 APPLICATIONS DENIED 2 $77,770 106 $51,722 258 $52,696 119 $26,057 0 $0 62 $38,757 11 $42,728 APPLICATIONS WITHDRAWN 0 $0 48 $129,778 118 $75,326 53 $141,278 0 $0 19 $186,247 0 $0 FILES CLOSED FOR INCOMPLETENESS 0 $0 4 $54,555 21 $77,678 0 $0 0 $0 2 $67,010 0 $0
Aggregated Statistics For Year 2004(Based on 5 full and 6 partial tracts) A) FHA, FSA/RHS & VA B) Conventional C) Refinancings D) Home Improvement Loans F) Non-occupant Loans on G) Loans On Manufactured Number Average Value Number Average Value Number Average Value Number Average Value Number Average Value Number Average Value
LOANS ORIGINATED 45 $61,454 103 $67,249 165 $54,416 73 $26,279 72 $40,414 0 $0 APPLICATIONS APPROVED, NOT ACCEPTED 3 $56,427 40 $58,479 38 $49,662 11 $13,038 7 $39,779 0 $0 APPLICATIONS DENIED 6 $60,443 96 $49,266 340 $53,483 134 $20,589 64 $37,039 32 $45,681 APPLICATIONS WITHDRAWN 7 $71,571 29 $59,295 119 $57,774 14 $43,296 15 $52,928 0 $0 FILES CLOSED FOR INCOMPLETENESS 0 $0 4 $117,182 42 $67,679 7 $23,017 4 $42,170 0 $0
Aggregated Statistics For Year 2003(Based on 5 full and 6 partial tracts) A) FHA, FSA/RHS & VA B) Conventional C) Refinancings D) Home Improvement Loans F) Non-occupant Loans on Number Average Value Number Average Value Number Average Value Number Average Value Number Average Value
LOANS ORIGINATED 32 $52,008 118 $55,136 168 $57,964 34 $14,718 50 $46,038 APPLICATIONS APPROVED, NOT ACCEPTED 0 $0 43 $48,335 62 $46,313 14 $22,025 18 $39,728 APPLICATIONS DENIED 14 $53,958 77 $50,521 313 $48,241 86 $13,803 42 $39,585 APPLICATIONS WITHDRAWN 0 $0 33 $48,443 90 $52,236 2 $21,000 10 $37,088 FILES CLOSED FOR INCOMPLETENESS 0 $0 11 $48,308 8 $71,204 0 $0 1 $35,000
Aggregated Statistics For Year 2002(Based on 5 full and 6 partial tracts) A) FHA, FSA/RHS & VA B) Conventional C) Refinancings D) Home Improvement Loans E) Loans on Dwellings For 5+ Families F) Non-occupant Loans on Number Average Value Number Average Value Number Average Value Number Average Value Number Average Value Number Average Value
LOANS ORIGINATED 26 $63,368 115 $59,590 119 $52,791 53 $15,988 2 $99,630 38 $31,424 APPLICATIONS APPROVED, NOT ACCEPTED 0 $0 28 $40,162 27 $47,729 12 $24,899 0 $0 6 $33,883 APPLICATIONS DENIED 6 $57,875 76 $41,304 196 $38,041 75 $16,062 0 $0 32 $31,138 APPLICATIONS WITHDRAWN 8 $58,401 21 $52,315 99 $40,604 4 $36,700 0 $0 2 $22,470 FILES CLOSED FOR INCOMPLETENESS 4 $47,980 16 $44,701 11 $59,347 4 $28,098 0 $0 0 $0
Aggregated Statistics For Year 2001(Based on 5 full and 6 partial tracts) A) FHA, FSA/RHS & VA B) Conventional C) Refinancings D) Home Improvement Loans F) Non-occupant Loans on Number Average Value Number Average Value Number Average Value Number Average Value Number Average Value
LOANS ORIGINATED 49 $54,428 93 $55,585 121 $48,929 39 $15,168 26 $35,900 APPLICATIONS APPROVED, NOT ACCEPTED 2 $53,125 20 $50,646 59 $34,471 13 $22,251 10 $30,752 APPLICATIONS DENIED 10 $57,946 88 $42,083 182 $36,003 57 $9,347 17 $28,504 APPLICATIONS WITHDRAWN 11 $43,335 21 $48,178 122 $32,678 4 $21,895 8 $25,772 FILES CLOSED FOR INCOMPLETENESS 0 $0 14 $27,504 21 $37,811 0 $0 0 $0
Aggregated Statistics For Year 2000(Based on 5 full and 6 partial tracts) A) FHA, FSA/RHS & VA B) Conventional C) Refinancings D) Home Improvement Loans E) Loans on Dwellings For 5+ Families F) Non-occupant Loans on Number Average Value Number Average Value Number Average Value Number Average Value Number Average Value Number Average Value
LOANS ORIGINATED 42 $60,928 151 $45,251 107 $35,578 47 $11,772 2 $3,596,390 31 $27,949 APPLICATIONS APPROVED, NOT ACCEPTED 4 $39,000 38 $41,221 43 $30,377 17 $20,424 0 $0 3 $23,347 APPLICATIONS DENIED 2 $44,515 108 $41,008 161 $28,493 87 $11,294 0 $0 13 $29,224 APPLICATIONS WITHDRAWN 0 $0 25 $57,902 96 $38,770 11 $24,330 0 $0 4 $40,500 FILES CLOSED FOR INCOMPLETENESS 4 $38,110 17 $37,695 22 $46,010 2 $27,775 0 $0 2 $20,815
Aggregated Statistics For Year 1999(Based on 4 full and 3 partial tracts) A) FHA, FSA/RHS & VA B) Conventional C) Refinancings D) Home Improvement Loans E) Loans on Dwellings For 5+ Families F) Non-occupant Loans on Number Average Value Number Average Value Number Average Value Number Average Value Number Average Value Number Average Value
LOANS ORIGINATED 24 $39,872 51 $54,733 63 $31,763 36 $10,831 0 $0 26 $32,662 APPLICATIONS APPROVED, NOT ACCEPTED 0 $0 15 $41,561 18 $33,163 11 $12,269 1 $4,970 2 $48,775 APPLICATIONS DENIED 0 $0 44 $38,613 55 $26,660 60 $12,232 0 $0 19 $29,507 APPLICATIONS WITHDRAWN 2 $40,140 13 $36,422 35 $34,019 5 $13,562 0 $0 3 $34,827 FILES CLOSED FOR INCOMPLETENESS 0 $0 6 $37,383 21 $30,193 3 $17,077 0 $0 3 $32,460
Private Mortgage Insurance Companies Aggregated Statistics For Year 2009(Based on 4 partial tracts) A) Conventional Number Average Value
LOANS ORIGINATED 3 $169,047 APPLICATIONS APPROVED, NOT ACCEPTED 1 $224,300 APPLICATIONS DENIED 2 $300,190 APPLICATIONS WITHDRAWN 1 $66,920 FILES CLOSED FOR INCOMPLETENESS 0 $0
Aggregated Statistics For Year 2008(Based on 4 full and 6 partial tracts) A) Conventional B) Refinancings C) Non-occupant Loans on Number Average Value Number Average Value Number Average Value
LOANS ORIGINATED 27 $77,006 2 $233,615 2 $71,285 APPLICATIONS APPROVED, NOT ACCEPTED 22 $78,499 0 $0 0 $0 APPLICATIONS DENIED 0 $0 0 $0 0 $0 APPLICATIONS WITHDRAWN 0 $0 0 $0 0 $0 FILES CLOSED FOR INCOMPLETENESS 2 $92,220 0 $0 2 $71,000
Aggregated Statistics For Year 2007(Based on 5 full and 6 partial tracts) A) Conventional B) Refinancings C) Non-occupant Loans on Number Average Value Number Average Value Number Average Value
LOANS ORIGINATED 58 $71,296 6 $89,658 11 $44,822 APPLICATIONS APPROVED, NOT ACCEPTED 14 $58,820 0 $0 1 $65,060 APPLICATIONS DENIED 0 $0 0 $0 0 $0 APPLICATIONS WITHDRAWN 0 $0 0 $0 0 $0 FILES CLOSED FOR INCOMPLETENESS 0 $0 0 $0 0 $0
Aggregated Statistics For Year 2006(Based on 5 full and 6 partial tracts) A) Conventional B) Refinancings C) Non-occupant Loans on Number Average Value Number Average Value Number Average Value
LOANS ORIGINATED 51 $65,498 4 $82,758 9 $61,902 APPLICATIONS APPROVED, NOT ACCEPTED 6 $74,533 2 $52,835 0 $0 APPLICATIONS DENIED 0 $0 2 $47,820 0 $0 APPLICATIONS WITHDRAWN 4 $52,890 0 $0 2 $65,755 FILES CLOSED FOR INCOMPLETENESS 0 $0 0 $0 0 $0
Aggregated Statistics For Year 2005(Based on 4 full and 6 partial tracts) A) Conventional B) Refinancings C) Non-occupant Loans on Number Average Value Number Average Value Number Average Value
LOANS ORIGINATED 27 $75,804 8 $99,744 4 $40,640 APPLICATIONS APPROVED, NOT ACCEPTED 6 $47,885 0 $0 0 $0 APPLICATIONS DENIED 4 $73,615 0 $0 0 $0 APPLICATIONS WITHDRAWN 2 $23,270 0 $0 2 $23,270 FILES CLOSED FOR INCOMPLETENESS 0 $0 0 $0 0 $0
Aggregated Statistics For Year 2004(Based on 4 full and 6 partial tracts) A) Conventional B) Refinancings C) Non-occupant Loans on Number Average Value Number Average Value Number Average Value
LOANS ORIGINATED 28 $74,795 3 $52,787 4 $41,890 APPLICATIONS APPROVED, NOT ACCEPTED 5 $62,530 2 $74,340 0 $0 APPLICATIONS DENIED 2 $50,000 0 $0 0 $0 APPLICATIONS WITHDRAWN 0 $0 0 $0 0 $0 FILES CLOSED FOR INCOMPLETENESS 0 $0 0 $0 0 $0
Aggregated Statistics For Year 2003(Based on 5 full and 6 partial tracts) A) Conventional B) Refinancings C) Non-occupant Loans on Number Average Value Number Average Value Number Average Value
LOANS ORIGINATED 36 $57,824 5 $111,392 11 $36,105 APPLICATIONS APPROVED, NOT ACCEPTED 7 $37,303 0 $0 0 $0 APPLICATIONS DENIED 0 $0 2 $66,750 0 $0 APPLICATIONS WITHDRAWN 2 $106,665 4 $91,218 0 $0 FILES CLOSED FOR INCOMPLETENESS 0 $0 0 $0 0 $0
Aggregated Statistics For Year 2002(Based on 5 full and 4 partial tracts) A) Conventional B) Refinancings C) Non-occupant Loans on Number Average Value Number Average Value Number Average Value
LOANS ORIGINATED 32 $66,577 3 $106,067 7 $35,691 APPLICATIONS APPROVED, NOT ACCEPTED 7 $80,967 3 $44,127 1 $25,090 APPLICATIONS DENIED 0 $0 0 $0 0 $0 APPLICATIONS WITHDRAWN 5 $125,310 2 $61,640 2 $61,640 FILES CLOSED FOR INCOMPLETENESS 0 $0 2 $20,000 2 $20,000
Aggregated Statistics For Year 2001(Based on 5 full and 4 partial tracts) A) Conventional B) Refinancings C) Non-occupant Loans on Number Average Value Number Average Value Number Average Value
LOANS ORIGINATED 39 $62,509 6 $74,747 5 $28,596 APPLICATIONS APPROVED, NOT ACCEPTED 5 $52,110 0 $0 0 $0 APPLICATIONS DENIED 0 $0 0 $0 0 $0 APPLICATIONS WITHDRAWN 0 $0 0 $0 0 $0 FILES CLOSED FOR INCOMPLETENESS 0 $0 0 $0 0 $0
Aggregated Statistics For Year 2000(Based on 5 full and 6 partial tracts) A) Conventional B) Refinancings C) Non-occupant Loans on Number Average Value Number Average Value Number Average Value
LOANS ORIGINATED 32 $57,290 9 $33,454 2 $19,645 APPLICATIONS APPROVED, NOT ACCEPTED 6 $56,303 0 $0 0 $0 APPLICATIONS DENIED 0 $0 0 $0 0 $0 APPLICATIONS WITHDRAWN 0 $0 0 $0 0 $0 FILES CLOSED FOR INCOMPLETENESS 0 $0 0 $0 0 $0
Aggregated Statistics For Year 1999(Based on 4 full and 1 partial tracts) A) Conventional B) Refinancings C) Non-occupant Loans on Number Average Value Number Average Value Number Average Value
LOANS ORIGINATED 16 $66,226 1 $46,370 1 $35,290 APPLICATIONS APPROVED, NOT ACCEPTED 0 $0 1 $66,600 0 $0 APPLICATIONS DENIED 0 $0 1 $42,750 0 $0 APPLICATIONS WITHDRAWN 0 $0 0 $0 0 $0 FILES CLOSED FOR INCOMPLETENESS 0 $0 0 $0 0 $0
2002 - 2018 National Fire Incident Reporting System (NFIRS) incidents See full 2006 National Fire Incident Reporting System statistics for zip code 77703, Texas
Most common first names in zip code 77703 among deceased individuals Name Count Lived (average)
Mary 144 78.2 years John 127 74.5 years James 109 70.7 years William 92 74.2 years Robert 79 73.7 years Joseph 78 71.1 years Willie 76 71.4 years Charles 54 68.2 years Henry 47 72.5 years George 47 77.5 years
Most common last names in zip code 77703 among deceased individuals Last name Count Lived (average)
Johnson 91 69.4 years Jones 87 68.7 years Smith 84 73.1 years Williams 80 72.9 years Davis 52 74.6 years Thomas 50 74.6 years Lewis 44 72.6 years Brown 41 73.2 years White 31 74.6 years Harris 30 66.8 years
Businesses in zip code 77703
Name Count Name Count
Carl\s Jr. 1 Lane Furniture 1 Church's Chicken 1 Red Lobster 1 Cricket Wireless 2 Sleep Inn 1 Days Inn 1 Studio 6 1 FedEx 1 Super 8 1 H&R Block 1 U-Haul 1 Home Depot 1 Waffle House 1 Jack In The Box 1

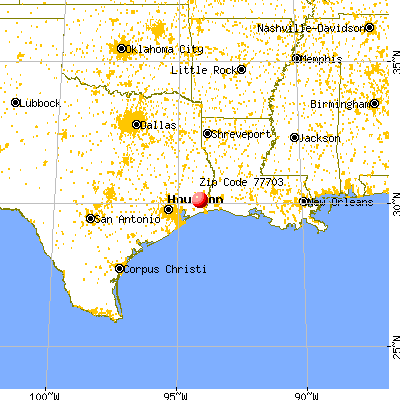

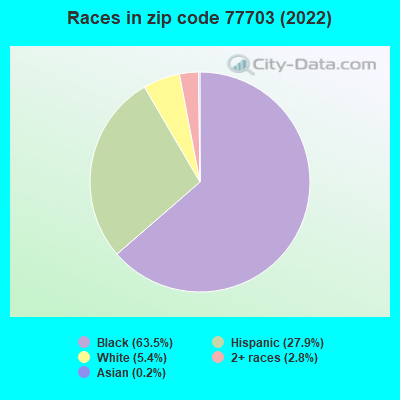


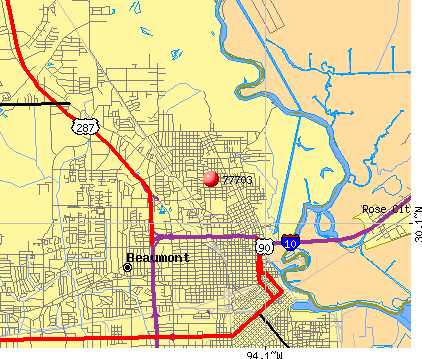 Nearest zip codes: 77708, 77702, 77701, 77706, 77662, 77707.
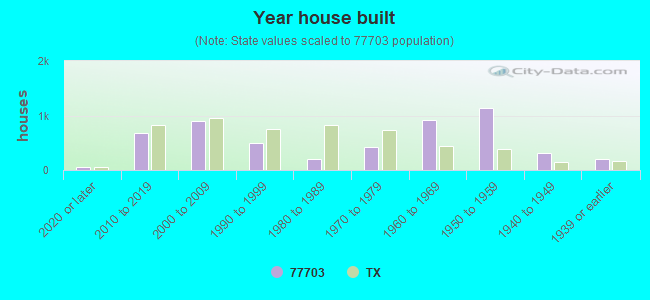


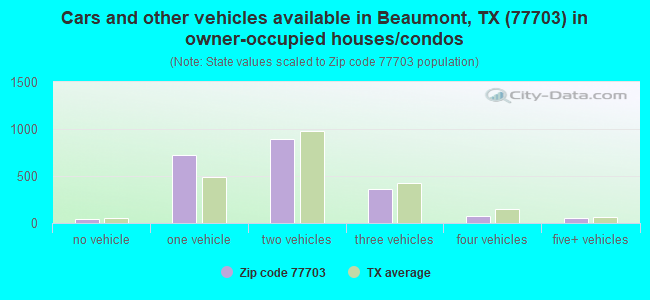
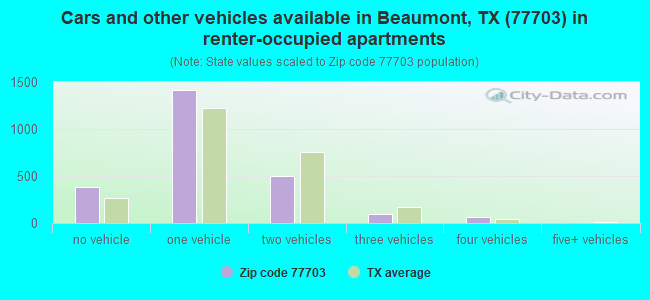


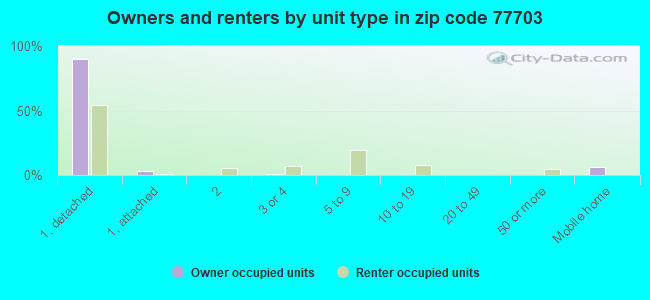
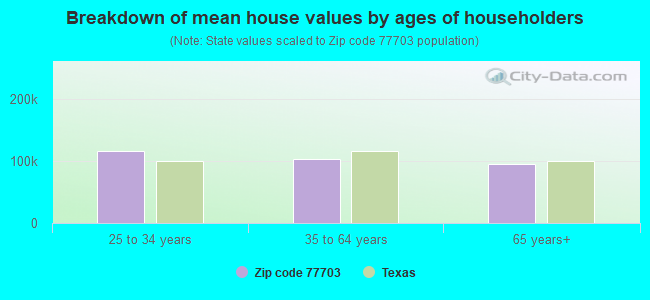


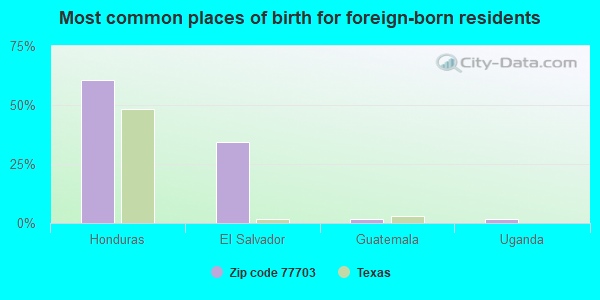
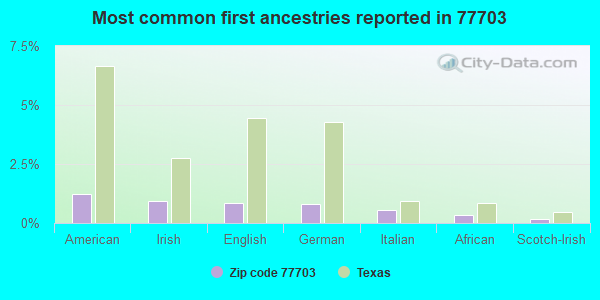
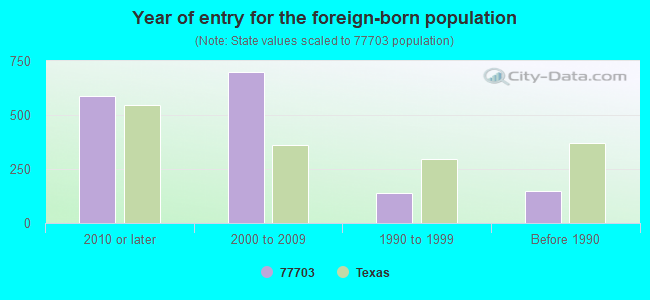
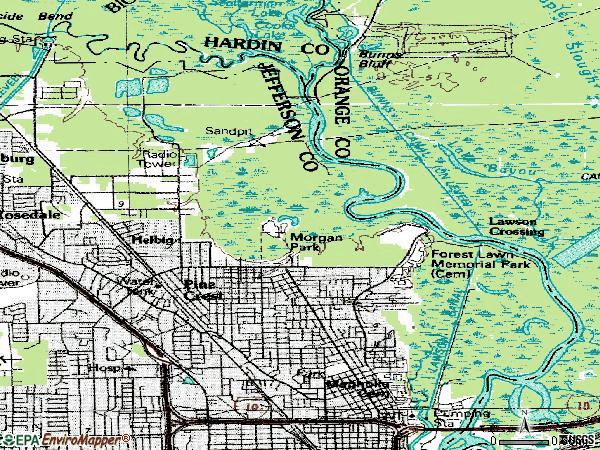


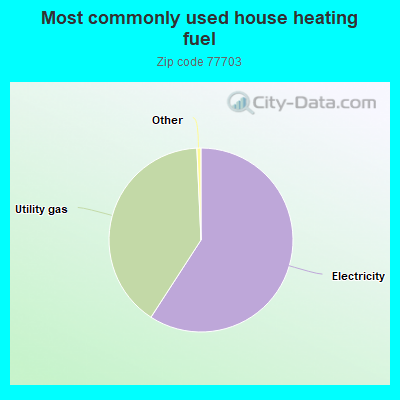
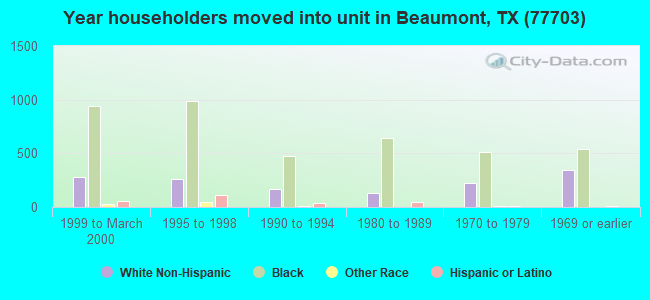
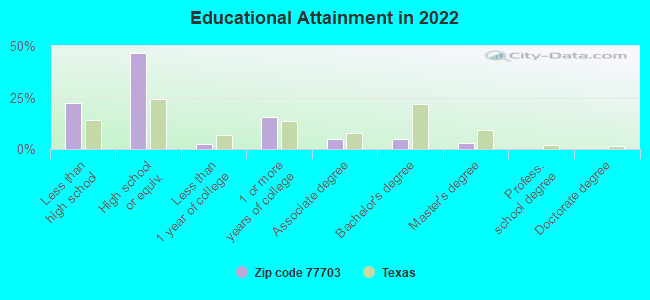
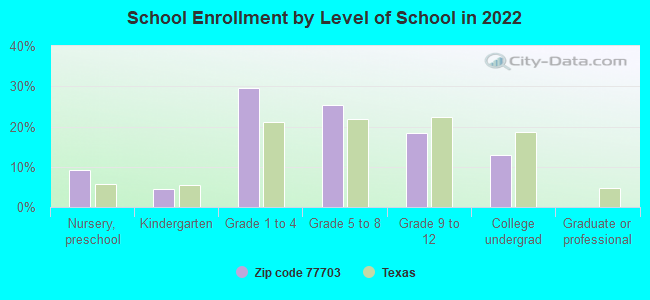
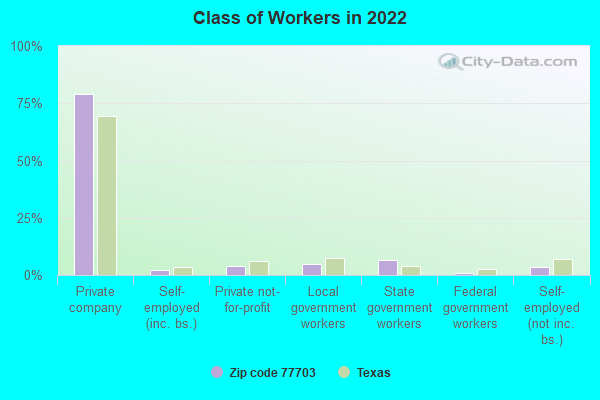
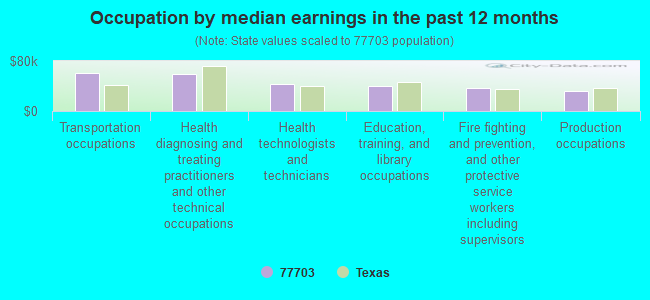
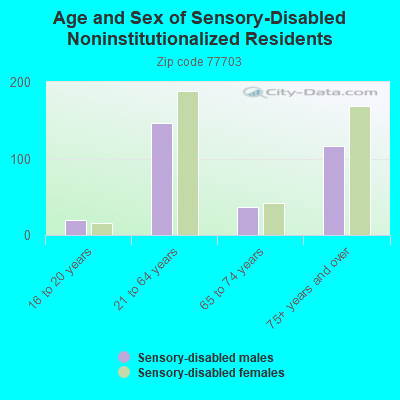
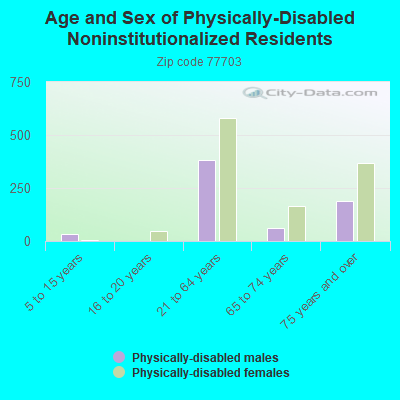
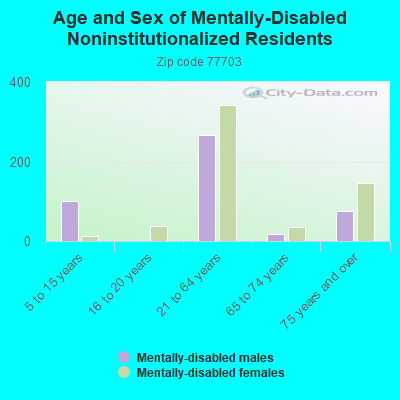
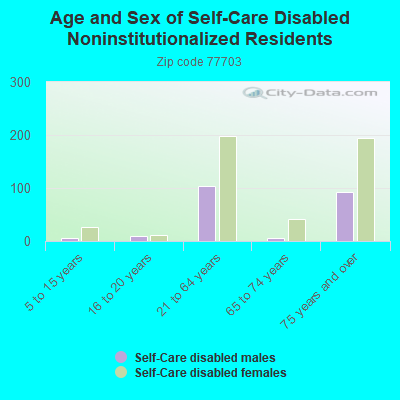
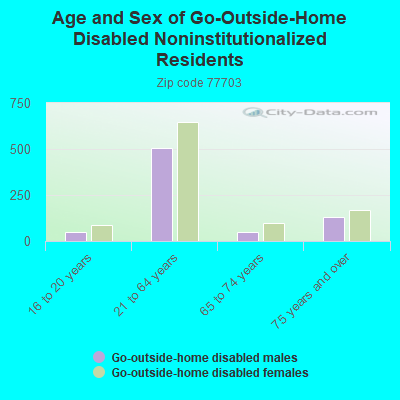
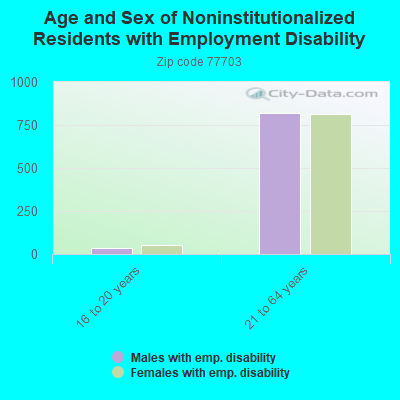
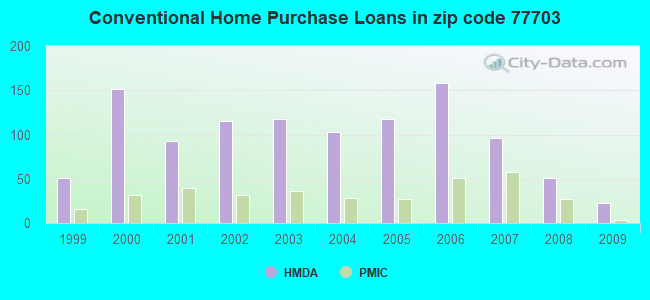
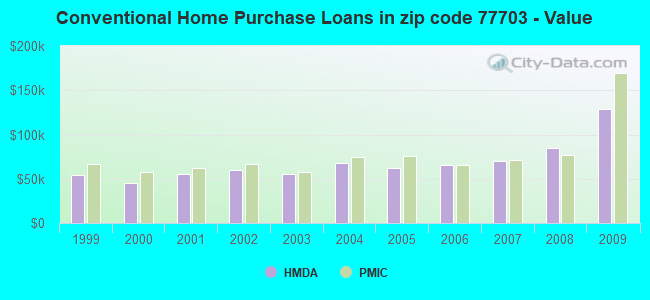
 Based on the data from the years 2002 - 2018 the average number of fires per year is 91. The highest number of fires - 118 took place in 2011, and the least - 69 in 2002. The data has a rising trend.
 When looking into fire subcategories, the most incidents belonged to: Structure Fires (46.5%), and Outside Fires (30.4%).