Estimated zip code population in 2022: 18,611
Zip code population in 2010: 17,080
Zip code population in 2000: 16,301
Houses and condos: 7,459
Renter-occupied apartments: 2,031
% of renters here:
31%State:
38%
March 2022 cost of living index in zip code 77707: 82.3
(low, U.S. average is 100)
Land area: 14.8
sq. mi.
Water area: 0.1
sq. mi.
Population density: 1,259 people per square mile (low).
OSM Map
General Map
Google Map
MSN Map
OSM Map
General Map
Google Map
MSN Map
OSM Map
General Map
Google Map
MSN Map
OSM Map
General Map
Google Map
MSN Map
Please wait while loading the map...
Real estate property taxes paid for housing units in 2022:
This zip code:
1.6% ($2,725)Texas:
1.5% ($4,050)
Median real estate property taxes paid for housing units with mortgages in 2022: $3,010 (1.6%)
Median real estate property taxes paid for housing units with no mortgage in 2022: $2,403 (1.6%)
Profiles of local businesses
Business Search - 14 Million verified businesses
Males: 8,971 Females: 9,639
For population 25 years and over in 77707:
High school or higher: 86.7%Bachelor's degree or higher: 26.8%Graduate or professional degree: 8.6%Unemployed: 3.9%Mean travel time to work (commute): 19.3 minutes
For population 15 years and over in 77707:
Never married: 33.5%Now married: 52.7%Separated: 1.1%Widowed: 4.6%Divorced: 8.1%
Zip code 77707 compared to state average:
Median house value below state average. Black race population percentage significantly above state average. Length of stay since moving in significantly above state average. 7,117 38.2% Black 5,382 28.9% White 4,454 23.9% Hispanic or Latino 1,046 5.6% Asian 512 2.8% Two or more races 47 0.3% Some other race 36 0.2% American Indian 13 0.07% Native Hawaiian and Other
Data:
Median household income ($)
Median household income (% change since 2000)
Household income diversity
Ratio of average income to average house value (%)
Ratio of average income to average rent
Median household income ($) - White
Median household income ($) - Black or African American
Median household income ($) - Asian
Median household income ($) - Hispanic or Latino
Median household income ($) - American Indian and Alaska Native
Median household income ($) - Multirace
Median household income ($) - Other Race
Median household income for houses/condos with a mortgage ($)
Median household income for apartments without a mortgage ($)
Races - White alone (%)
Races - White alone (% change since 2000)
Races - Black alone (%)
Races - Black alone (% change since 2000)
Races - American Indian alone (%)
Races - American Indian alone (% change since 2000)
Races - Asian alone (%)
Races - Asian alone (% change since 2000)
Races - Hispanic (%)
Races - Hispanic (% change since 2000)
Races - Native Hawaiian and Other Pacific Islander alone (%)
Races - Native Hawaiian and Other Pacific Islander alone (% change since 2000)
Races - Two or more races (%)
Races - Two or more races (% change since 2000)
Races - Other race alone (%)
Races - Other race alone (% change since 2000)
Racial diversity
Unemployment (%)
Unemployment (% change since 2000)
Unemployment (%) - White
Unemployment (%) - Black or African American
Unemployment (%) - Asian
Unemployment (%) - Hispanic or Latino
Unemployment (%) - American Indian and Alaska Native
Unemployment (%) - Multirace
Unemployment (%) - Other Race
Population density (people per square mile)
Population - Males (%)
Population - Females (%)
Population - Males (%) - White
Population - Males (%) - Black or African American
Population - Males (%) - Asian
Population - Males (%) - Hispanic or Latino
Population - Males (%) - American Indian and Alaska Native
Population - Males (%) - Multirace
Population - Males (%) - Other Race
Population - Females (%) - White
Population - Females (%) - Black or African American
Population - Females (%) - Asian
Population - Females (%) - Hispanic or Latino
Population - Females (%) - American Indian and Alaska Native
Population - Females (%) - Multirace
Population - Females (%) - Other Race
Coronavirus confirmed cases (Apr 27, 2024)
Deaths caused by coronavirus (Apr 27, 2024)
Coronavirus confirmed cases (per 100k population) (Apr 27, 2024)
Deaths caused by coronavirus (per 100k population) (Apr 27, 2024)
Daily increase in number of cases (Apr 27, 2024)
Weekly increase in number of cases (Apr 27, 2024)
Cases doubled (in days) (Apr 27, 2024)
Hospitalized patients (Apr 18, 2022)
Negative test results (Apr 18, 2022)
Total test results (Apr 18, 2022)
COVID Vaccine doses distributed (per 100k population) (Sep 19, 2023)
COVID Vaccine doses administered (per 100k population) (Sep 19, 2023)
COVID Vaccine doses distributed (Sep 19, 2023)
COVID Vaccine doses administered (Sep 19, 2023)
Likely homosexual households (%)
Likely homosexual households (% change since 2000)
Likely homosexual households - Lesbian couples (%)
Likely homosexual households - Lesbian couples (% change since 2000)
Likely homosexual households - Gay men (%)
Likely homosexual households - Gay men (% change since 2000)
Cost of living index
Median gross rent ($)
Median contract rent ($)
Median monthly housing costs ($)
Median house or condo value ($)
Median house or condo value ($ change since 2000)
Mean house or condo value by units in structure - 1, detached ($)
Mean house or condo value by units in structure - 1, attached ($)
Mean house or condo value by units in structure - 2 ($)
Mean house or condo value by units in structure by units in structure - 3 or 4 ($)
Mean house or condo value by units in structure - 5 or more ($)
Mean house or condo value by units in structure - Boat, RV, van, etc. ($)
Mean house or condo value by units in structure - Mobile home ($)
Median house or condo value ($) - White
Median house or condo value ($) - Black or African American
Median house or condo value ($) - Asian
Median house or condo value ($) - Hispanic or Latino
Median house or condo value ($) - American Indian and Alaska Native
Median house or condo value ($) - Multirace
Median house or condo value ($) - Other Race
Median resident age
Resident age diversity
Median resident age - Males
Median resident age - Females
Median resident age - White
Median resident age - Black or African American
Median resident age - Asian
Median resident age - Hispanic or Latino
Median resident age - American Indian and Alaska Native
Median resident age - Multirace
Median resident age - Other Race
Median resident age - Males - White
Median resident age - Males - Black or African American
Median resident age - Males - Asian
Median resident age - Males - Hispanic or Latino
Median resident age - Males - American Indian and Alaska Native
Median resident age - Males - Multirace
Median resident age - Males - Other Race
Median resident age - Females - White
Median resident age - Females - Black or African American
Median resident age - Females - Asian
Median resident age - Females - Hispanic or Latino
Median resident age - Females - American Indian and Alaska Native
Median resident age - Females - Multirace
Median resident age - Females - Other Race
Commute - mean travel time to work (minutes)
Travel time to work - Less than 5 minutes (%)
Travel time to work - Less than 5 minutes (% change since 2000)
Travel time to work - 5 to 9 minutes (%)
Travel time to work - 5 to 9 minutes (% change since 2000)
Travel time to work - 10 to 19 minutes (%)
Travel time to work - 10 to 19 minutes (% change since 2000)
Travel time to work - 20 to 29 minutes (%)
Travel time to work - 20 to 29 minutes (% change since 2000)
Travel time to work - 30 to 39 minutes (%)
Travel time to work - 30 to 39 minutes (% change since 2000)
Travel time to work - 40 to 59 minutes (%)
Travel time to work - 40 to 59 minutes (% change since 2000)
Travel time to work - 60 to 89 minutes (%)
Travel time to work - 60 to 89 minutes (% change since 2000)
Travel time to work - 90 or more minutes (%)
Travel time to work - 90 or more minutes (% change since 2000)
Marital status - Never married (%)
Marital status - Now married (%)
Marital status - Separated (%)
Marital status - Widowed (%)
Marital status - Divorced (%)
Median family income ($)
Median family income (% change since 2000)
Median non-family income ($)
Median non-family income (% change since 2000)
Median per capita income ($)
Median per capita income (% change since 2000)
Median family income ($) - White
Median family income ($) - Black or African American
Median family income ($) - Asian
Median family income ($) - Hispanic or Latino
Median family income ($) - American Indian and Alaska Native
Median family income ($) - Multirace
Median family income ($) - Other Race
Median year house/condo built
Median year apartment built
Year house built - Built 2005 or later (%)
Year house built - Built 2000 to 2004 (%)
Year house built - Built 1990 to 1999 (%)
Year house built - Built 1980 to 1989 (%)
Year house built - Built 1970 to 1979 (%)
Year house built - Built 1960 to 1969 (%)
Year house built - Built 1950 to 1959 (%)
Year house built - Built 1940 to 1949 (%)
Year house built - Built 1939 or earlier (%)
Average household size
Household density (households per square mile)
Average household size - White
Average household size - Black or African American
Average household size - Asian
Average household size - Hispanic or Latino
Average household size - American Indian and Alaska Native
Average household size - Multirace
Average household size - Other Race
Occupied housing units (%)
Vacant housing units (%)
Owner occupied housing units (%)
Renter occupied housing units (%)
Vacancy status - For rent (%)
Vacancy status - For sale only (%)
Vacancy status - Rented or sold, not occupied (%)
Vacancy status - For seasonal, recreational, or occasional use (%)
Vacancy status - For migrant workers (%)
Vacancy status - Other vacant (%)
Residents with income below the poverty level (%)
Residents with income below 50% of the poverty level (%)
Children below poverty level (%)
Poor families by family type - Married-couple family (%)
Poor families by family type - Male, no wife present (%)
Poor families by family type - Female, no husband present (%)
Poverty status for native-born residents (%)
Poverty status for foreign-born residents (%)
Poverty among high school graduates not in families (%)
Poverty among people who did not graduate high school not in families (%)
Residents with income below the poverty level (%) - White
Residents with income below the poverty level (%) - Black or African American
Residents with income below the poverty level (%) - Asian
Residents with income below the poverty level (%) - Hispanic or Latino
Residents with income below the poverty level (%) - American Indian and Alaska Native
Residents with income below the poverty level (%) - Multirace
Residents with income below the poverty level (%) - Other Race
Air pollution - Air Quality Index (AQI)
Air pollution - CO
Air pollution - NO2
Air pollution - SO2
Air pollution - Ozone
Air pollution - PM10
Air pollution - PM25
Air pollution - Pb
Crime - Murders per 100,000 population
Crime - Rapes per 100,000 population
Crime - Robberies per 100,000 population
Crime - Assaults per 100,000 population
Crime - Burglaries per 100,000 population
Crime - Thefts per 100,000 population
Crime - Auto thefts per 100,000 population
Crime - Arson per 100,000 population
Crime - City-data.com crime index
Crime - Violent crime index
Crime - Property crime index
Crime - Murders per 100,000 population (5 year average)
Crime - Rapes per 100,000 population (5 year average)
Crime - Robberies per 100,000 population (5 year average)
Crime - Assaults per 100,000 population (5 year average)
Crime - Burglaries per 100,000 population (5 year average)
Crime - Thefts per 100,000 population (5 year average)
Crime - Auto thefts per 100,000 population (5 year average)
Crime - Arson per 100,000 population (5 year average)
Crime - City-data.com crime index (5 year average)
Crime - Violent crime index (5 year average)
Crime - Property crime index (5 year average)
1996 Presidential Elections Results (%) - Democratic Party (Clinton)
1996 Presidential Elections Results (%) - Republican Party (Dole)
1996 Presidential Elections Results (%) - Other
2000 Presidential Elections Results (%) - Democratic Party (Gore)
2000 Presidential Elections Results (%) - Republican Party (Bush)
2000 Presidential Elections Results (%) - Other
2004 Presidential Elections Results (%) - Democratic Party (Kerry)
2004 Presidential Elections Results (%) - Republican Party (Bush)
2004 Presidential Elections Results (%) - Other
2008 Presidential Elections Results (%) - Democratic Party (Obama)
2008 Presidential Elections Results (%) - Republican Party (McCain)
2008 Presidential Elections Results (%) - Other
2012 Presidential Elections Results (%) - Democratic Party (Obama)
2012 Presidential Elections Results (%) - Republican Party (Romney)
2012 Presidential Elections Results (%) - Other
2016 Presidential Elections Results (%) - Democratic Party (Clinton)
2016 Presidential Elections Results (%) - Republican Party (Trump)
2016 Presidential Elections Results (%) - Other
2020 Presidential Elections Results (%) - Democratic Party (Biden)
2020 Presidential Elections Results (%) - Republican Party (Trump)
2020 Presidential Elections Results (%) - Other
Ancestries Reported - Arab (%)
Ancestries Reported - Czech (%)
Ancestries Reported - Danish (%)
Ancestries Reported - Dutch (%)
Ancestries Reported - English (%)
Ancestries Reported - French (%)
Ancestries Reported - French Canadian (%)
Ancestries Reported - German (%)
Ancestries Reported - Greek (%)
Ancestries Reported - Hungarian (%)
Ancestries Reported - Irish (%)
Ancestries Reported - Italian (%)
Ancestries Reported - Lithuanian (%)
Ancestries Reported - Norwegian (%)
Ancestries Reported - Polish (%)
Ancestries Reported - Portuguese (%)
Ancestries Reported - Russian (%)
Ancestries Reported - Scotch-Irish (%)
Ancestries Reported - Scottish (%)
Ancestries Reported - Slovak (%)
Ancestries Reported - Subsaharan African (%)
Ancestries Reported - Swedish (%)
Ancestries Reported - Swiss (%)
Ancestries Reported - Ukrainian (%)
Ancestries Reported - United States (%)
Ancestries Reported - Welsh (%)
Ancestries Reported - West Indian (%)
Ancestries Reported - Other (%)
Educational Attainment - No schooling completed (%)
Educational Attainment - Less than high school (%)
Educational Attainment - High school or equivalent (%)
Educational Attainment - Less than 1 year of college (%)
Educational Attainment - 1 or more years of college (%)
Educational Attainment - Associate degree (%)
Educational Attainment - Bachelor's degree (%)
Educational Attainment - Master's degree (%)
Educational Attainment - Professional school degree (%)
Educational Attainment - Doctorate degree (%)
School Enrollment - Nursery, preschool (%)
School Enrollment - Kindergarten (%)
School Enrollment - Grade 1 to 4 (%)
School Enrollment - Grade 5 to 8 (%)
School Enrollment - Grade 9 to 12 (%)
School Enrollment - College undergrad (%)
School Enrollment - Graduate or professional (%)
School Enrollment - Not enrolled in school (%)
School enrollment - Public schools (%)
School enrollment - Private schools (%)
School enrollment - Not enrolled (%)
Median number of rooms in houses and condos
Median number of rooms in apartments
Housing units lacking complete plumbing facilities (%)
Housing units lacking complete kitchen facilities (%)
Density of houses
Urban houses (%)
Rural houses (%)
Households with people 60 years and over (%)
Households with people 65 years and over (%)
Households with people 75 years and over (%)
Households with one or more nonrelatives (%)
Households with no nonrelatives (%)
Population in households (%)
Family households (%)
Nonfamily households (%)
Population in families (%)
Family households with own children (%)
Median number of bedrooms in owner occupied houses
Mean number of bedrooms in owner occupied houses
Median number of bedrooms in renter occupied houses
Mean number of bedrooms in renter occupied houses
Median number of vehichles in owner occupied houses
Mean number of vehichles in owner occupied houses
Median number of vehichles in renter occupied houses
Mean number of vehichles in renter occupied houses
Mortgage status - with mortgage (%)
Mortgage status - with second mortgage (%)
Mortgage status - with home equity loan (%)
Mortgage status - with both second mortgage and home equity loan (%)
Mortgage status - without a mortgage (%)
Average family size
Average family size - White
Average family size - Black or African American
Average family size - Asian
Average family size - Hispanic or Latino
Average family size - American Indian and Alaska Native
Average family size - Multirace
Average family size - Other Race
Geographical mobility - Same house 1 year ago (%)
Geographical mobility - Moved within same county (%)
Geographical mobility - Moved from different county within same state (%)
Geographical mobility - Moved from different state (%)
Geographical mobility - Moved from abroad (%)
Place of birth - Born in state of residence (%)
Place of birth - Born in other state (%)
Place of birth - Native, outside of US (%)
Place of birth - Foreign born (%)
Housing units in structures - 1, detached (%)
Housing units in structures - 1, attached (%)
Housing units in structures - 2 (%)
Housing units in structures - 3 or 4 (%)
Housing units in structures - 5 to 9 (%)
Housing units in structures - 10 to 19 (%)
Housing units in structures - 20 to 49 (%)
Housing units in structures - 50 or more (%)
Housing units in structures - Mobile home (%)
Housing units in structures - Boat, RV, van, etc. (%)
House/condo owner moved in on average (years ago)
Renter moved in on average (years ago)
Year householder moved into unit - Moved in 1999 to March 2000 (%)
Year householder moved into unit - Moved in 1995 to 1998 (%)
Year householder moved into unit - Moved in 1990 to 1994 (%)
Year householder moved into unit - Moved in 1980 to 1989 (%)
Year householder moved into unit - Moved in 1970 to 1979 (%)
Year householder moved into unit - Moved in 1969 or earlier (%)
Means of transportation to work - Drove car alone (%)
Means of transportation to work - Carpooled (%)
Means of transportation to work - Public transportation (%)
Means of transportation to work - Bus or trolley bus (%)
Means of transportation to work - Streetcar or trolley car (%)
Means of transportation to work - Subway or elevated (%)
Means of transportation to work - Railroad (%)
Means of transportation to work - Ferryboat (%)
Means of transportation to work - Taxicab (%)
Means of transportation to work - Motorcycle (%)
Means of transportation to work - Bicycle (%)
Means of transportation to work - Walked (%)
Means of transportation to work - Other means (%)
Working at home (%)
Industry diversity
Most Common Industries - Agriculture, forestry, fishing and hunting, and mining (%)
Most Common Industries - Agriculture, forestry, fishing and hunting (%)
Most Common Industries - Mining, quarrying, and oil and gas extraction (%)
Most Common Industries - Construction (%)
Most Common Industries - Manufacturing (%)
Most Common Industries - Wholesale trade (%)
Most Common Industries - Retail trade (%)
Most Common Industries - Transportation and warehousing, and utilities (%)
Most Common Industries - Transportation and warehousing (%)
Most Common Industries - Utilities (%)
Most Common Industries - Information (%)
Most Common Industries - Finance and insurance, and real estate and rental and leasing (%)
Most Common Industries - Finance and insurance (%)
Most Common Industries - Real estate and rental and leasing (%)
Most Common Industries - Professional, scientific, and management, and administrative and waste management services (%)
Most Common Industries - Professional, scientific, and technical services (%)
Most Common Industries - Management of companies and enterprises (%)
Most Common Industries - Administrative and support and waste management services (%)
Most Common Industries - Educational services, and health care and social assistance (%)
Most Common Industries - Educational services (%)
Most Common Industries - Health care and social assistance (%)
Most Common Industries - Arts, entertainment, and recreation, and accommodation and food services (%)
Most Common Industries - Arts, entertainment, and recreation (%)
Most Common Industries - Accommodation and food services (%)
Most Common Industries - Other services, except public administration (%)
Most Common Industries - Public administration (%)
Occupation diversity
Most Common Occupations - Management, business, science, and arts occupations (%)
Most Common Occupations - Management, business, and financial occupations (%)
Most Common Occupations - Management occupations (%)
Most Common Occupations - Business and financial operations occupations (%)
Most Common Occupations - Computer, engineering, and science occupations (%)
Most Common Occupations - Computer and mathematical occupations (%)
Most Common Occupations - Architecture and engineering occupations (%)
Most Common Occupations - Life, physical, and social science occupations (%)
Most Common Occupations - Education, legal, community service, arts, and media occupations (%)
Most Common Occupations - Community and social service occupations (%)
Most Common Occupations - Legal occupations (%)
Most Common Occupations - Education, training, and library occupations (%)
Most Common Occupations - Arts, design, entertainment, sports, and media occupations (%)
Most Common Occupations - Healthcare practitioners and technical occupations (%)
Most Common Occupations - Health diagnosing and treating practitioners and other technical occupations (%)
Most Common Occupations - Health technologists and technicians (%)
Most Common Occupations - Service occupations (%)
Most Common Occupations - Healthcare support occupations (%)
Most Common Occupations - Protective service occupations (%)
Most Common Occupations - Fire fighting and prevention, and other protective service workers including supervisors (%)
Most Common Occupations - Law enforcement workers including supervisors (%)
Most Common Occupations - Food preparation and serving related occupations (%)
Most Common Occupations - Building and grounds cleaning and maintenance occupations (%)
Most Common Occupations - Personal care and service occupations (%)
Most Common Occupations - Sales and office occupations (%)
Most Common Occupations - Sales and related occupations (%)
Most Common Occupations - Office and administrative support occupations (%)
Most Common Occupations - Natural resources, construction, and maintenance occupations (%)
Most Common Occupations - Farming, fishing, and forestry occupations (%)
Most Common Occupations - Construction and extraction occupations (%)
Most Common Occupations - Installation, maintenance, and repair occupations (%)
Most Common Occupations - Production, transportation, and material moving occupations (%)
Most Common Occupations - Production occupations (%)
Most Common Occupations - Transportation occupations (%)
Most Common Occupations - Material moving occupations (%)
People in Group quarters - Institutionalized population (%)
People in Group quarters - Correctional institutions (%)
People in Group quarters - Federal prisons and detention centers (%)
People in Group quarters - Halfway houses (%)
People in Group quarters - Local jails and other confinement facilities (including police lockups) (%)
People in Group quarters - Military disciplinary barracks (%)
People in Group quarters - State prisons (%)
People in Group quarters - Other types of correctional institutions (%)
People in Group quarters - Nursing homes (%)
People in Group quarters - Hospitals/wards, hospices, and schools for the handicapped (%)
People in Group quarters - Hospitals/wards and hospices for chronically ill (%)
People in Group quarters - Hospices or homes for chronically ill (%)
People in Group quarters - Military hospitals or wards for chronically ill (%)
People in Group quarters - Other hospitals or wards for chronically ill (%)
People in Group quarters - Hospitals or wards for drug/alcohol abuse (%)
People in Group quarters - Mental (Psychiatric) hospitals or wards (%)
People in Group quarters - Schools, hospitals, or wards for the mentally retarded (%)
People in Group quarters - Schools, hospitals, or wards for the physically handicapped (%)
People in Group quarters - Institutions for the deaf (%)
People in Group quarters - Institutions for the blind (%)
People in Group quarters - Orthopedic wards and institutions for the physically handicapped (%)
People in Group quarters - Wards in general hospitals for patients who have no usual home elsewhere (%)
People in Group quarters - Wards in military hospitals for patients who have no usual home elsewhere (%)
People in Group quarters - Juvenile institutions (%)
People in Group quarters - Long-term care (%)
People in Group quarters - Homes for abused, dependent, and neglected children (%)
People in Group quarters - Residential treatment centers for emotionally disturbed children (%)
People in Group quarters - Training schools for juvenile delinquents (%)
People in Group quarters - Short-term care, detention or diagnostic centers for delinquent children (%)
People in Group quarters - Type of juvenile institution unknown (%)
People in Group quarters - Noninstitutionalized population (%)
People in Group quarters - College dormitories (includes college quarters off campus) (%)
People in Group quarters - Military quarters (%)
People in Group quarters - On base (%)
People in Group quarters - Barracks, unaccompanied personnel housing (UPH), (Enlisted/Officer), ;and similar group living quarters for military personnel (%)
People in Group quarters - Transient quarters for temporary residents (%)
People in Group quarters - Military ships (%)
People in Group quarters - Group homes (%)
People in Group quarters - Homes or halfway houses for drug/alcohol abuse (%)
People in Group quarters - Homes for the mentally ill (%)
People in Group quarters - Homes for the mentally retarded (%)
People in Group quarters - Homes for the physically handicapped (%)
People in Group quarters - Other group homes (%)
People in Group quarters - Religious group quarters (%)
People in Group quarters - Dormitories (%)
People in Group quarters - Agriculture workers' dormitories on farms (%)
People in Group quarters - Job Corps and vocational training facilities (%)
People in Group quarters - Other workers' dormitories (%)
People in Group quarters - Crews of maritime vessels (%)
People in Group quarters - Other nonhousehold living situations (%)
People in Group quarters - Other noninstitutional group quarters (%)
Residents speaking English at home (%)
Residents speaking English at home - Born in the United States (%)
Residents speaking English at home - Native, born elsewhere (%)
Residents speaking English at home - Foreign born (%)
Residents speaking Spanish at home (%)
Residents speaking Spanish at home - Born in the United States (%)
Residents speaking Spanish at home - Native, born elsewhere (%)
Residents speaking Spanish at home - Foreign born (%)
Residents speaking other language at home (%)
Residents speaking other language at home - Born in the United States (%)
Residents speaking other language at home - Native, born elsewhere (%)
Residents speaking other language at home - Foreign born (%)
Class of Workers - Employee of private company (%)
Class of Workers - Self-employed in own incorporated business (%)
Class of Workers - Private not-for-profit wage and salary workers (%)
Class of Workers - Local government workers (%)
Class of Workers - State government workers (%)
Class of Workers - Federal government workers (%)
Class of Workers - Self-employed workers in own not incorporated business and Unpaid family workers (%)
House heating fuel used in houses and condos - Utility gas (%)
House heating fuel used in houses and condos - Bottled, tank, or LP gas (%)
House heating fuel used in houses and condos - Electricity (%)
House heating fuel used in houses and condos - Fuel oil, kerosene, etc. (%)
House heating fuel used in houses and condos - Coal or coke (%)
House heating fuel used in houses and condos - Wood (%)
House heating fuel used in houses and condos - Solar energy (%)
House heating fuel used in houses and condos - Other fuel (%)
House heating fuel used in houses and condos - No fuel used (%)
House heating fuel used in apartments - Utility gas (%)
House heating fuel used in apartments - Bottled, tank, or LP gas (%)
House heating fuel used in apartments - Electricity (%)
House heating fuel used in apartments - Fuel oil, kerosene, etc. (%)
House heating fuel used in apartments - Coal or coke (%)
House heating fuel used in apartments - Wood (%)
House heating fuel used in apartments - Solar energy (%)
House heating fuel used in apartments - Other fuel (%)
House heating fuel used in apartments - No fuel used (%)
Armed forces status - In Armed Forces (%)
Armed forces status - Civilian (%)
Armed forces status - Civilian - Veteran (%)
Armed forces status - Civilian - Nonveteran (%)
Fatal accidents locations in years 2005-2021
Fatal accidents locations in 2005
Fatal accidents locations in 2006
Fatal accidents locations in 2007
Fatal accidents locations in 2008
Fatal accidents locations in 2009
Fatal accidents locations in 2010
Fatal accidents locations in 2011
Fatal accidents locations in 2012
Fatal accidents locations in 2013
Fatal accidents locations in 2014
Fatal accidents locations in 2015
Fatal accidents locations in 2016
Fatal accidents locations in 2017
Fatal accidents locations in 2018
Fatal accidents locations in 2019
Fatal accidents locations in 2020
Fatal accidents locations in 2021
Alcohol use - People drinking some alcohol every month (%)
Alcohol use - People not drinking at all (%)
Alcohol use - Average days/month drinking alcohol
Alcohol use - Average drinks/week
Alcohol use - Average days/year people drink much
Audiometry - Average condition of hearing (%)
Audiometry - People that can hear a whisper from across a quiet room (%)
Audiometry - People that can hear normal voice from across a quiet room (%)
Audiometry - Ears ringing, roaring, buzzing (%)
Audiometry - Had a job exposure to loud noise (%)
Audiometry - Had off-work exposure to loud noise (%)
Blood Pressure & Cholesterol - Has high blood pressure (%)
Blood Pressure & Cholesterol - Checking blood pressure at home (%)
Blood Pressure & Cholesterol - Frequently checking blood cholesterol (%)
Blood Pressure & Cholesterol - Has high cholesterol level (%)
Consumer Behavior - Money monthly spent on food at supermarket/grocery store
Consumer Behavior - Money monthly spent on food at other stores
Consumer Behavior - Money monthly spent on eating out
Consumer Behavior - Money monthly spent on carryout/delivered foods
Consumer Behavior - Income spent on food at supermarket/grocery store (%)
Consumer Behavior - Income spent on food at other stores (%)
Consumer Behavior - Income spent on eating out (%)
Consumer Behavior - Income spent on carryout/delivered foods (%)
Current Health Status - General health condition (%)
Current Health Status - Blood donors (%)
Current Health Status - Has blood ever tested for HIV virus (%)
Current Health Status - Left-handed people (%)
Dermatology - People using sunscreen (%)
Diabetes - Diabetics (%)
Diabetes - Had a blood test for high blood sugar (%)
Diabetes - People taking insulin (%)
Diet Behavior & Nutrition - Diet health (%)
Diet Behavior & Nutrition - Milk product consumption (# of products/month)
Diet Behavior & Nutrition - Meals not home prepared (#/week)
Diet Behavior & Nutrition - Meals from fast food or pizza place (#/week)
Diet Behavior & Nutrition - Ready-to-eat foods (#/month)
Diet Behavior & Nutrition - Frozen meals/pizza (#/month)
Drug Use - People that ever used marijuana or hashish (%)
Drug Use - Ever used hard drugs (%)
Drug Use - Ever used any form of cocaine (%)
Drug Use - Ever used heroin (%)
Drug Use - Ever used methamphetamine (%)
Health Insurance - People covered by health insurance (%)
Kidney Conditions-Urology - Avg. # of times urinating at night
Medical Conditions - People with asthma (%)
Medical Conditions - People with anemia (%)
Medical Conditions - People with psoriasis (%)
Medical Conditions - People with overweight (%)
Medical Conditions - Elderly people having difficulties in thinking or remembering (%)
Medical Conditions - People who ever received blood transfusion (%)
Medical Conditions - People having trouble seeing even with glass/contacts (%)
Medical Conditions - People with arthritis (%)
Medical Conditions - People with gout (%)
Medical Conditions - People with congestive heart failure (%)
Medical Conditions - People with coronary heart disease (%)
Medical Conditions - People with angina pectoris (%)
Medical Conditions - People who ever had heart attack (%)
Medical Conditions - People who ever had stroke (%)
Medical Conditions - People with emphysema (%)
Medical Conditions - People with thyroid problem (%)
Medical Conditions - People with chronic bronchitis (%)
Medical Conditions - People with any liver condition (%)
Medical Conditions - People who ever had cancer or malignancy (%)
Mental Health - People who have little interest in doing things (%)
Mental Health - People feeling down, depressed, or hopeless (%)
Mental Health - People who have trouble sleeping or sleeping too much (%)
Mental Health - People feeling tired or having little energy (%)
Mental Health - People with poor appetite or overeating (%)
Mental Health - People feeling bad about themself (%)
Mental Health - People who have trouble concentrating on things (%)
Mental Health - People moving or speaking slowly or too fast (%)
Mental Health - People having thoughts they would be better off dead (%)
Oral Health - Average years since last visit a dentist
Oral Health - People embarrassed because of mouth (%)
Oral Health - People with gum disease (%)
Oral Health - General health of teeth and gums (%)
Oral Health - Average days a week using dental floss/device
Oral Health - Average days a week using mouthwash for dental problem
Oral Health - Average number of teeth
Pesticide Use - Households using pesticides to control insects (%)
Pesticide Use - Households using pesticides to kill weeds (%)
Physical Activity - People doing vigorous-intensity work activities (%)
Physical Activity - People doing moderate-intensity work activities (%)
Physical Activity - People walking or bicycling (%)
Physical Activity - People doing vigorous-intensity recreational activities (%)
Physical Activity - People doing moderate-intensity recreational activities (%)
Physical Activity - Average hours a day doing sedentary activities
Physical Activity - Average hours a day watching TV or videos
Physical Activity - Average hours a day using computer
Physical Functioning - People having limitations keeping them from working (%)
Physical Functioning - People limited in amount of work they can do (%)
Physical Functioning - People that need special equipment to walk (%)
Physical Functioning - People experiencing confusion/memory problems (%)
Physical Functioning - People requiring special healthcare equipment (%)
Prescription Medications - Average number of prescription medicines taking
Preventive Aspirin Use - Adults 40+ taking low-dose aspirin (%)
Reproductive Health - Vaginal deliveries (%)
Reproductive Health - Cesarean deliveries (%)
Reproductive Health - Deliveries resulted in a live birth (%)
Reproductive Health - Pregnancies resulted in a delivery (%)
Reproductive Health - Women breastfeeding newborns (%)
Reproductive Health - Women that had a hysterectomy (%)
Reproductive Health - Women that had both ovaries removed (%)
Reproductive Health - Women that have ever taken birth control pills (%)
Reproductive Health - Women taking birth control pills (%)
Reproductive Health - Women that have ever used Depo-Provera or injectables (%)
Reproductive Health - Women that have ever used female hormones (%)
Sexual Behavior - People 18+ that ever had sex (vaginal, anal, or oral) (%)
Sexual Behavior - Males 18+ that ever had vaginal sex with a woman (%)
Sexual Behavior - Males 18+ that ever performed oral sex on a woman (%)
Sexual Behavior - Males 18+ that ever had anal sex with a woman (%)
Sexual Behavior - Males 18+ that ever had any sex with a man (%)
Sexual Behavior - Females 18+ that ever had vaginal sex with a man (%)
Sexual Behavior - Females 18+ that ever performed oral sex on a man (%)
Sexual Behavior - Females 18+ that ever had anal sex with a man (%)
Sexual Behavior - Females 18+ that ever had any kind of sex with a woman (%)
Sexual Behavior - Average age people first had sex
Sexual Behavior - Average number of female sex partners in lifetime (males 18+)
Sexual Behavior - Average number of female vaginal sex partners in lifetime (males 18+)
Sexual Behavior - Average age people first performed oral sex on a woman (18+)
Sexual Behavior - Average number of woman performed oral sex on in lifetime (18+)
Sexual Behavior - Average number of male sex partners in lifetime (males 18+)
Sexual Behavior - Average number of male anal sex partners in lifetime (males 18+)
Sexual Behavior - Average age people first performed oral sex on a man (18+)
Sexual Behavior - Average number of male oral sex partners in lifetime (18+)
Sexual Behavior - People using protection when performing oral sex (%)
Sexual Behavior - Average number of times people have vaginal or anal sex a year
Sexual Behavior - People having sex without condom (%)
Sexual Behavior - Average number of male sex partners in lifetime (females 18+)
Sexual Behavior - Average number of male vaginal sex partners in lifetime (females 18+)
Sexual Behavior - Average number of female sex partners in lifetime (females 18+)
Sexual Behavior - Circumcised males 18+ (%)
Sleep Disorders - Average hours sleeping at night
Sleep Disorders - People that has trouble sleeping (%)
Smoking-Cigarette Use - People smoking cigarettes (%)
Taste & Smell - People 40+ having problems with smell (%)
Taste & Smell - People 40+ having problems with taste (%)
Taste & Smell - People 40+ that ever had wisdom teeth removed (%)
Taste & Smell - People 40+ that ever had tonsils teeth removed (%)
Taste & Smell - People 40+ that ever had a loss of consciousness because of a head injury (%)
Taste & Smell - People 40+ that ever had a broken nose or other serious injury to face or skull (%)
Taste & Smell - People 40+ that ever had two or more sinus infections (%)
Weight - Average height (inches)
Weight - Average weight (pounds)
Weight - Average BMI
Weight - People that are obese (%)
Weight - People that ever were obese (%)
Weight - People trying to lose weight (%)
Urban population: 18,313
Rural population: 297
Estimated median house/condo value in 2022: $171,141
77707:
$171,141Texas:
$275,400
According to our research of Texas and other state lists, there were 40 registered sex offenders living in 77707 zip code as of April 27, 2024 . The ratio of all residents to sex offenders in zip code 77707 is 451 to 1.The ratio of registered sex offenders to all residents in this zip code is near the state average.
Median resident age: This zip code:
35.2 yearsTexas median age:
35.6 years
Average household size: This zip code:
2.7 peopleTexas:
2.6 people
Averages for the 2020 tax year for zip code 77707, filed in 2021:
Average Adjusted Gross Income (AGI) in 2020: $62,208 (Individual Income Tax Returns) Here:
$62,208State:
$77,054
Salary/wage: $50,264 (reported on 83.0% of returns )Here:
$50,264State:
$62,766
(% of AGI for various income ranges: 1189.4% for AGIs below $25k , 3483.9% for AGIs $25k-50k , 6310.4% for AGIs $50k-75k , 9242.3% for AGIs $75k-100k , 15833.6% for AGIs $100k-200k , 65553.3% for AGIs over 200k ) Taxable interest for individuals: $2,375 (reported on 23.0% of returns )This zip code:
$2,375Texas:
$2,665
(% of AGI for various income ranges: 7.3% for AGIs below $25k , 12.0% for AGIs $25k-50k , 31.8% for AGIs $50k-75k , 42.7% for AGIs $75k-100k , 97.9% for AGIs $100k-200k , 3287.8% for AGIs over 200k ) Ordinary dividends: $8,543 (reported on 11.7% of returns )(% of AGI for various income ranges: 12.2% for AGIs below $25k , 21.0% for AGIs $25k-50k , 59.5% for AGIs $50k-75k , 114.5% for AGIs $75k-100k , 332.9% for AGIs $100k-200k , 4913.3% for AGIs over 200k ) Net capital gain/loss in AGI: +$27,401 (reported on 10.8% of returns )Here:
+$27,401State:
+$39,590
(% of AGI for various income ranges: 7.7% for AGIs below $25k , 9.3% for AGIs $25k-50k , 64.3% for AGIs $50k-75k , 107.7% for AGIs $75k-100k , 349.6% for AGIs $100k-200k , 22502.2% for AGIs over 200k ) Profit/loss from business: +$4,071 (reported on 19.8% of returns )Here:
+$4,071State:
+$10,888
(% of AGI for various income ranges: 43.4% for AGIs below $25k , 46.4% for AGIs $75k-100k , 300.4% for AGIs $100k-200k , 4315.6% for AGIs over 200k ) Taxable individual retirement arrangement distribution: $26,348 (reported on 8.2% of returns )77707:
$26,348Texas:
$24,740
(% of AGI for various income ranges: 35.4% for AGIs below $25k , 83.3% for AGIs $25k-50k , 249.4% for AGIs $50k-75k , 488.2% for AGIs $75k-100k , 1207.5% for AGIs $100k-200k , 4244.4% for AGIs over 200k ) Total itemized deductions: $39,000 (reported on 9.3% of returns )Here:
$39,000State:
$40,428
(% of AGI for various income ranges: 41.0% for AGIs below $25k , 244.3% for AGIs $25k-50k , 600.8% for AGIs $50k-75k , 703.4% for AGIs $75k-100k , 1448.6% for AGIs $100k-200k , 8107.8% for AGIs over 200k ) Charity contributions: $15,189 (reported on 6.7% of returns )Here:
$15,189State:
$18,201
(% of AGI for various income ranges: 4.5% for AGIs below $25k , 49.7% for AGIs $25k-50k , 126.0% for AGIs $50k-75k , 144.3% for AGIs $75k-100k , 407.7% for AGIs $100k-200k , 3423.3% for AGIs over 200k ) Taxes paid: $6,372 (reported on 7.3% of returns )(% of AGI for various income ranges: 4.1% for AGIs below $25k , 23.6% for AGIs $25k-50k , 76.4% for AGIs $50k-75k , 88.0% for AGIs $75k-100k , 218.9% for AGIs $100k-200k , 1030.0% for AGIs over 200k ) Earned income credit: $2,602 (reported on 24.2% of returns )(% of AGI for various income ranges: 142.4% for AGIs below $25k , 94.2% for AGIs $25k-50k ) Percentage of individuals using paid preparers for their 2020 taxes: 89.9%(% for various income ranges: 88.9% for AGIs below $25k , 91.7% for AGIs $25k-50k , 90.7% for AGIs $50k-75k , 87.5% for AGIs $75k-100k , 89.0% for AGIs $100k-200k , 92.9% for AGIs over 200k )
Averages for the 2012 tax year for zip code 77707, filed in 2013:
Average Adjusted Gross Income (AGI) in 2012: $59,520 (Individual Income Tax Returns) Here:
$59,520State:
$65,384
Salary/wage: $47,915 (reported on 85.0% of returns )Here:
$47,915State:
$52,524
(% of AGI for various income ranges: 79.2% for AGIs below $25k , 82.9% for AGIs $25k-50k , 78.1% for AGIs $50k-75k , 78.9% for AGIs $75k-100k , 77.2% for AGIs $100k-200k , 40.7% for AGIs over 200k ) Taxable interest for individuals: $1,848 (reported on 27.1% of returns )This zip code:
$1,848Texas:
$2,372
(% of AGI for various income ranges: 0.8% for AGIs below $25k , 0.5% for AGIs $25k-50k , 0.5% for AGIs $50k-75k , 0.4% for AGIs $75k-100k , 0.4% for AGIs $100k-200k , 1.8% for AGIs over 200k ) Ordinary dividends: $7,553 (reported on 15.0% of returns )(% of AGI for various income ranges: 1.6% for AGIs below $25k , 1.0% for AGIs $25k-50k , 0.8% for AGIs $50k-75k , 1.0% for AGIs $75k-100k , 1.4% for AGIs $100k-200k , 3.8% for AGIs over 200k ) Net capital gain/loss in AGI: +$12,816 (reported on 9.6% of returns )Here:
+$12,816State:
+$35,319
(% of AGI for various income ranges: 0.2% for AGIs $50k-75k , 1.4% for AGIs $100k-200k , 6.2% for AGIs over 200k ) Profit/loss from business: +$10,445 (reported on 16.6% of returns )Here:
+$10,445State:
+$13,732
(% of AGI for various income ranges: 6.2% for AGIs below $25k , 1.3% for AGIs $25k-50k , 1.7% for AGIs $50k-75k , 1.5% for AGIs $75k-100k , 2.4% for AGIs $100k-200k , 4.3% for AGIs over 200k ) Taxable individual retirement arrangement distribution: $20,826 (reported on 10.0% of returns )77707:
$20,826Texas:
$19,511
(% of AGI for various income ranges: 2.9% for AGIs below $25k , 2.6% for AGIs $25k-50k , 3.4% for AGIs $50k-75k , 5.2% for AGIs $75k-100k , 5.1% for AGIs $100k-200k , 2.2% for AGIs over 200k ) Self-employment retirement plans: $32,550 (reported on 0.3% of returns )77707:
$32,550Texas:
$23,938
Total itemized deductions: $24,430 (20% of AGI, reported on 26.7% of returns )Here:
$24,430State:
$24,724
Here:
19.6% of AGIState:
15.9% of AGI
(% of AGI for various income ranges: 6.8% for AGIs below $25k , 9.9% for AGIs $25k-50k , 13.0% for AGIs $50k-75k , 11.0% for AGIs $75k-100k , 11.3% for AGIs $100k-200k , 11.6% for AGIs over 200k ) Charity contributions: $7,956 (reported on 22.2% of returns )(% of AGI for various income ranges: 1.0% for AGIs below $25k , 1.9% for AGIs $25k-50k , 3.1% for AGIs $50k-75k , 2.5% for AGIs $75k-100k , 3.2% for AGIs $100k-200k , 4.1% for AGIs over 200k ) Taxes paid: $5,447 (reported on 26.2% of returns )(% of AGI for various income ranges: 1.3% for AGIs below $25k , 2.0% for AGIs $25k-50k , 2.7% for AGIs $50k-75k , 2.7% for AGIs $75k-100k , 3.1% for AGIs $100k-200k , 2.1% for AGIs over 200k ) Earned income credit: $2,578 (reported on 22.0% of returns )(% of AGI for various income ranges: 8.9% for AGIs below $25k , 1.2% for AGIs $25k-50k ) Percentage of individuals using paid preparers for their 2012 taxes: 54.5%(% for various income ranges: 51.0% for AGIs below $25k , 53.2% for AGIs $25k-50k , 54.5% for AGIs $50k-75k , 60.3% for AGIs $75k-100k , 59.5% for AGIs $100k-200k , 81.0% for AGIs over 200k )
Averages for the 2004 tax year for zip code 77707, filed in 2005:
Average Adjusted Gross Income (AGI) in 2004: $46,127 (Individual Income Tax Returns) Here:
$46,127State:
$47,881
Salary/wage: $41,272 (reported on 85.3% of returns )Here:
$41,272State:
$41,947
(% of AGI for various income ranges: 110.2% for AGIs below $10k , 78.4% for AGIs $10k-25k , 82.5% for AGIs $25k-50k , 81.6% for AGIs $50k-75k , 80.2% for AGIs $75k-100k , 66.6% for AGIs over 100k ) Taxable interest for individuals: $1,851 (reported on 40.0% of returns )This zip code:
$1,851Texas:
$2,255
(% of AGI for various income ranges: 6.6% for AGIs below $10k , 2.3% for AGIs $10k-25k , 1.6% for AGIs $25k-50k , 1.3% for AGIs $50k-75k , 1.3% for AGIs $75k-100k , 1.5% for AGIs over 100k ) Taxable dividends: $2,830 (reported on 20.9% of returns )(% of AGI for various income ranges: 2.9% for AGIs below $10k , 1.6% for AGIs $10k-25k , 0.8% for AGIs $25k-50k , 1.0% for AGIs $50k-75k , 0.7% for AGIs $75k-100k , 1.7% for AGIs over 100k ) Net capital gain/loss: +$8,609 (reported on 16.3% of returns )Here:
+$8,609State:
+$16,110
(% of AGI for various income ranges: -1.2% for AGIs below $10k , -0.0% for AGIs $10k-25k , 0.1% for AGIs $25k-50k , 0.4% for AGIs $50k-75k , 0.8% for AGIs $75k-100k , 8.0% for AGIs over 100k ) Profit/loss from business: +$7,198 (reported on 15.9% of returns )Here:
+$7,198State:
+$11,013
(% of AGI for various income ranges: 0.6% for AGIs below $10k , 3.2% for AGIs $10k-25k , 1.0% for AGIs $25k-50k , 0.3% for AGIs $50k-75k , 1.3% for AGIs $75k-100k , 4.8% for AGIs over 100k ) IRA payment deduction: $2,964 (reported on 1.6% of returns )(% of AGI for various income ranges: 0.1% for AGIs $10k-25k , 0.2% for AGIs $25k-50k , 0.1% for AGIs $50k-75k , 0.1% for AGIs $75k-100k , 0.1% for AGIs over 100k ) Self-employed pension: $22,259 (reported on 0.4% of returns )Here:
$22,259Texas:
$16,401
Total itemized deductions: $17,814 (21% of AGI, reported on 27.3% of returns )Here:
$17,814State:
$19,631
Here:
21.3% of AGIState:
18.9% of AGI
(% of AGI for various income ranges: 10.8% for AGIs below $10k , 8.3% for AGIs $10k-25k , 11.4% for AGIs $25k-50k , 11.4% for AGIs $50k-75k , 12.0% for AGIs $75k-100k , 9.6% for AGIs over 100k ) Charity contributions deductions: $4,964 (6% of AGI, reported on 23.9% of returns )Here:
5.7% of AGIState:
4.2% of AGI
(% of AGI for various income ranges: 0.7% for AGIs below $10k , 1.2% for AGIs $10k-25k , 2.2% for AGIs $25k-50k , 2.6% for AGIs $50k-75k , 3.0% for AGIs $75k-100k , 3.0% for AGIs over 100k ) Total tax: $7,702 (reported on 71.5% of returns )(% of AGI for various income ranges: 3.2% for AGIs below $10k , 3.6% for AGIs $10k-25k , 6.4% for AGIs $25k-50k , 8.9% for AGIs $50k-75k , 10.8% for AGIs $75k-100k , 19.5% for AGIs over 100k ) Earned income credit: $1,982 (reported on 20.1% of returns )Percentage of individuals using paid preparers for their 2004 taxes: 56.7%(% for various income ranges: 53.4% for AGIs below $10k , 59.5% for AGIs $10k-25k , 57.5% for AGIs $25k-50k , 53.1% for AGIs $50k-75k , 54.4% for AGIs $75k-100k , 61.5% for AGIs over 100k )
Estimated median household income in 2022: This zip code:
$63,881Texas:
$72,284
Nearest zip codes: 77706 ,
77702 ,
77701 ,
77713 ,
77708 ,
77703 .
Beaumont Zip Code Map
Percentage of family households: This zip code:
53.8%Texas:
50.5%
Percentage of households with unmarried partners: This zip code:
3.9%Texas:
48.7%
Likely homosexual households (counted as self-reported same-sex unmarried-partner households)
Lesbian couples: 0.1% of all households Gay men: 0.0% of all households
Household received Food Stamps/SNAP in the past 12 months: 993Household did not receive Food Stamps/SNAP in the past 12 months: 5,672
Women who had a birth in the past 12 months: 163 (50 now married , 109 unmarried) Women who did not have a birth in the past 12 months: 4,154 (1,885 now married , 2,266 unmarried)
Housing units in zip code 77707 with a mortgage: 2,557 (57
second mortgage , 30
both second mortgage and home equity loan )
Houses without a mortgage: 68
Median monthly owner costs for units with a mortgage: $1,584
Median monthly owner costs for units without a mortgage: $585
Residents with income below the poverty level in 2022:
This zip code:
18.1%Whole state:
14.0%
Residents with income below 50% of the poverty level in 2022:
This zip code:
9.2%Whole state:
7.4%
Median number of rooms in houses and condos: Median number of rooms in apartments: Notable locations in this zip code not listed on our city pages
Click to draw/clear zip code borders Notable locations in zip code 77707: (A) , Beaumont Fire and Rescue Station 5 (B) . Display/hide their locations on the map
Churches in zip code 77707 include: (A) , Cornerstone Church (B) , Forest Park Church (C) , Seventh Day Adventist Church (D) , Presbyterian Saint Andrews Church (E) , United Pentecostal Church (F) , Amelia United Pentecostal Church (G) , Forest Park United Methodist Church (H) , Saint Johns Lutheran Church (I) . Display/hide their locations on the map
Parks in zip code 77707 include: (1) , Perlstein Park (2) , Municipal Athletic Complex (3) . Display/hide their locations on the map
Year house built (houses)
14 2020 or later295 2010 to 2019651 2000 to 2009856 1990 to 1999947 1980 to 19891,536 1970 to 19791,507 1960 to 1969820 1950 to 1959302 1940 to 194927 1939 or earlier
Zip code 77707 household income distribution in 2022 338 Less than $10,000289 $10,000 to $14,999293 $15,000 to $19,999197 $20,000 to $24,999238 $25,000 to $29,999289 $30,000 to $34,999278 $35,000 to $39,999447 $40,000 to $44,999181 $45,000 to $49,999398 $50,000 to $59,999998 $60,000 to $74,999818 $75,000 to $99,999754 $100,000 to $124,999333 $125,000 to $149,999417 $150,000 to $199,999399 $200,000 or moreEstimate of home value of owner-occupied houses/condos in 2022 in zip code 77707 69 Less than $10,0005 $10,000 to $14,99921 $15,000 to $19,99922 $25,000 to $29,99960 $30,000 to $34,99910 $35,000 to $39,99984 $40,000 to $49,99924 $50,000 to $59,99987 $60,000 to $69,99979 $70,000 to $79,999156 $80,000 to $89,999269 $90,000 to $99,999330 $100,000 to $124,999535 $125,000 to $149,999423 $150,000 to $174,999314 $175,000 to $199,999448 $200,000 to $249,999280 $250,000 to $299,999387 $300,000 to $399,999124 $400,000 to $499,999115 $500,000 to $749,99993 $750,000 to $999,99912 $1,000,000 to $1,499,999Rent paid by renters in 2022 in zip code 77707 52 $100 to $14920 $150 to $199115 $250 to $29915 $350 to $39916 $400 to $44912 $450 to $49958 $500 to $54978 $550 to $599264 $600 to $64978 $650 to $69964 $700 to $749206 $800 to $899290 $900 to $999394 $1,000 to $1,249198 $1,250 to $1,49915 $1,500 to $1,99956 No cash rent
Median gross rent in 2022: $1,153.
Median price asked for vacant for-sale houses and condos in 2022: $245,269.
Estimated median house (or condo) value in 2022 for: White Non-Hispanic householders: $173,390Black or African American householders: $184,133American Indian or Alaska Native householders: $162,396Asian householders: $176,388Some other race householders: $154,152Two or more races householders: $132,415Hispanic or Latino householders: $122,922Estimated median house or condo value in 2022: $171,141
77707:
$171,141Texas:
$275,400
Lower value quartile - upper value quartile: $117,363 - $253,469
Mean price in 2022: Detached houses: $212,890Here:
$212,890State:
$369,058
Townhouses or other attached units: $201,277Here:
$201,277State:
$327,631
Mobile homes: $80,225Here:
$80,225State:
$124,413
Housing units in structures:
One, detached: 5,383One, attached: 524Two: 193 or 4: 2505 to 9: 30910 to 19: 38420 to 49: 1850 or more: 95Mobile homes: 436Unemployment : 3.9%
Means of transportation to work in zip code 77707 81.5% 6,753 Drove a car alone6.9% 569 Carpooled0.4% 37 Motorcycle1.5% 122 Walked1.8% 146 Other means5.3% 435 Worked at homeTravel time to work (commute) in zip code 77707 184 Less than 5 minutes575 5 to 9 minutes1,268 10 to 14 minutes1,898 15 to 19 minutes1,886 20 to 24 minutes577 25 to 29 minutes811 30 to 34 minutes79 35 to 39 minutes9 40 to 44 minutes207 45 to 59 minutes71 60 to 89 minutes69 90 or more minutes
Percentage of zip code residents living and working in this county: 92.5%
Household type by relationship:
Households: 18,611
Male householders: 3,133 (905 living alone ), Female householders: 3,527 (749 living alone )3,592 spouses (3,571 opposite-sex spouses ), 275 unmarried partners , (209 opposite-sex unmarried partners ), 6,312 children (6,034 natural , 72 adopted , 204 stepchildren ), 199 grandchildren , 386 brothers or sisters , 93 parents , 0 foster children , 328 other relatives , 252 non-relatives In group quarters: 500 (-1 institutionalized population )
Size of family households: 2,286 2-persons , 751 3-persons , 789 4-persons , 618 5-persons , 257 6-persons , 67 7-or-more-persons
Size of nonfamily households: 1,654 1-person , 176 2-persons , 41 3-persons
2,850 married couples with children. single-parent households (402 men , 1,279 women ).
73.7% of residents of 77707 zip code speak English at home. of residents speak Spanish at home (55% very well, 17% well, 26% not well, 2% not at all ).of residents speak other Indo-European language at home (100% very well ).of residents speak Asian or Pacific Island language at home (66% very well, 12% well, 7% not well, 15% not at all ).of residents speak other language at home (100% very well ).
Foreign born population: 2,561 (13.8%)
(32.8%
of them are naturalized citizens )
This zip code:
13.8%Whole state:
17.2%
53% Honduras 14% El Salvador 10% Thailand 6% Bhutan 4% Zimbabwe 4% Malaysia 3% Nepal 4% English 3% Irish 2% American 2% Italian 1% German 1% French 1% European
Year of entry for the foreign-born population
683 2010 or later 825 2000 to 2009 740 1990 to 1999 375 Before 1990
There are
120 Medical Specialists in Zip Code 77707 .
Facilities with environmental interests located in this zip code:
AMELIA EL (565 S MAJOR DR in BEAUMONT, TX)
(National Center for Education Statistics) - STATE ID-123910101 Organizations: BEAUMONT ISD (SCHOOL DISTRICT)
ANGLERS MARINE (7675 COLLEGE in BEAUMONT, TX)
(Resource Conservation and Recovery Act (tracking hazardous waste))
AGGREKO INC (1185 MONTROSE in BEAUMONT, TX)
Small Quantity Generators, between 100 kg and 1000 kg of hazardous waste/month (Resource Conservation and Recovery Act (tracking hazardous waste)) - notification
AUTO SHOP ON WHEELS (9027 COLLEGE ST in BEAUMONT, TX)
Conditionally Exempt Small Quantity Generators, less than 100 kg/month of hazardous waste (Resource Conservation and Recovery Act (tracking hazardous waste)) - notification Organizations: CAROL AND WILLIAM GAUTHIER (CONTACT/OWNER)
Housing units lacking complete plumbing facilities: 0.4%
Housing units lacking complete kitchen facilities: 2.3%
67.4% Electricity 32.2% Utility gas
Population in 1990: 15,366. Population change in the 1990s: +935 (+6.1%).
Place of birth for U.S.-born residents:
This state: 12,866Northeast: 260Midwest: 561South: 1,688West: 475
58% of the 77707 zip code residents lived in the same house 5 years ago.
Out of people who lived in different houses, 60% lived in this county.
Out of people who lived in different counties, 50% lived in Texas.
93% of the 77707 zip code residents lived in the same house 1 year ago.
Out of people who lived in different houses, 76% moved from this county.
Out of people who lived in different houses, 15% moved from different county within same state.
Out of people who lived in different houses, 6% moved from different state.
Private vs. public school enrollment:
Students in private schools in grades 1 to 8 (elementary and middle school): 315
Students in private schools in grades 9 to 12 (high school): 68
Students in private undergraduate colleges:
Occupation by median earnings in the past 12 months ($)
64,069 Health diagnosing and treating practitioners and other technical occupations 61,776 Law enforcement workers including supervisors 60,278 Arts, design, entertainment, sports, and media occupations 58,780 Management occupations 58,290 Computer and mathematical occupations 56,428 Production occupations
Companies with federal contracts located in this zip code (BEAUMONT, TX):
TREYCO CONTRACTORS, INC. (1310 LINDBERGH; small business) in 2 contracts in 2000
$1,362,534 with U.S. Army Corps of Engineers - civil program financing only for Maintenance, Repair or Alteration of Real Property -- Other Conservation and Development Facilities. Signed on 2000-02-24. Completion date: 1999-11-15.
, same as above. Signed on 2000-03-21. Completion date: 1999-11-15.
POPPY''S PRODUCE (7394 COLLEGE ST; small business) in 25 contracts from 2004 to 2005
Contracts for Fruits and Vegetables by Defense Logistics AgencySigned by year: 2000: $0; 2001: $0; 2002: $0; 2003: $0; 2004: $53,516; 2005: $36,962; 2006: $0.
Biggest contracts: with Defense Logistics Agency for Fruits and Vegetables. Signed on 2004-10-22. Completion date: 2004-10-22.
, same as above. Signed on 2004-11-06. Completion date: 2004-11-06.
, same as above. Signed on 2004-10-29. Completion date: 2004-10-29.
, same as above. Signed on 2004-10-08. Completion date: 2004-10-08.
A & A ELECTRIC CO OF BEAUMONT, (6250 WALDEN RD; small business)
$59,941 with Army for Generators and Generators Sets, Electrical. Signed on 2003-09-24. Completion date: 2003-11-07.
IMPACT COMMUNICATIONS (3625 BRYAN DR; small business) in 2 contracts in 2005
$10,744 with Navy for ADP Components. Signed on 2005-09-02. Completion date: 2005-10-08.
with Navy for Intercommunication and Public Address Systems, Except Airborne. Signed on 2005-09-28. Completion date: 2005-10-28.
HARTMANN BUILDING SPECIALTIES, (9610 WALDEN RD; small business)
$12,095 with Army for Mineral Construction Materials, Bulk. Signed on 2006-04-17. Completion date: 2006-05-30.
ALH PROPERTIES NO ONE, INC (1610 IH 10 S; small business)
$7,560 with Army for Lodging - Hotel/Motel. Signed on 2003-03-31. Completion date: 2003-03-01.
ADVANCED ALARM SYSTEMS INC. (1130 LINDBERGH; small business)
$3,952 with Navy for Maintenance, Repair or Alteration of Real Property -- Miscellaneous Buildings. Signed on 2000-02-18. Completion date: 2000-03-17.
Top industries in this zip code by the number of employees in 2005:
Accommodation and Food Services: Full-Service Restaurants (100-249 employees: 1 establishment, 50-99 employees: 4 establishments, 20-49 employees: 3 establishments, 10-19 employees: 2 establishments, 1-4 employees: 1 establishment)Construction: Electrical Contractors (100-249: 1, 50-99: 1, 20-49: 5, 10-19: 3, 5-9: 1, 1-4: 4)Administrative and Support and Waste Management and Remediation Services: Janitorial Services (100-249: 1, 50-99: 2, 20-49: 4, 1-4: 3)Health Care and Social Assistance: Nursing Care Facilities (100-249: 1, 50-99: 3, 20-49: 1)Administrative and Support and Waste Management and Remediation Services: Temporary Help Services (250-499: 1, 20-49: 1)Construction: Oil and Gas Pipeline and Related Structures Construction (100-249: 2)Health Care and Social Assistance: Offices of Physicians (except Mental Health Specialists) (100-249: 1, 20-49: 3, 5-9: 4, 1-4: 12)Accommodation and Food Services: Limited-Service Restaurants (20-49: 7, 10-19: 2, 5-9: 2, 1-4: 2)
People in group quarters in 2010:
358 people in nursing facilities/skilled-nursing facilities
17 people in group homes intended for adults
7 people in residential treatment centers for adults
People in group quarters in 2000:
374 people in nursing homes
34 people in halfway houses
8 people in religious group quarters
Fatal accident statistics in 2014:
Fatal accident count: 1Vehicles involved in fatal accidents: 1Fatal accidents caused by drunken drivers: 0Fatalities: 1Persons involved in fatal accidents: 1Pedestrians involved in fatal accidents: 1
Fatal accident statistics in 2013:
Fatal accident count: 1Vehicles involved in fatal accidents: 2Fatal accidents caused by drunken drivers: 0Fatalities: 1Persons involved in fatal accidents: 5Pedestrians involved in fatal accidents: 0
Home Mortgage Disclosure Act Aggregated Statistics For Year 2009(Based on 4 full and 4 partial tracts) A) FHA, FSA/RHS & VA B) Conventional C) Refinancings D) Home Improvement Loans F) Non-occupant Loans on G) Loans On Manufactured Number Average Value Number Average Value Number Average Value Number Average Value Number Average Value Number Average Value
LOANS ORIGINATED 189 $107,865 115 $148,840 200 $112,130 30 $32,244 24 $58,096 2 $25,830 APPLICATIONS APPROVED, NOT ACCEPTED 7 $127,960 12 $186,349 30 $91,288 17 $40,014 3 $94,660 3 $29,037 APPLICATIONS DENIED 33 $103,960 32 $121,873 127 $115,668 62 $32,168 23 $74,185 4 $44,148 APPLICATIONS WITHDRAWN 13 $104,695 13 $185,777 48 $91,768 13 $53,645 3 $133,780 0 $0 FILES CLOSED FOR INCOMPLETENESS 0 $0 0 $0 17 $133,400 4 $64,828 0 $0 0 $0
Aggregated Statistics For Year 2008(Based on 4 full and 4 partial tracts) A) FHA, FSA/RHS & VA B) Conventional C) Refinancings D) Home Improvement Loans F) Non-occupant Loans on G) Loans On Manufactured Number Average Value Number Average Value Number Average Value Number Average Value Number Average Value Number Average Value
LOANS ORIGINATED 166 $107,041 199 $108,913 124 $91,808 74 $40,914 40 $66,318 3 $51,010 APPLICATIONS APPROVED, NOT ACCEPTED 5 $108,610 32 $93,727 37 $112,832 17 $36,022 19 $55,616 5 $39,976 APPLICATIONS DENIED 46 $103,784 51 $74,721 160 $98,412 79 $36,535 21 $44,006 5 $46,140 APPLICATIONS WITHDRAWN 15 $116,985 15 $106,450 51 $92,713 13 $34,178 4 $51,365 0 $0 FILES CLOSED FOR INCOMPLETENESS 4 $90,255 4 $78,598 4 $83,812 5 $97,954 2 $205,840 0 $0
Aggregated Statistics For Year 2007(Based on 4 full and 4 partial tracts) A) FHA, FSA/RHS & VA B) Conventional C) Refinancings D) Home Improvement Loans E) Loans on Dwellings For 5+ Families F) Non-occupant Loans on G) Loans On Manufactured Number Average Value Number Average Value Number Average Value Number Average Value Number Average Value Number Average Value Number Average Value
LOANS ORIGINATED 67 $105,509 486 $100,012 223 $119,512 94 $39,995 3 $325,040 85 $65,475 10 $41,349 APPLICATIONS APPROVED, NOT ACCEPTED 0 $0 52 $81,955 60 $119,853 22 $99,031 0 $0 9 $67,566 11 $74,989 APPLICATIONS DENIED 15 $89,065 148 $87,318 271 $91,516 147 $29,737 2 $125,000 37 $69,289 14 $47,119 APPLICATIONS WITHDRAWN 3 $88,410 76 $120,670 135 $106,811 7 $70,026 0 $0 7 $55,597 2 $52,650 FILES CLOSED FOR INCOMPLETENESS 0 $0 29 $85,497 32 $116,996 3 $49,003 0 $0 4 $49,340 0 $0
Aggregated Statistics For Year 2006(Based on 4 full and 4 partial tracts) A) FHA, FSA/RHS & VA B) Conventional C) Refinancings D) Home Improvement Loans E) Loans on Dwellings For 5+ Families F) Non-occupant Loans on G) Loans On Manufactured Number Average Value Number Average Value Number Average Value Number Average Value Number Average Value Number Average Value Number Average Value
LOANS ORIGINATED 117 $94,379 713 $89,199 235 $77,595 67 $32,191 2 $556,465 79 $75,502 14 $38,481 APPLICATIONS APPROVED, NOT ACCEPTED 4 $67,682 102 $74,646 66 $74,649 12 $39,160 2 $556,465 10 $73,444 8 $43,996 APPLICATIONS DENIED 28 $81,059 214 $69,808 254 $88,481 113 $39,039 0 $0 34 $61,594 11 $39,932 APPLICATIONS WITHDRAWN 11 $95,205 78 $82,492 172 $84,045 13 $41,979 2 $754,985 7 $72,753 0 $0 FILES CLOSED FOR INCOMPLETENESS 8 $77,370 21 $68,902 53 $102,057 4 $32,500 0 $0 6 $63,545 0 $0
Aggregated Statistics For Year 2005(Based on 4 full and 4 partial tracts) A) FHA, FSA/RHS & VA B) Conventional C) Refinancings D) Home Improvement Loans F) Non-occupant Loans on G) Loans On Manufactured Number Average Value Number Average Value Number Average Value Number Average Value Number Average Value Number Average Value
LOANS ORIGINATED 114 $80,635 478 $85,031 311 $89,029 93 $46,427 73 $58,534 0 $0 APPLICATIONS APPROVED, NOT ACCEPTED 6 $94,563 77 $64,537 53 $65,260 33 $56,062 19 $52,245 9 $88,003 APPLICATIONS DENIED 29 $69,659 254 $66,307 380 $84,134 105 $30,577 40 $61,896 23 $35,685 APPLICATIONS WITHDRAWN 9 $73,198 99 $84,233 249 $123,963 30 $201,018 17 $98,252 0 $0 FILES CLOSED FOR INCOMPLETENESS 2 $54,000 17 $121,886 55 $75,497 1 $16,180 5 $236,268 0 $0
Aggregated Statistics For Year 2004(Based on 4 full and 4 partial tracts) A) FHA, FSA/RHS & VA B) Conventional C) Refinancings D) Home Improvement Loans E) Loans on Dwellings For 5+ Families F) Non-occupant Loans on G) Loans On Manufactured Number Average Value Number Average Value Number Average Value Number Average Value Number Average Value Number Average Value Number Average Value
LOANS ORIGINATED 126 $77,793 508 $82,980 468 $75,049 79 $50,615 2 $90,000 116 $50,316 2 $22,000 APPLICATIONS APPROVED, NOT ACCEPTED 2 $47,685 81 $70,372 92 $78,315 22 $37,352 0 $0 27 $61,561 5 $52,696 APPLICATIONS DENIED 12 $80,988 146 $76,699 451 $71,348 118 $42,124 1 $513,720 50 $57,519 20 $44,167 APPLICATIONS WITHDRAWN 20 $89,752 59 $72,764 233 $70,904 10 $46,816 0 $0 14 $50,692 0 $0 FILES CLOSED FOR INCOMPLETENESS 0 $0 22 $79,804 80 $86,046 4 $95,148 0 $0 4 $64,690 0 $0
Aggregated Statistics For Year 2003(Based on 4 full and 4 partial tracts) A) FHA, FSA/RHS & VA B) Conventional C) Refinancings D) Home Improvement Loans F) Non-occupant Loans on Number Average Value Number Average Value Number Average Value Number Average Value Number Average Value
LOANS ORIGINATED 139 $82,116 463 $86,738 638 $72,085 53 $28,105 85 $49,294 APPLICATIONS APPROVED, NOT ACCEPTED 11 $72,923 62 $81,621 99 $61,191 17 $33,734 14 $52,159 APPLICATIONS DENIED 18 $74,392 134 $66,604 467 $70,462 79 $22,056 17 $64,206 APPLICATIONS WITHDRAWN 9 $85,518 41 $89,726 203 $69,699 3 $16,997 11 $49,062 FILES CLOSED FOR INCOMPLETENESS 2 $40,730 20 $86,445 31 $71,218 3 $22,027 2 $43,000
Aggregated Statistics For Year 2002(Based on 4 full and 4 partial tracts) A) FHA, FSA/RHS & VA B) Conventional C) Refinancings D) Home Improvement Loans E) Loans on Dwellings For 5+ Families F) Non-occupant Loans on Number Average Value Number Average Value Number Average Value Number Average Value Number Average Value Number Average Value
LOANS ORIGINATED 136 $70,314 395 $88,403 387 $74,454 82 $23,128 4 $157,755 58 $60,527 APPLICATIONS APPROVED, NOT ACCEPTED 3 $56,960 40 $69,584 78 $69,003 7 $23,066 0 $0 11 $44,729 APPLICATIONS DENIED 14 $67,873 132 $64,213 212 $61,729 75 $17,163 0 $0 22 $34,659 APPLICATIONS WITHDRAWN 8 $75,220 40 $72,838 100 $55,276 7 $32,196 0 $0 5 $46,906 FILES CLOSED FOR INCOMPLETENESS 7 $67,764 31 $71,815 39 $82,727 2 $12,210 0 $0 0 $0
Aggregated Statistics For Year 2001(Based on 4 full and 4 partial tracts) A) FHA, FSA/RHS & VA B) Conventional C) Refinancings D) Home Improvement Loans E) Loans on Dwellings For 5+ Families F) Non-occupant Loans on Number Average Value Number Average Value Number Average Value Number Average Value Number Average Value Number Average Value
LOANS ORIGINATED 163 $73,226 341 $80,848 277 $68,120 85 $16,187 2 $137,810 38 $53,810 APPLICATIONS APPROVED, NOT ACCEPTED 4 $68,410 38 $63,599 65 $63,985 8 $10,685 0 $0 5 $48,350 APPLICATIONS DENIED 8 $63,441 115 $60,007 168 $60,079 61 $22,101 0 $0 25 $39,351 APPLICATIONS WITHDRAWN 18 $69,055 24 $89,014 117 $59,900 6 $39,258 0 $0 4 $54,822 FILES CLOSED FOR INCOMPLETENESS 2 $66,560 23 $68,760 28 $64,970 0 $0 0 $0 4 $53,842
Aggregated Statistics For Year 2000(Based on 4 full and 4 partial tracts) A) FHA, FSA/RHS & VA B) Conventional C) Refinancings D) Home Improvement Loans E) Loans on Dwellings For 5+ Families F) Non-occupant Loans on Number Average Value Number Average Value Number Average Value Number Average Value Number Average Value Number Average Value
LOANS ORIGINATED 130 $69,702 361 $78,170 135 $58,954 72 $20,840 2 $2,259,985 40 $43,456 APPLICATIONS APPROVED, NOT ACCEPTED 9 $70,633 55 $77,402 41 $81,587 29 $21,334 0 $0 4 $39,348 APPLICATIONS DENIED 15 $58,557 114 $57,890 105 $46,750 61 $20,078 2 $163,975 17 $31,796 APPLICATIONS WITHDRAWN 17 $60,493 49 $75,894 71 $64,057 5 $17,444 0 $0 5 $42,102 FILES CLOSED FOR INCOMPLETENESS 6 $54,968 26 $53,245 21 $93,009 6 $10,557 0 $0 2 $42,740
Aggregated Statistics For Year 1999(Based on 2 full and 2 partial tracts) A) FHA, FSA/RHS & VA B) Conventional C) Refinancings D) Home Improvement Loans E) Loans on Dwellings For 5+ Families F) Non-occupant Loans on Number Average Value Number Average Value Number Average Value Number Average Value Number Average Value Number Average Value
LOANS ORIGINATED 72 $64,838 196 $76,404 116 $62,278 38 $18,408 0 $0 15 $50,747 APPLICATIONS APPROVED, NOT ACCEPTED 6 $58,870 25 $43,783 18 $46,153 11 $41,314 0 $0 4 $38,878 APPLICATIONS DENIED 1 $40,830 65 $55,926 40 $49,079 29 $16,856 0 $0 8 $66,744 APPLICATIONS WITHDRAWN 7 $68,741 20 $59,670 17 $53,123 2 $18,885 1 $2,344,560 1 $58,620 FILES CLOSED FOR INCOMPLETENESS 3 $66,517 15 $53,341 13 $69,778 2 $35,945 0 $0 0 $0
Detailed HMDA statistics for the following Tracts:
0003.04
,
0013.01 ,
0013.02 ,
0013.03
Private Mortgage Insurance Companies Aggregated Statistics For Year 2009(Based on 4 full and 4 partial tracts) A) Conventional B) Refinancings Number Average Value Number Average Value
LOANS ORIGINATED 25 $151,682 7 $154,877 APPLICATIONS APPROVED, NOT ACCEPTED 10 $100,344 2 $113,000 APPLICATIONS DENIED 2 $69,775 2 $345,705 APPLICATIONS WITHDRAWN 0 $0 2 $49,715 FILES CLOSED FOR INCOMPLETENESS 0 $0 1 $172,320
Aggregated Statistics For Year 2008(Based on 4 full and 4 partial tracts) A) Conventional B) Refinancings C) Non-occupant Loans on Number Average Value Number Average Value Number Average Value
LOANS ORIGINATED 108 $98,230 7 $148,504 11 $77,985 APPLICATIONS APPROVED, NOT ACCEPTED 34 $136,230 5 $176,052 2 $50,590 APPLICATIONS DENIED 8 $107,426 0 $0 3 $102,920 APPLICATIONS WITHDRAWN 2 $54,075 2 $128,630 1 $80,090 FILES CLOSED FOR INCOMPLETENESS 0 $0 0 $0 0 $0
Aggregated Statistics For Year 2007(Based on 4 full and 4 partial tracts) A) Conventional B) Refinancings C) Non-occupant Loans on Number Average Value Number Average Value Number Average Value
LOANS ORIGINATED 302 $102,442 21 $162,343 14 $68,801 APPLICATIONS APPROVED, NOT ACCEPTED 43 $94,744 9 $150,403 9 $69,518 APPLICATIONS DENIED 9 $116,691 0 $0 3 $89,547 APPLICATIONS WITHDRAWN 17 $101,758 1 $144,810 2 $45,355 FILES CLOSED FOR INCOMPLETENESS 0 $0 0 $0 0 $0
Aggregated Statistics For Year 2006(Based on 4 full and 4 partial tracts) A) Conventional B) Refinancings C) Non-occupant Loans on Number Average Value Number Average Value Number Average Value
LOANS ORIGINATED 188 $96,421 14 $160,372 8 $68,016 APPLICATIONS APPROVED, NOT ACCEPTED 30 $103,853 5 $119,824 2 $59,000 APPLICATIONS DENIED 0 $0 0 $0 0 $0 APPLICATIONS WITHDRAWN 11 $71,790 2 $79,470 0 $0 FILES CLOSED FOR INCOMPLETENESS 4 $52,018 0 $0 0 $0
Aggregated Statistics For Year 2005(Based on 4 full and 4 partial tracts) A) Conventional B) Refinancings C) Non-occupant Loans on Number Average Value Number Average Value Number Average Value
LOANS ORIGINATED 105 $98,193 23 $95,145 13 $67,207 APPLICATIONS APPROVED, NOT ACCEPTED 23 $79,647 4 $56,852 9 $52,603 APPLICATIONS DENIED 2 $86,425 0 $0 0 $0 APPLICATIONS WITHDRAWN 7 $87,394 0 $0 2 $75,000 FILES CLOSED FOR INCOMPLETENESS 1 $72,000 0 $0 0 $0
Aggregated Statistics For Year 2004(Based on 4 full and 4 partial tracts) A) Conventional B) Refinancings C) Non-occupant Loans on Number Average Value Number Average Value Number Average Value
LOANS ORIGINATED 162 $90,898 26 $93,759 40 $51,487 APPLICATIONS APPROVED, NOT ACCEPTED 25 $102,887 13 $156,045 4 $54,950 APPLICATIONS DENIED 12 $58,578 0 $0 2 $37,505 APPLICATIONS WITHDRAWN 6 $74,837 2 $71,000 0 $0 FILES CLOSED FOR INCOMPLETENESS 8 $121,425 0 $0 0 $0
Aggregated Statistics For Year 2003(Based on 4 full and 4 partial tracts) A) Conventional B) Refinancings C) Non-occupant Loans on Number Average Value Number Average Value Number Average Value
LOANS ORIGINATED 154 $78,953 52 $88,387 28 $53,946 APPLICATIONS APPROVED, NOT ACCEPTED 25 $76,156 11 $82,136 2 $43,610 APPLICATIONS DENIED 6 $46,913 0 $0 0 $0 APPLICATIONS WITHDRAWN 12 $157,231 4 $46,805 2 $253,315 FILES CLOSED FOR INCOMPLETENESS 1 $46,110 0 $0 0 $0
Aggregated Statistics For Year 2002(Based on 4 full and 4 partial tracts) A) Conventional B) Refinancings C) Non-occupant Loans on Number Average Value Number Average Value Number Average Value
LOANS ORIGINATED 190 $78,435 39 $104,465 16 $47,204 APPLICATIONS APPROVED, NOT ACCEPTED 34 $95,704 6 $83,725 0 $0 APPLICATIONS DENIED 6 $61,203 0 $0 2 $43,610 APPLICATIONS WITHDRAWN 15 $81,917 2 $138,085 2 $37,750 FILES CLOSED FOR INCOMPLETENESS 6 $85,432 2 $84,605 0 $0
Aggregated Statistics For Year 2001(Based on 4 full and 4 partial tracts) A) Conventional B) Refinancings C) Non-occupant Loans on Number Average Value Number Average Value Number Average Value
LOANS ORIGINATED 162 $79,417 27 $91,747 4 $67,230 APPLICATIONS APPROVED, NOT ACCEPTED 43 $107,551 6 $137,647 5 $112,616 APPLICATIONS DENIED 5 $67,626 0 $0 0 $0 APPLICATIONS WITHDRAWN 5 $98,476 3 $142,383 2 $79,370 FILES CLOSED FOR INCOMPLETENESS 8 $55,588 0 $0 0 $0
Aggregated Statistics For Year 2000(Based on 4 full and 4 partial tracts) A) Conventional B) Refinancings C) Non-occupant Loans on Number Average Value Number Average Value Number Average Value
LOANS ORIGINATED 152 $78,734 6 $85,180 12 $49,517 APPLICATIONS APPROVED, NOT ACCEPTED 14 $67,414 3 $180,477 2 $54,000 APPLICATIONS DENIED 3 $81,407 1 $129,440 0 $0 APPLICATIONS WITHDRAWN 6 $84,788 0 $0 2 $43,000 FILES CLOSED FOR INCOMPLETENESS 6 $89,420 2 $129,960 0 $0
Aggregated Statistics For Year 1999(Based on 2 full and 2 partial tracts) A) Conventional B) Refinancings C) Non-occupant Loans on Number Average Value Number Average Value Number Average Value
LOANS ORIGINATED 90 $72,529 14 $69,560 6 $45,370 APPLICATIONS APPROVED, NOT ACCEPTED 9 $107,897 3 $121,827 3 $30,840 APPLICATIONS DENIED 17 $65,488 0 $0 2 $47,150 APPLICATIONS WITHDRAWN 6 $85,517 1 $97,110 0 $0 FILES CLOSED FOR INCOMPLETENESS 5 $79,532 0 $0 0 $0
Detailed PMIC statistics for the following Tracts:
0003.04
,
0013.01 ,
0013.02 ,
0013.03
2002 - 2018 National Fire Incident Reporting System (NFIRS) incidents See full 2006 National Fire Incident Reporting System statistics for zip code 77707, Texas
Most common first names in zip code 77707 among deceased individuals Name Count Lived (average)
Mary 113 78.2 years John 92 73.0 years James 78 70.0 years William 75 73.6 years Robert 50 70.4 years Charles 41 70.3 years George 37 74.4 years Joseph 35 76.1 years Willie 32 74.4 years Betty 29 67.5 years
Most common last names in zip code 77707 among deceased individuals Last name Count Lived (average)
Smith 38 75.7 years Johnson 36 71.8 years Jones 35 71.2 years Brown 35 83.6 years Davis 34 75.6 years Williams 32 74.0 years Miller 23 75.1 years Broussard 17 76.1 years White 16 77.2 years Wilson 16 76.9 years
Businesses in zip code 77707
Name Count Name Count
Ace Hardware 1 Outback 1 Advance Auto Parts 1 Outback Steakhouse 1 AutoZone 1 Penske 1 Best Western 1 Pizza Hut 1 CVS 1 Quality 1 FedEx 4 Ramada 1 Jack In The Box 1 Red Roof Inn 1 Jones New York 1 SONIC Drive-In 3 Kroger 1 Subway 2 La Quinta 1 T-Mobile 1 MasterBrand Cabinets 1 UPS 3 New Balance 2 Waffle House 1
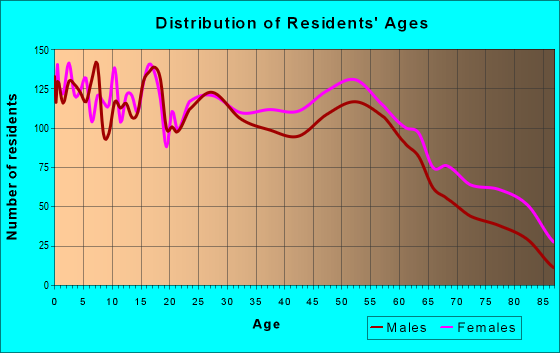
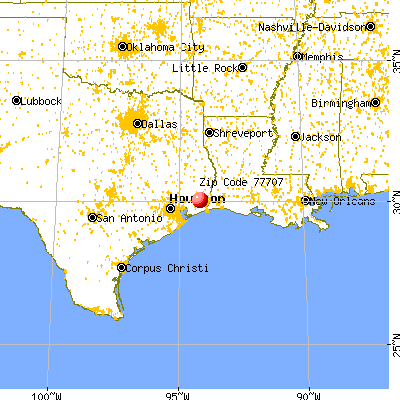


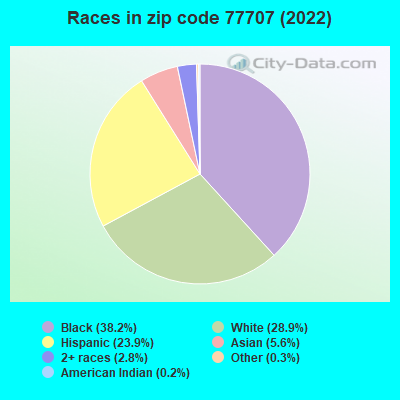


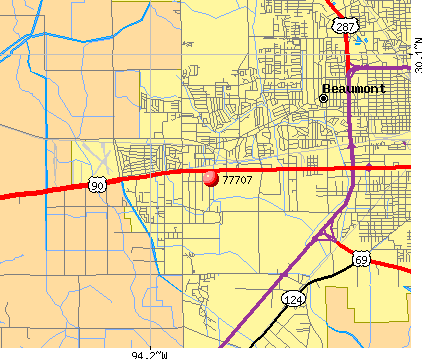 Nearest zip codes: 77706, 77702, 77701, 77713, 77708, 77703.
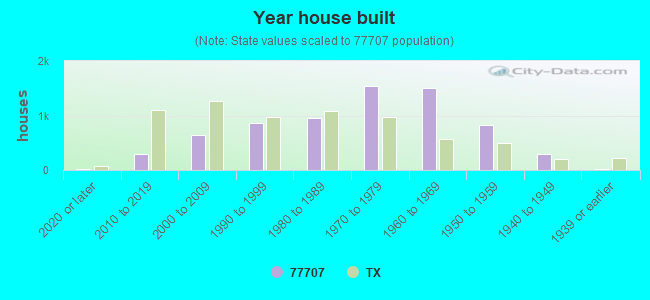
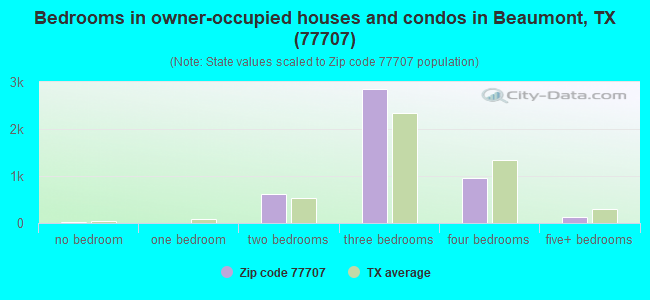
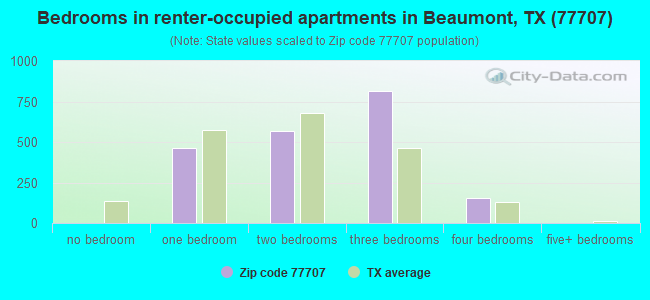
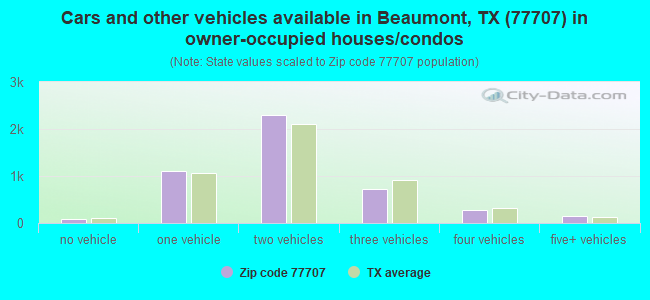
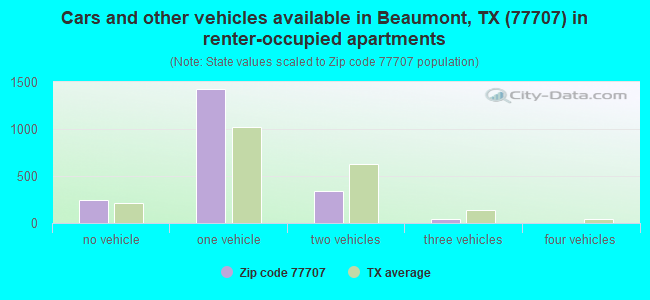


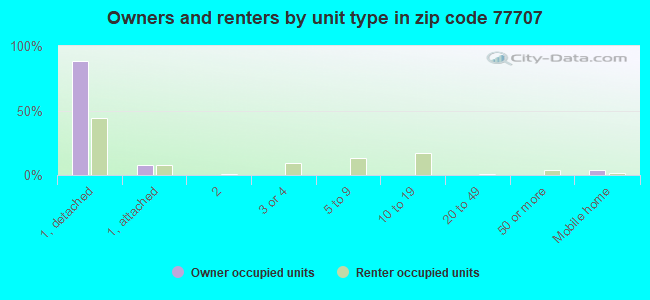
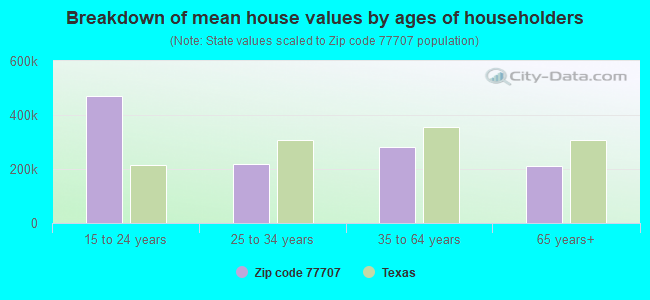


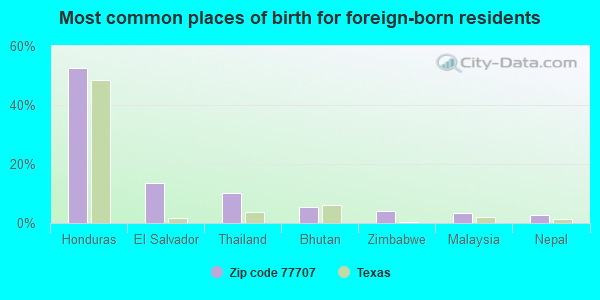
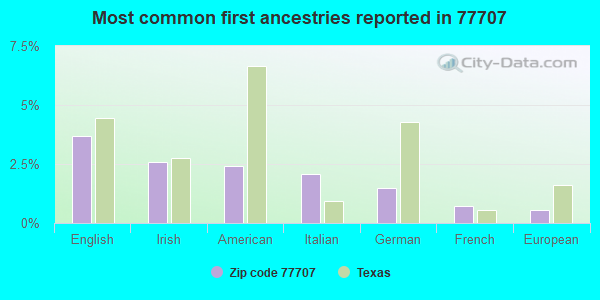
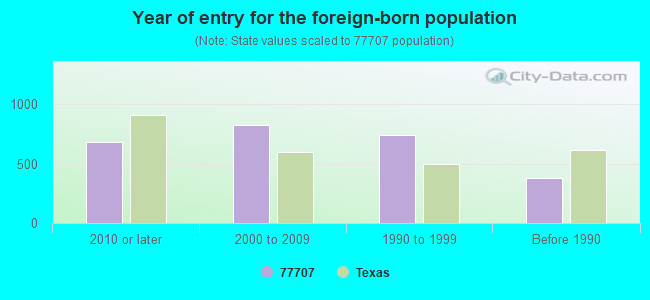


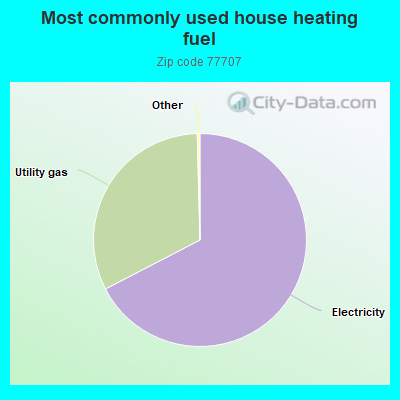
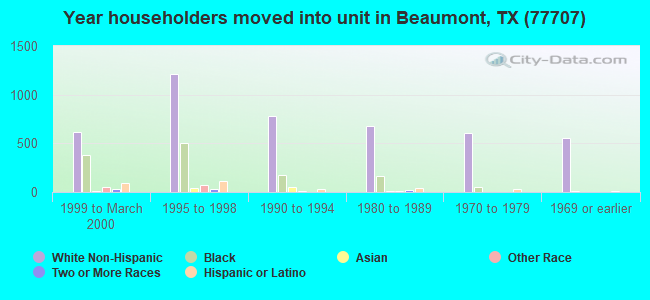
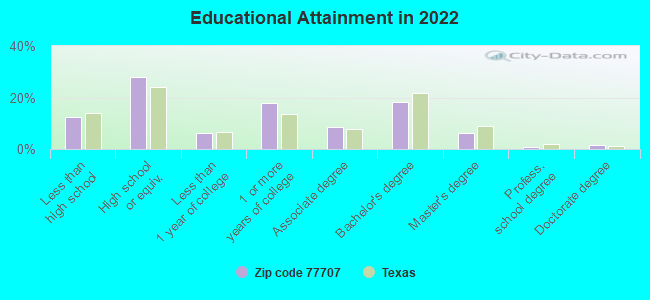
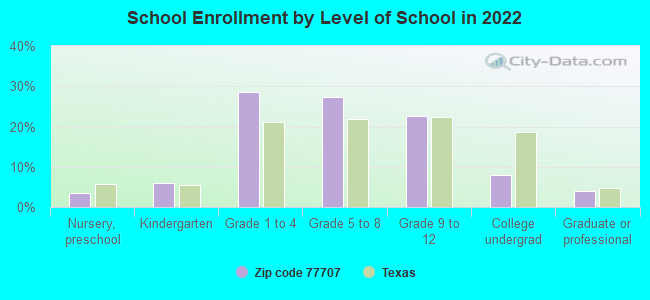
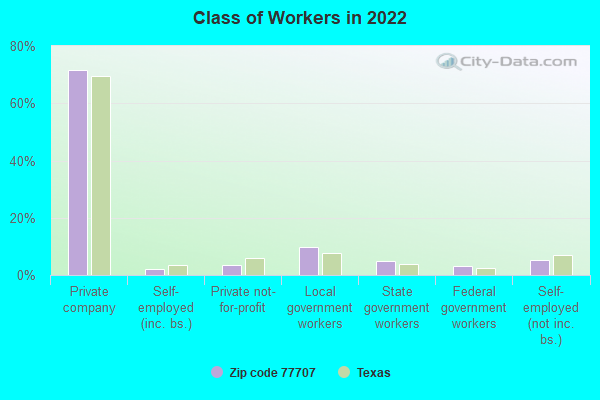
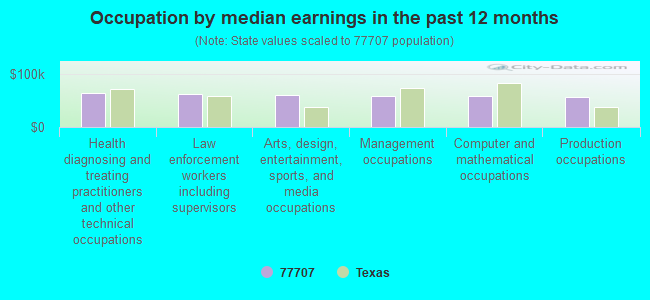
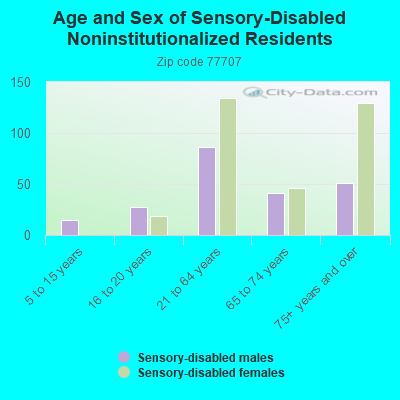
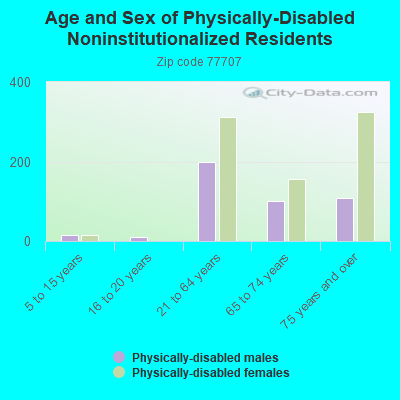
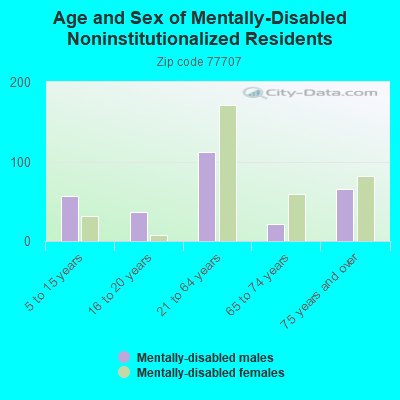
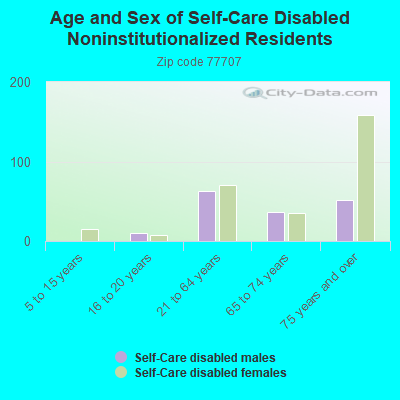
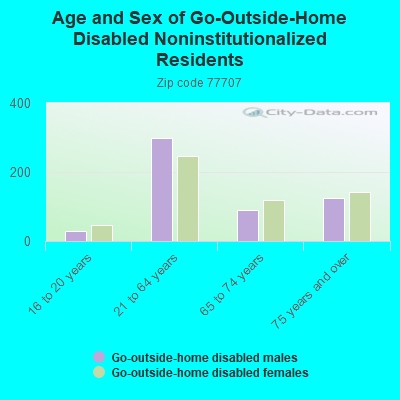
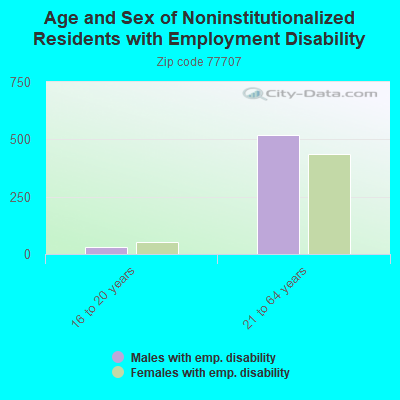
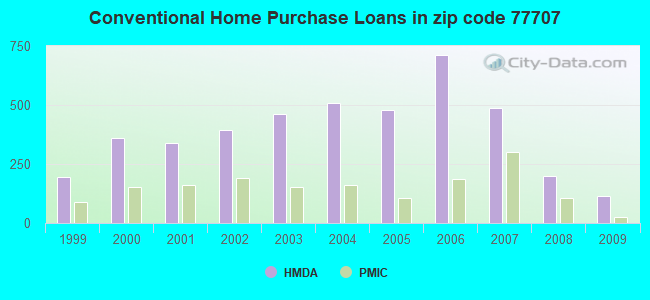
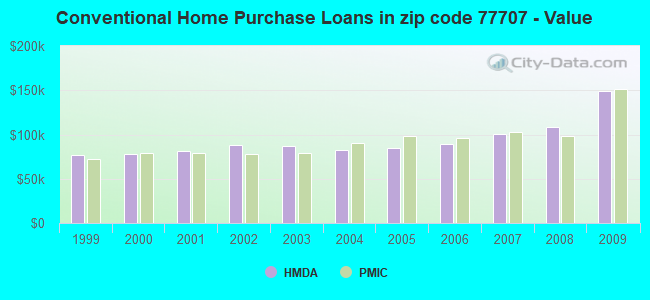
 According to the data from the years 2002 - 2018 the average number of fire incidents per year is 58. The highest number of reported fire incidents - 89 took place in 2006, and the least - 43 in 2015. The data has a declining trend.
 When looking into fire subcategories, the most reports belonged to: Outside Fires (37.1%), and Structure Fires (36.8%).