Estimated zip code population in 2022: 39,255 Zip code population in 2010: 40,475 Zip code population in 2000: 39,932
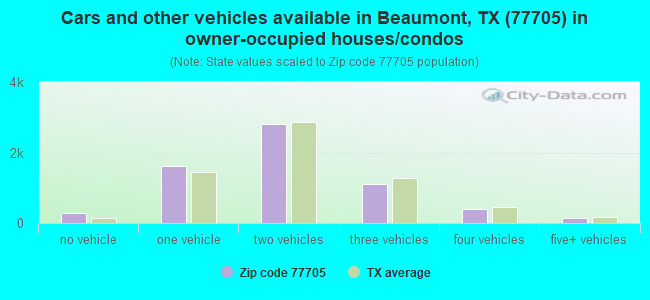
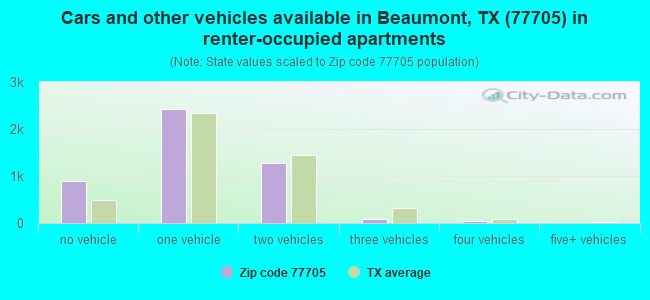
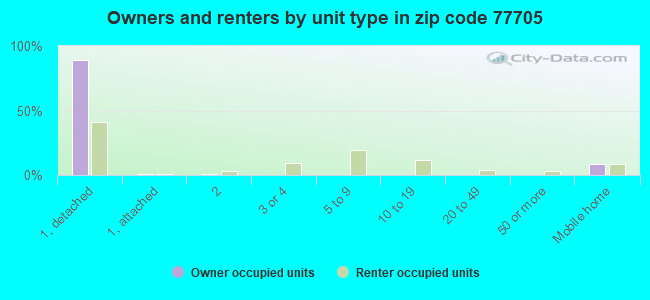
Houses and condos: 12,896 Renter-occupied apartments: 4,688
% of renters here:
43%
State:
38%
March 2022 cost of living index in zip code 77705: 81.6 (low, U.S. average is 100)
Land area: 237.3 sq. mi. Water area: 16.1 sq. mi.
Population density: 165 people per square mile
(very low).
OSM Map
General Map
Google Map
MSN Map
OSM Map
General Map
Google Map
MSN Map
OSM Map
General Map
Google Map
MSN Map
OSM Map
General Map
Google Map
MSN Map
Please wait while loading the map...
Real estate property taxes paid for housing units in 2022:
This zip code:
1.2% ($1,614)
Texas:
1.5% ($4,050)
Median real estate property taxes paid for housing units with mortgages in 2022: $2,943 (1.8%) Median real estate property taxes paid for housing units with no mortgage in 2022: $1,013 (0.9%)
Averages for the 2020 tax year for zip code 77705, filed in 2021:
Average Adjusted Gross Income (AGI) in 2020: $49,760 (Individual Income Tax Returns)
Here:
$49,760
State:
$77,054
Salary/wage: $44,626 (reported on 82.6% of returns)
Here:
$44,626
State:
$62,766
(% of AGI for various income ranges: 1124.9% for AGIs below $25k, 3461.9% for AGIs $25k-50k, 6261.6% for AGIs $50k-75k, 8560.5% for AGIs $75k-100k, 15799.9% for AGIs $100k-200k, 49885.8% for AGIs over 200k)
Taxable interest for individuals: $749 (reported on 23.7% of returns)
This zip code:
$749
Texas:
$2,665
(% of AGI for various income ranges: 4.1% for AGIs below $25k, 13.3% for AGIs $25k-50k, 27.7% for AGIs $50k-75k, 50.5% for AGIs $75k-100k, 51.6% for AGIs $100k-200k, 496.7% for AGIs over 200k)
Ordinary dividends: $4,624 (reported on 8.0% of returns)
Here:
$4,624
State:
$10,044
(% of AGI for various income ranges: 5.6% for AGIs below $25k, 14.3% for AGIs $25k-50k, 28.9% for AGIs $50k-75k, 63.3% for AGIs $75k-100k, 135.8% for AGIs $100k-200k, 1639.2% for AGIs over 200k)
Net capital gain/loss in AGI: +$22,228 (reported on 7.5% of returns)
Here:
+$22,228
State:
+$39,590
(% of AGI for various income ranges: 1.1% for AGIs below $25k, 9.4% for AGIs $25k-50k, 47.6% for AGIs $50k-75k, 124.9% for AGIs $75k-100k, 252.5% for AGIs $100k-200k, 13059.2% for AGIs over 200k)
Profit/loss from business: +$4,714 (reported on 17.9% of returns)
Here:
+$4,714
State:
+$10,888
(% of AGI for various income ranges: 76.9% for AGIs below $25k, 23.4% for AGIs $50k-75k, 101.3% for AGIs $75k-100k, 140.2% for AGIs $100k-200k, 4156.7% for AGIs over 200k)
Taxable individual retirement arrangement distribution: $27,008 (reported on 6.3% of returns)
77705:
$27,008
Texas:
$24,740
(% of AGI for various income ranges: 25.9% for AGIs below $25k, 64.5% for AGIs $25k-50k, 280.5% for AGIs $50k-75k, 539.6% for AGIs $75k-100k, 1012.6% for AGIs $100k-200k, 2550.0% for AGIs over 200k)
Total itemized deductions: $38,031 (reported on 6.7% of returns)
Here:
$38,031
State:
$40,428
(% of AGI for various income ranges: 30.0% for AGIs below $25k, 203.2% for AGIs $25k-50k, 513.5% for AGIs $50k-75k, 807.1% for AGIs $75k-100k, 1139.8% for AGIs $100k-200k, 3973.3% for AGIs over 200k)
Charity contributions: $14,411 (reported on 3.9% of returns)
Here:
$14,411
State:
$18,201
(% of AGI for various income ranges: 34.9% for AGIs $25k-50k, 104.1% for AGIs $50k-75k, 160.0% for AGIs $75k-100k, 261.0% for AGIs $100k-200k, 1406.7% for AGIs over 200k)
Taxes paid: $5,921 (reported on 4.6% of returns)
77705:
$5,921
State:
$7,821
(% of AGI for various income ranges: 18.6% for AGIs $25k-50k, 48.9% for AGIs $50k-75k, 84.4% for AGIs $75k-100k, 129.4% for AGIs $100k-200k, 605.8% for AGIs over 200k)
Earned income credit: $2,842 (reported on 28.2% of returns)
Here:
$2,842
State:
$2,584
(% of AGI for various income ranges: 172.6% for AGIs below $25k, 90.1% for AGIs $25k-50k)
Percentage of individuals using paid preparers for their 2020 taxes: 88.4%
Here:
88%
State:
92%
(% for various income ranges: 85.2% for AGIs below $25k, 90.8% for AGIs $25k-50k, 90.8% for AGIs $50k-75k, 91.8% for AGIs $75k-100k, 90.5% for AGIs $100k-200k, 93.8% for AGIs over 200k)
Averages for the 2012 tax year for zip code 77705, filed in 2013:
Average Adjusted Gross Income (AGI) in 2012: $42,178 (Individual Income Tax Returns)
Here:
$42,178
State:
$65,384
Salary/wage: $37,525 (reported on 87.6% of returns)
Here:
$37,525
State:
$52,524
(% of AGI for various income ranges: 81.2% for AGIs below $25k, 83.9% for AGIs $25k-50k, 79.7% for AGIs $50k-75k, 79.6% for AGIs $75k-100k, 82.5% for AGIs $100k-200k, 49.3% for AGIs over 200k)
Taxable interest for individuals: $950 (reported on 20.7% of returns)
This zip code:
$950
Texas:
$2,372
(% of AGI for various income ranges: 0.4% for AGIs below $25k, 0.5% for AGIs $25k-50k, 0.5% for AGIs $50k-75k, 0.4% for AGIs $75k-100k, 0.3% for AGIs $100k-200k, 0.9% for AGIs over 200k)
Ordinary dividends: $3,503 (reported on 8.7% of returns)
Here:
$3,503
State:
$9,721
(% of AGI for various income ranges: 1.0% for AGIs below $25k, 0.6% for AGIs $25k-50k, 0.6% for AGIs $50k-75k, 0.5% for AGIs $75k-100k, 0.5% for AGIs $100k-200k, 1.3% for AGIs over 200k)
Net capital gain/loss in AGI: +$13,056 (reported on 6.2% of returns)
Here:
+$13,056
State:
+$35,319
(% of AGI for various income ranges: 0.3% for AGIs $25k-50k, 0.3% for AGIs $50k-75k, 0.4% for AGIs $75k-100k, 0.5% for AGIs $100k-200k, 14.0% for AGIs over 200k)
Profit/loss from business: +$6,139 (reported on 15.5% of returns)
Here:
+$6,139
State:
+$13,732
(% of AGI for various income ranges: 6.0% for AGIs below $25k, 0.7% for AGIs $25k-50k, 1.1% for AGIs $50k-75k, 0.6% for AGIs $75k-100k, 1.4% for AGIs $100k-200k, 5.1% for AGIs over 200k)
Taxable individual retirement arrangement distribution: $18,821 (reported on 7.3% of returns)
77705:
$18,821
Texas:
$19,511
(% of AGI for various income ranges: 2.0% for AGIs below $25k, 2.6% for AGIs $25k-50k, 3.6% for AGIs $50k-75k, 4.5% for AGIs $75k-100k, 5.2% for AGIs $100k-200k)
Total itemized deductions: $20,111 (20% of AGI, reported on 16.4% of returns)
Here:
$20,111
State:
$24,724
Here:
20.4% of AGI
State:
15.9% of AGI
(% of AGI for various income ranges: 3.3% for AGIs below $25k, 7.2% for AGIs $25k-50k, 8.9% for AGIs $50k-75k, 10.3% for AGIs $75k-100k, 9.6% for AGIs $100k-200k, 6.8% for AGIs over 200k)
Charity contributions: $5,909 (reported on 13.2% of returns)
Here:
$5,909
State:
$6,808
(% of AGI for various income ranges: 0.6% for AGIs below $25k, 1.5% for AGIs $25k-50k, 2.1% for AGIs $50k-75k, 2.5% for AGIs $75k-100k, 2.3% for AGIs $100k-200k, 2.1% for AGIs over 200k)
Taxes paid: $4,538 (reported on 16.1% of returns)
77705:
$4,538
State:
$6,921
(% of AGI for various income ranges: 0.5% for AGIs below $25k, 1.3% for AGIs $25k-50k, 1.7% for AGIs $50k-75k, 2.0% for AGIs $75k-100k, 2.6% for AGIs $100k-200k, 1.9% for AGIs over 200k)
Earned income credit: $2,618 (reported on 32.1% of returns)
Here:
$2,618
State:
$2,570
(% of AGI for various income ranges: 11.1% for AGIs below $25k, 1.5% for AGIs $25k-50k)
Percentage of individuals using paid preparers for their 2012 taxes: 59.7%
Here:
60%
State:
51%
(% for various income ranges: 57.6% for AGIs below $25k, 60.0% for AGIs $25k-50k, 62.7% for AGIs $50k-75k, 62.9% for AGIs $75k-100k, 63.5% for AGIs $100k-200k, 76.9% for AGIs over 200k)
Averages for the 2004 tax year for zip code 77705, filed in 2005:
Average Adjusted Gross Income (AGI) in 2004: $29,888 (Individual Income Tax Returns)
Here:
$29,888
State:
$47,881
Salary/wage: $27,833 (reported on 88.5% of returns)
Here:
$27,833
State:
$41,947
(% of AGI for various income ranges: 96.8% for AGIs below $10k, 84.8% for AGIs $10k-25k, 84.6% for AGIs $25k-50k, 82.1% for AGIs $50k-75k, 85.0% for AGIs $75k-100k, 72.6% for AGIs over 100k)
Taxable interest for individuals: $1,219 (reported on 26.1% of returns)
This zip code:
$1,219
Texas:
$2,255
(% of AGI for various income ranges: 2.0% for AGIs below $10k, 1.1% for AGIs $10k-25k, 1.1% for AGIs $25k-50k, 0.8% for AGIs $50k-75k, 0.7% for AGIs $75k-100k, 1.4% for AGIs over 100k)
Taxable dividends: $1,772 (reported on 9.8% of returns)
Here:
$1,772
State:
$4,261
(% of AGI for various income ranges: 0.5% for AGIs below $10k, 0.5% for AGIs $10k-25k, 0.5% for AGIs $25k-50k, 0.4% for AGIs $50k-75k, 0.4% for AGIs $75k-100k, 1.0% for AGIs over 100k)
Net capital gain/loss: +$2,375 (reported on 7.2% of returns)
Here:
+$2,375
State:
+$16,110
(% of AGI for various income ranges: -0.2% for AGIs below $10k, -0.2% for AGIs $10k-25k, 0.2% for AGIs $25k-50k, 0.4% for AGIs $50k-75k, 0.2% for AGIs $75k-100k, 2.3% for AGIs over 100k)
Profit/loss from business: +$4,592 (reported on 12.4% of returns)
Here:
+$4,592
State:
+$11,013
(% of AGI for various income ranges: 5.7% for AGIs below $10k, 2.5% for AGIs $10k-25k, 0.4% for AGIs $25k-50k, 0.9% for AGIs $50k-75k, 1.0% for AGIs $75k-100k, 4.0% for AGIs over 100k)
IRA payment deduction: $3,010 (reported on 0.9% of returns)
77705:
$3,010
Texas:
$3,120
(% of AGI for various income ranges: 0.1% for AGIs $10k-25k, 0.1% for AGIs $25k-50k, 0.1% for AGIs $50k-75k, 0.1% for AGIs $75k-100k)
Self-employed pension: $18,000 (reported on 0.1% of returns)
Here:
$18,000
Texas:
$16,401
Total itemized deductions: $16,324 (27% of AGI, reported on 15.2% of returns)
Here:
$16,324
State:
$19,631
Here:
26.8% of AGI
State:
18.9% of AGI
(% of AGI for various income ranges: 6.6% for AGIs below $10k, 4.2% for AGIs $10k-25k, 8.4% for AGIs $25k-50k, 10.0% for AGIs $50k-75k, 10.0% for AGIs $75k-100k, 9.5% for AGIs over 100k)
Charity contributions deductions: $4,771 (7% of AGI, reported on 12.2% of returns)
Here:
$4,771
State:
$4,753
Here:
7.1% of AGI
State:
4.2% of AGI
(% of AGI for various income ranges: 0.3% for AGIs below $10k, 0.8% for AGIs $10k-25k, 1.9% for AGIs $25k-50k, 2.6% for AGIs $50k-75k, 2.4% for AGIs $75k-100k, 2.6% for AGIs over 100k)
Total tax: $4,369 (reported on 57.4% of returns)
77705:
$4,369
State:
$9,058
(% of AGI for various income ranges: 2.2% for AGIs below $10k, 2.7% for AGIs $10k-25k, 5.5% for AGIs $25k-50k, 8.7% for AGIs $50k-75k, 10.9% for AGIs $75k-100k, 16.7% for AGIs over 100k)
Earned income credit: $2,048 (reported on 34.7% of returns)
Here:
$2,048
State:
$2,024
Percentage of individuals using paid preparers for their 2004 taxes: 63.6%
Here:
64%
State:
57%
(% for various income ranges: 57.3% for AGIs below $10k, 69.4% for AGIs $10k-25k, 63.2% for AGIs $25k-50k, 61.7% for AGIs $50k-75k, 61.3% for AGIs $75k-100k, 66.4% for AGIs over 100k)
Household received Food Stamps/SNAP in the past 12 months: 2,136 Household did not receive Food Stamps/SNAP in the past 12 months: 8,927
Women who had a birth in the past 12 months: 270 (186 now married, 84 unmarried) Women who did not have a birth in the past 12 months: 6,058 (1,983 now married, 4,096 unmarried)
Housing units in zip code 77705 with a mortgage: 2,497 (124 second mortgage, 21 home equity loan, 68 both second mortgage and home equity loan) Houses without a mortgage: 24
Median monthly owner costs for units with a mortgage: $1,459 Median monthly owner costs for units without a mortgage: $424
Residents with income below the poverty level in 2022:
This zip code:
20.7%
Whole state:
14.0%
Residents with income below 50% of the poverty level in 2022:
This zip code:
9.4%
Whole state:
7.4%
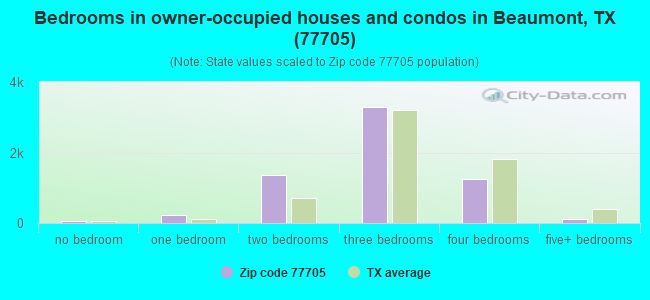
Median number of rooms in houses and condos:
Here:
6.0
State:
6.3
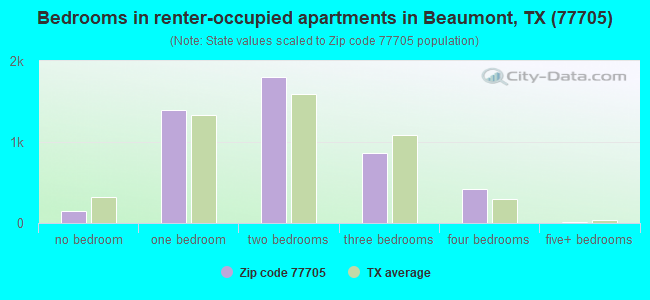
Median number of rooms in apartments:
Here:
4.3
State:
4.0
Notable locations in this zip code not listed on our city pages
Notable locations in zip code 77705: Bayou Din Golf Club (A), Port Arthur Country Club (B), Brooks (C), Labelle - Fannett Volunteer Fire Department / Emergency Medical Services (D), Lamar Institute of Technology Regional Fire Academy (E), Beaumont Police Department (F), Spindletop-Gladys City Boomtown Museum (G), Gladys City Boom Town Museum (H), Labelle - Fannett Volunteer Fire Department / Emergency Medical Services Substation (I), Beaumont Fire and Rescue Station 10 (J), Beaumont Fire and Rescue Station 3 (K). Display/hide their locations on the map
Churches in zip code 77705 include: Tyrrell Park Church (A), Jenkins Chapel (B), Antioch Church (C), Good Hope Chapel (D), South United Pentecostal Church (E), Pentecostal Church of God and Christ (F), Saint Pauls United Methodist Church (G), Highland Avenue Church (H), Antioch Baptist Church (I). Display/hide their locations on the map
Lakes, reservoirs, and swamps: Twin Lakes (A), Coffee Bean Slough (B), Lovell Lake (C), Viterbo Reservoir (D), Alligator Hole Marsh (E), Willow Slough Marsh (F). Display/hide their locations on the map
Streams, rivers, and creeks: Bayou Din (A), Mayhaw Bayou (B), Willow Marsh Bayou (C), South Fork Taylor Bayou (D), North Fork Taylor Bayou (E), Hillebrandt Bayou (F). Display/hide their locations on the map
Parks in zip code 77705 include: Chaison Park (1), Spindletop Park (2), Vincent Beck Stadium (3), Tyrrell Park (4), Live Oak Memorial Park (5), Ty Terrell Track Stadium (6), Montagne Center (7), Liberia Park (8), Cardinal Stadium (9). Display/hide their locations on the map
2,868 married couples with children.
2,214 single-parent households (412 men, 1,802 women).
79.9% of residents of 77705 zip code speak English at home.
16.5% of residents speak Spanish at home (71% very well, 13% well, 9% not well, 7% not at all).
2.2% of residents speak other Indo-European language at home (47% very well, 36% well, 18% not well).
0.9% of residents speak Asian or Pacific Island language at home (73% very well, 13% well, 14% not well).
0.4% of residents speak other language at home (73% very well, 5% well, 22% not well).
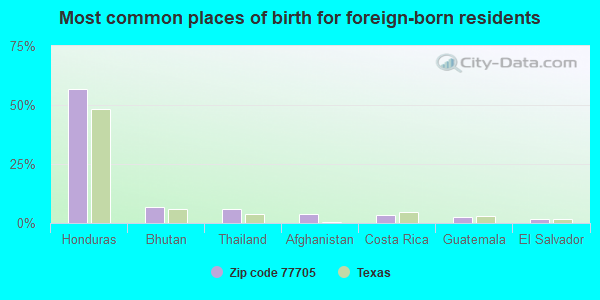
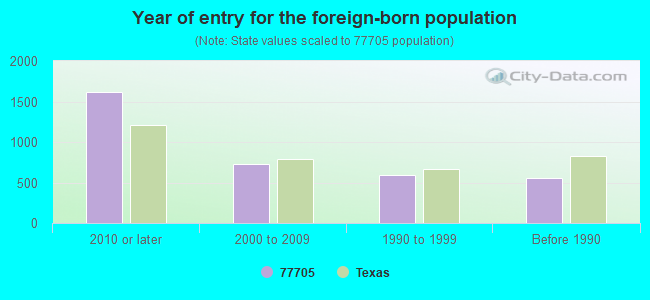
Foreign born population: 3,066 (7.8%) (31.8% of them are naturalized citizens)
Facilities with environmental interests located in this zip code:
AL PRICE STATE JUVENILE CORREC (3890 FM 3514 in BEAUMONT, TX)
(National Center for Education Statistics) - STATE ID-123915001 Organizations: AL PRICE STATE JUVENILE CORRECTION (SCHOOL DISTRICT)
AMOCO PIPELINE COMPANY BEAUMONT TERMINAL (6275 HIGHWAY 347 in BEAUMONT, TX)
Conditionally Exempt Small Quantity Generators, less than 100 kg/month of hazardous waste (Resource Conservation and Recovery Act (tracking hazardous waste)) TSD (Resource Conservation and Recovery Act (tracking hazardous waste)) TRI REPORTER (Tracking of toxic chemicals releasing facilities) Business SIC classification: PETROLEUM BULK STATIONS AND TERMINALS Organizations: OILTANKING BEAUMONT PARTNERS LP (CONTACT/OPERATOR)
Alternative names: BP/AMOCO
ACKER RELIABLE (4898 HIGHLAND AVE in BEAUMONT, TX)
(Resource Conservation and Recovery Act (tracking hazardous waste))
AVENUE A CLEANERS (3335 AVE A in BEAUMONT, TX)
(Resource Conservation and Recovery Act (tracking hazardous waste)) Alternative names: AVENUE A CLNRS
A & B BUILDERS INC (5410 GORMAN RD in BEAUMONT, TX)
Conditionally Exempt Small Quantity Generators, less than 100 kg/month of hazardous waste (Resource Conservation and Recovery Act (tracking hazardous waste)) - notification
ACTION TRANS (RT 4 BOX 96 in BEAUMONT, TX)
Conditionally Exempt Small Quantity Generators, less than 100 kg/month of hazardous waste (Resource Conservation and Recovery Act (tracking hazardous waste)) - notification Organizations: FRANKLIN L MCCRAY JR (CONTACT/OWNER)
ARCENEAUXS WRECKER SVC (HWY 365N 200 YDS ON GOULDING in BEAUMONT, TX)
Conditionally Exempt Small Quantity Generators, less than 100 kg/month of hazardous waste (Resource Conservation and Recovery Act (tracking hazardous waste)) - notification Organizations: GENE ARCENEAUX (CONTACT/OWNER)
AIR LIQUIDE AMERICA CORP (6895 HWY 347 in BEAUMONT, TX)
TRI REPORTER (Tracking of toxic chemicals releasing facilities) Business SIC classification: INDUSTRIAL GASES Alternative names: AIR LIQUID AMERICA CORP.
Housing units lacking complete plumbing facilities: 3.0% Housing units lacking complete kitchen facilities: 4.4%
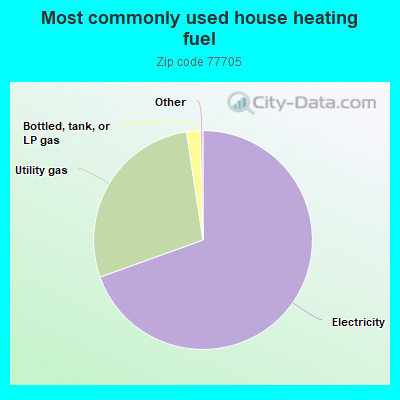
69.5%Electricity
28.1%Utility gas
2.0%Bottled, tank, or LP gas
Population in 1990: 26,134. Population change in the 1990s: +13,798 (+52.8%).
Place of birth for U.S.-born residents:
This state: 27,400
Northeast: 440
Midwest: 1,216
South: 4,866
West: 1,784
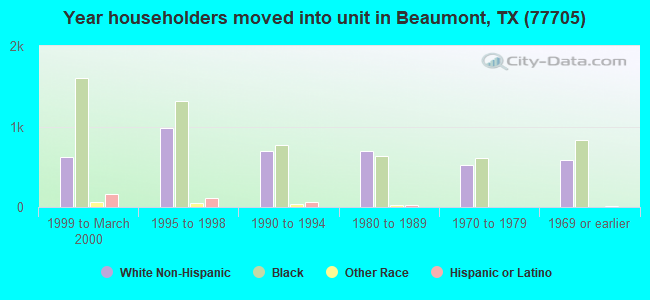
53% of the 77705 zip code residents lived in the same house 5 years ago. Out of people who lived in different houses, 50% lived in this county. Out of people who lived in different counties, 50% lived in Texas.
74% of the 77705 zip code residents lived in the same house 1 year ago. Out of people who lived in different houses, 14% moved from this county. Out of people who lived in different houses, 75% moved from different county within same state. Out of people who lived in different houses, 5% moved from different state. Out of people who lived in different houses, 9% moved from abroad.
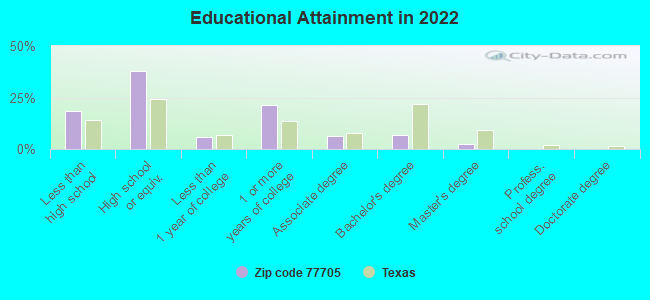
Private vs. public school enrollment:
Students in private schools in grades 1 to 8 (elementary and middle school): 234
Here:
10.1%
Texas:
8.8%
Students in private schools in grades 9 to 12 (high school): 70
Here:
5.2%
Texas:
8.0%
Students in private undergraduate colleges: 335
Here:
14.0%
Texas:
16.2%
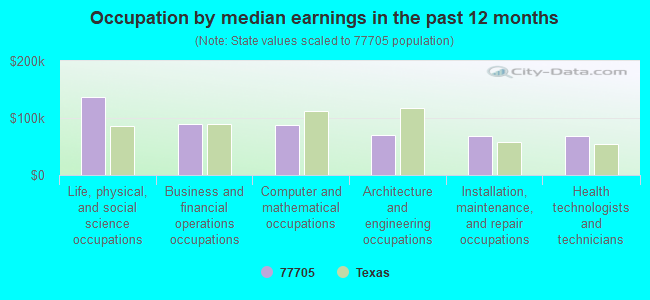
Occupation by median earnings in the past 12 months ($)
136,215Life, physical, and social science occupations
90,025Business and financial operations occupations
87,464Computer and mathematical occupations
69,552Architecture and engineering occupations
68,194Installation, maintenance, and repair occupations
67,630Health technologists and technicians
Companies with biggest federal contracts located in this zip code (BEAUMONT, TX):
W B CONSTRUCTION INC (7055 FANNETT ROAD; small business) : $2,880,855 in 8 contractsfrom 2000 to 2001
Contracts for Construction of Structures and Facilities -- Airport Runways, Maintenance, Repair and Rebuilding of Equipment -- Electric Wire, and Power and Distribution Equipment by Air Force, Maritime Administration Signed by year:2000: $2,859,824; 2001: $21,031; 2002: $0; 2003: $0; 2004: $0; 2005: $0; 2006: $0.
Biggest contracts:
$2,390,785 with Air Force for Construction of Structures and Facilities -- Airport Runways. Signed on 2000-09-29. Completion date: 2001-04-30.
$210,000 with Maritime Administration for Maintenance, Repair and Rebuilding of Equipment -- Electric Wire, and Power and Distribution Equipment. Taking place in CA. Signed on 2000-03-15. Completion date: 2000-08-15.
$201,929 with Air Force for Construction of Structures and Facilities -- Airport Runways. Signed on 2000-03-20. Completion date: 2000-07-31.
$46,472, same as above.Signed on 2000-02-09. Completion date: 2000-07-14.
UNITED MARINE ENTERPRISE INC (1325 SPINDLETOP AVE; small business) : $1,603,555 in 13 contractsfrom 1999 to 2002
Contracts for Prefabricated and Portable Buildings, Non-nuclear Ship Repair (East) Ship repair (including overhauls and conversions) performed on non-nuclear propelled and nonpropelled ships east of the 108th meridian, Centrifugals, Separators, and Pressure and Vacuum Filters, Miscellaneous Ship and Marine Equipment by Navy, United States Coast Guard (disused code: now 7008), National Oceanic and Atmospheric Administration/Under Secretary for Oceans and Atmosphere Signed by year:2000: $433,000; 2001: -$1,000; 2002: $820,555; 2003: $0; 2004: $0; 2005: $0; 2006: $0.
Biggest contracts:
$820,555 with Navy for Prefabricated and Portable Buildings. Signed on 2002-07-02. Completion date: 2002-07-01.
$345,000 with United States Coast Guard (disused code: now 7008) for Non-nuclear Ship Repair (East) Ship repair (including overhauls and conversions) performed on non-nuclear propelled and nonpropelled ships east of the 108th meridian. Signed on 2000-12-15. Completion date: 2001-03-15.
$241,000 with Navy for Centrifugals, Separators, and Pressure and Vacuum Filters. Signed on 1999-10-20. Completion date: 2000-01-26.
$110,000 with United States Coast Guard (disused code: now 7008) for Non-nuclear Ship Repair (East) Ship repair (including overhauls and conversions) performed on non-nuclear propelled and nonpropelled ships east of the 108th meridian. Signed on 1999-12-15. Completion date: 2000-02-15.
LB BEAUMONT LLC (2355 INTERSTATE 10 SOUTH) : $690,223 in 17 contractsfrom 2000 to 2005
Contracts for Lease or Rental of Facilities -- Family Housing Facilities, Lodging - Hotel/Motel, Food Items For Resale by Army, Air Force Signed by year:2000: $80,407; 2001: $162,598; 2002: $48,690; 2003: $0; 2004: $137,422; 2005: $261,106; 2006: $0.
Biggest contracts:
$140,925 with Army for Lease or Rental of Facilities -- Family Housing Facilities. Signed on 2005-06-09. Completion date: 2005-09-30.
$101,250, same as above.Signed on 2005-01-05. Completion date: 2005-09-30.
$100,842 with Air Force for Lodging - Hotel/Motel. Taking place in NM. Signed on 2004-08-10. Completion date: 2004-09-19.
$80,407 with Army for Lodging - Hotel/Motel. Signed on 2000-09-08. Completion date: 2000-11-01.
INDUSTRIAL MAINTENANCE & PIPIN (1670 E CARDIANL DR; small business) : $552,289 in 7 contractsfrom 1999 to 2001
Contracts for Maintenance, Repair or Alteration of Real Property -- Other Non-Building Facilities, Maintenance, Repair and Rebuilding of Equipment -- Electrical and Electronic Equipment Components by Army Signed by year:2000: $318,072; 2001: -$58,592; 2002: $0; 2003: $0; 2004: $0; 2005: $0; 2006: $0.
Biggest contracts:
$219,061 with Army for Maintenance, Repair or Alteration of Real Property -- Other Non-Building Facilities. Signed on 1999-12-16. Completion date: 2000-11-30.
$138,941, same as above.Signed on 2000-06-27. Completion date: 2000-11-30.
$116,552, same as above.Signed on 2000-08-10. Completion date: 2001-03-29.
$62,579 with Army for Maintenance, Repair and Rebuilding of Equipment -- Electrical and Electronic Equipment Components. Signed on 2000-08-29. Completion date: 2001-04-13.
PINEAPPLE PARTNERS OF BEAUMONT (2265 I-H10 SOUTH) : $526,565 in 6 contractsfrom 2003 to 2005
Contracts for Lodging - Hotel/Motel, Lease or Rental of Facilities -- Family Housing Facilities by Army Signed by year:2000: $0; 2001: $0; 2002: $0; 2003: $515,375; 2004: $79,800; 2005: -$68,610; 2006: $0.
Biggest contracts:
$380,000 with Army for Lodging - Hotel/Motel. Signed on 2004-03-30. Completion date: 2004-01-31.
$277,875, same as above.Signed on 2003-12-30. Completion date: 2004-01-31.
$237,500, same as above.Signed on 2003-12-06. Completion date: 2004-01-31.
$30,000 with Army for Lease or Rental of Facilities -- Family Housing Facilities. Signed on 2005-01-05. Completion date: 2005-09-30.
HAMMONS, JOHN Q HOTELS, LP (3950 IH-10 SOUTH @ WALDEN) : $514,027 in 24 contractsfrom 2002 to 2006
Contracts for Lodging - Hotel/Motel, Lease or Rental of Facilities -- Family Housing Facilities by Army Signed by year:2000: $0; 2001: $0; 2002: $4,235; 2003: $202,215; 2004: $288,830; 2005: $61,578; 2006: -$42,831.
Biggest contracts:
$140,000 with Army for Lodging - Hotel/Motel. Signed on 2003-06-10. Completion date: 2003-09-10.
$110,000, same as above.Signed on 2004-06-18. Completion date: 2004-09-01.
$95,800 with Army for Lease or Rental of Facilities -- Family Housing Facilities. Signed on 2005-01-06. Completion date: 2005-09-30.
$89,430 with Army for Lodging - Hotel/Motel. Signed on 2004-01-08. Completion date: 2004-01-08.
J & J MANUFACTURING CO, INC (5457 OHIO ST; small business) : $132,360 in 2 contractsin 2005
$76,480 with Army for Special Service Vessels. Signed on 2005-07-21. Completion date: 2005-09-06.
$55,880 with Army for Specialized Ammunition and Ordnance Machinery and Related Equipment. Signed on 2005-08-10. Completion date: 2005-09-26.
TEXAS INFRARED (1205 W CARDINAL DR; small business) : $66,460 in 4 contractsfrom 2004 to 2006
$45,470 with Army for Physical Properties Testing and Inspection. Signed on 2004-09-28. Completion date: 2004-10-29.
$8,995 with Army for Other Education and Training Services. Signed on 2006-01-05. Completion date: 2005-12-23.
$8,995, same as above.Signed on 2006-01-12. Completion date: 2005-12-23.
$3,000 with Army for Photographic Equipment and Accessories. Signed on 2005-05-17. Completion date: 2005-06-30.
OLGUIN BROTHERS (6875 FANNETT ROAD; small business) : $40,747 in 10 contractsfrom 2003 to 2005
Contracts for Landscaping/Groundskeeping Services by Army Signed by year:2000: $0; 2001: $0; 2002: $0; 2003: $13,007; 2004: $13,870; 2005: $13,870; 2006: $0.
Biggest contracts:
$8,370 with Army for Landscaping/Groundskeeping Services. Signed on 2005-07-28. Completion date: 2006-08-31.
$8,370, same as above.Signed on 2004-08-10. Completion date: 2005-08-31.
$5,670, same as above.Signed on 2003-09-05. Completion date: 2004-08-31.
$5,500, same as above.Signed on 2005-08-12. Completion date: 2005-08-31.
FEDERAL CORRECTIONAL COMPLEX B (4550 HEBERT RD) : $38,306 in 8 contractsfrom 2003 to 2004
Contracts for Maintenance, Repair and Rebuilding of Equipment -- Ground Effect Vehicles, Motor Vehicles, Trailers, and Cycles by Army Signed by year:2000: $0; 2001: $0; 2002: $0; 2003: $35,405; 2004: $2,901; 2005: $0; 2006: $0.
Biggest contracts:
$11,436 with Army for Maintenance, Repair and Rebuilding of Equipment -- Ground Effect Vehicles, Motor Vehicles, Trailers, and Cycles. Signed on 2003-02-12. Completion date: 2003-02-26.
$10,000, same as above.Signed on 2003-02-20. Completion date: 2003-02-17.
$6,654, same as above.Signed on 2004-09-27. Completion date: 2004-09-27.
$6,450, same as above.Signed on 2003-01-17. Completion date: 2003-02-20.
Top industries in this zip code by the number of employees in 2005:
Other Services (except Public Administration): Commercial and Industrial Machinery and Equipment (except Automotive and Electronic) Repair and Maintenance (100-249: 1, 20-49: 1, 10-19: 3, 5-9: 1, 1-4: 2)
Other Services (except Public Administration): Religious Organizations (50-99: 1, 20-49: 1, 10-19: 3, 5-9: 7, 1-4: 5)
People in group quarters in 2010:
6,045 people in state prisons
4,772 people in federal prisons
1,949 people in college/university student housing
871 people in local jails and other municipal confinement facilities
207 people in correctional facilities intended for juveniles
4 people in maritime/merchant vessels
2 people in other noninstitutional facilities
People in group quarters in 2000:
5,587 people in federal prisons and detention centers
5,456 people in state prisons
847 people in local jails and other confinement facilities (including police lockups)
596 people in college dormitories (includes college quarters off campus)
24 people in halfway houses
23 people in unknown juvenile institutions
19 people in homes or halfway houses for drug/alcohol abuse
8 people in mental (psychiatric) hospitals or wards
7 people in religious group quarters
Fatal accident statistics in 2014:
Fatal accident count: 6
Vehicles involved in fatal accidents: 8
Fatal accidents caused by drunken drivers: 1
Fatalities: 7
Persons involved in fatal accidents: 11
Pedestrians involved in fatal accidents: 2
Fatal accident statistics in 2013:
Fatal accident count: 4
Vehicles involved in fatal accidents: 9
Fatal accidents caused by drunken drivers: 1
Fatalities: 4
Persons involved in fatal accidents: 15
Pedestrians involved in fatal accidents: 0
Home Mortgage Disclosure Act Aggregated Statistics For Year 2009 (Based on 8 full and 20 partial tracts)
A) FHA, FSA/RHS & VA Home Purchase Loans
B) Conventional Home Purchase Loans
C) Refinancings
D) Home Improvement Loans
E) Loans on Dwellings For 5+ Families
F) Non-occupant Loans on < 5 Family Dwellings (A B C & D)
G) Loans On Manufactured Home Dwelling (A B C & D)
Number
Average Value
Number
Average Value
Number
Average Value
Number
Average Value
Number
Average Value
Number
Average Value
Number
Average Value
LOANS ORIGINATED
101
$129,866
154
$156,421
251
$138,745
49
$54,664
1
$123,000
19
$47,501
19
$54,559
APPLICATIONS APPROVED, NOT ACCEPTED
10
$105,540
23
$145,745
41
$135,881
17
$30,323
0
$0
3
$74,697
7
$53,717
APPLICATIONS DENIED
23
$91,022
59
$97,818
136
$115,421
123
$23,448
0
$0
9
$39,628
21
$45,695
APPLICATIONS WITHDRAWN
4
$119,382
12
$145,779
71
$128,081
11
$42,915
0
$0
6
$84,533
1
$91,710
FILES CLOSED FOR INCOMPLETENESS
8
$97,506
7
$101,531
24
$168,291
8
$69,672
0
$0
1
$49,000
6
$54,673
Aggregated Statistics For Year 2008 (Based on 8 full and 20 partial tracts)
A) FHA, FSA/RHS & VA Home Purchase Loans
B) Conventional Home Purchase Loans
C) Refinancings
D) Home Improvement Loans
E) Loans on Dwellings For 5+ Families
F) Non-occupant Loans on < 5 Family Dwellings (A B C & D)
G) Loans On Manufactured Home Dwelling (A B C & D)
Number
Average Value
Number
Average Value
Number
Average Value
Number
Average Value
Number
Average Value
Number
Average Value
Number
Average Value
LOANS ORIGINATED
79
$127,277
196
$128,551
210
$118,703
119
$45,582
0
$0
26
$62,062
31
$40,447
APPLICATIONS APPROVED, NOT ACCEPTED
7
$89,593
54
$80,335
35
$102,097
39
$46,325
1
$2,219,000
5
$43,352
35
$48,710
APPLICATIONS DENIED
33
$111,137
96
$99,932
165
$108,297
145
$37,465
0
$0
24
$79,003
39
$65,001
APPLICATIONS WITHDRAWN
10
$103,587
20
$102,814
48
$100,980
10
$84,521
0
$0
7
$88,589
2
$67,985
FILES CLOSED FOR INCOMPLETENESS
8
$96,580
2
$95,975
8
$104,201
9
$15,156
0
$0
1
$62,000
2
$41,495
Aggregated Statistics For Year 2007 (Based on 9 full and 20 partial tracts)
A) FHA, FSA/RHS & VA Home Purchase Loans
B) Conventional Home Purchase Loans
C) Refinancings
D) Home Improvement Loans
E) Loans on Dwellings For 5+ Families
F) Non-occupant Loans on < 5 Family Dwellings (A B C & D)
G) Loans On Manufactured Home Dwelling (A B C & D)
Number
Average Value
Number
Average Value
Number
Average Value
Number
Average Value
Number
Average Value
Number
Average Value
Number
Average Value
LOANS ORIGINATED
44
$93,775
366
$118,512
267
$103,206
157
$37,691
4
$476,308
68
$51,422
20
$57,588
APPLICATIONS APPROVED, NOT ACCEPTED
10
$65,349
79
$86,444
54
$98,643
31
$38,381
0
$0
7
$46,767
39
$55,365
APPLICATIONS DENIED
16
$103,905
139
$87,341
303
$91,786
232
$32,456
0
$0
63
$61,339
53
$48,332
APPLICATIONS WITHDRAWN
10
$76,079
54
$106,655
129
$104,729
17
$48,151
0
$0
10
$100,015
3
$53,020
FILES CLOSED FOR INCOMPLETENESS
0
$0
15
$124,429
37
$108,814
5
$35,274
0
$0
7
$47,887
0
$0
Aggregated Statistics For Year 2006 (Based on 9 full and 20 partial tracts)
A) FHA, FSA/RHS & VA Home Purchase Loans
B) Conventional Home Purchase Loans
C) Refinancings
D) Home Improvement Loans
E) Loans on Dwellings For 5+ Families
F) Non-occupant Loans on < 5 Family Dwellings (A B C & D)
G) Loans On Manufactured Home Dwelling (A B C & D)
Number
Average Value
Number
Average Value
Number
Average Value
Number
Average Value
Number
Average Value
Number
Average Value
Number
Average Value
LOANS ORIGINATED
64
$82,148
472
$100,824
214
$96,928
138
$39,138
4
$1,243,508
88
$50,299
50
$47,151
APPLICATIONS APPROVED, NOT ACCEPTED
2
$30,905
100
$77,559
78
$78,970
24
$30,580
0
$0
19
$62,632
41
$43,961
APPLICATIONS DENIED
10
$73,372
193
$61,026
282
$86,508
193
$25,664
0
$0
74
$41,260
80
$43,015
APPLICATIONS WITHDRAWN
5
$79,632
64
$121,504
209
$97,667
27
$39,361
0
$0
15
$75,237
1
$66,000
FILES CLOSED FOR INCOMPLETENESS
0
$0
10
$99,805
31
$79,296
1
$24,950
0
$0
4
$98,220
0
$0
Aggregated Statistics For Year 2005 (Based on 8 full and 20 partial tracts)
A) FHA, FSA/RHS & VA Home Purchase Loans
B) Conventional Home Purchase Loans
C) Refinancings
D) Home Improvement Loans
E) Loans on Dwellings For 5+ Families
F) Non-occupant Loans on < 5 Family Dwellings (A B C & D)
G) Loans On Manufactured Home Dwelling (A B C & D)
Number
Average Value
Number
Average Value
Number
Average Value
Number
Average Value
Number
Average Value
Number
Average Value
Number
Average Value
LOANS ORIGINATED
60
$81,598
365
$109,052
320
$103,435
109
$60,609
0
$0
70
$56,937
20
$38,598
APPLICATIONS APPROVED, NOT ACCEPTED
1
$144,920
99
$69,997
74
$69,058
41
$39,316
0
$0
17
$51,096
42
$37,878
APPLICATIONS DENIED
22
$74,954
187
$53,493
372
$74,588
196
$27,632
4
$164,970
55
$42,917
85
$43,140
APPLICATIONS WITHDRAWN
10
$72,567
64
$101,435
218
$125,667
55
$198,778
0
$0
18
$121,172
4
$60,680
FILES CLOSED FOR INCOMPLETENESS
0
$0
15
$95,719
57
$92,636
9
$61,494
0
$0
9
$84,641
2
$94,470
Aggregated Statistics For Year 2004 (Based on 9 full and 20 partial tracts)
A) FHA, FSA/RHS & VA Home Purchase Loans
B) Conventional Home Purchase Loans
C) Refinancings
D) Home Improvement Loans
E) Loans on Dwellings For 5+ Families
F) Non-occupant Loans on < 5 Family Dwellings (A B C & D)
G) Loans On Manufactured Home Dwelling (A B C & D)
Number
Average Value
Number
Average Value
Number
Average Value
Number
Average Value
Number
Average Value
Number
Average Value
Number
Average Value
LOANS ORIGINATED
65
$72,080
351
$92,949
525
$96,261
154
$49,294
1
$960,000
89
$37,621
35
$45,770
APPLICATIONS APPROVED, NOT ACCEPTED
1
$35,000
87
$62,791
84
$80,480
30
$39,888
0
$0
20
$48,321
22
$53,007
APPLICATIONS DENIED
4
$77,568
132
$57,334
541
$63,346
181
$30,136
3
$347,267
58
$44,048
54
$40,660
APPLICATIONS WITHDRAWN
17
$66,791
44
$89,466
213
$81,042
28
$39,034
0
$0
12
$58,627
1
$45,290
FILES CLOSED FOR INCOMPLETENESS
0
$0
12
$91,602
91
$87,129
5
$20,948
0
$0
0
$0
0
$0
Aggregated Statistics For Year 2003 (Based on 11 full and 20 partial tracts)
A) FHA, FSA/RHS & VA Home Purchase Loans
B) Conventional Home Purchase Loans
C) Refinancings
D) Home Improvement Loans
E) Loans on Dwellings For 5+ Families
F) Non-occupant Loans on < 5 Family Dwellings (A B C & D)
Number
Average Value
Number
Average Value
Number
Average Value
Number
Average Value
Number
Average Value
Number
Average Value
LOANS ORIGINATED
61
$72,401
338
$97,309
771
$94,789
103
$27,320
3
$121,877
64
$49,653
APPLICATIONS APPROVED, NOT ACCEPTED
3
$56,507
68
$69,707
112
$74,931
14
$49,207
0
$0
12
$30,664
APPLICATIONS DENIED
9
$71,747
196
$57,347
573
$73,461
121
$24,412
2
$13,245
47
$44,212
APPLICATIONS WITHDRAWN
10
$62,899
44
$96,566
220
$72,122
19
$18,387
0
$0
13
$51,020
FILES CLOSED FOR INCOMPLETENESS
0
$0
21
$76,944
28
$78,238
1
$9,480
0
$0
0
$0
Aggregated Statistics For Year 2002 (Based on 8 full and 4 partial tracts)
A) FHA, FSA/RHS & VA Home Purchase Loans
B) Conventional Home Purchase Loans
C) Refinancings
D) Home Improvement Loans
E) Loans on Dwellings For 5+ Families
F) Non-occupant Loans on < 5 Family Dwellings (A B C & D)
Number
Average Value
Number
Average Value
Number
Average Value
Number
Average Value
Number
Average Value
Number
Average Value
LOANS ORIGINATED
34
$58,761
165
$93,978
193
$73,529
58
$24,810
8
$208,156
32
$48,313
APPLICATIONS APPROVED, NOT ACCEPTED
1
$62,830
42
$60,486
67
$53,273
13
$13,104
0
$0
11
$34,930
APPLICATIONS DENIED
9
$62,028
81
$50,231
190
$51,697
75
$13,921
1
$600,000
33
$26,014
APPLICATIONS WITHDRAWN
4
$68,910
24
$69,605
94
$48,984
1
$33,190
0
$0
4
$32,952
FILES CLOSED FOR INCOMPLETENESS
1
$44,000
21
$51,455
31
$72,417
2
$20,000
0
$0
2
$42,500
Aggregated Statistics For Year 2001 (Based on 8 full and 4 partial tracts)
A) FHA, FSA/RHS & VA Home Purchase Loans
B) Conventional Home Purchase Loans
C) Refinancings
D) Home Improvement Loans
E) Loans on Dwellings For 5+ Families
F) Non-occupant Loans on < 5 Family Dwellings (A B C & D)
Number
Average Value
Number
Average Value
Number
Average Value
Number
Average Value
Number
Average Value
Number
Average Value
LOANS ORIGINATED
49
$57,231
155
$94,514
163
$67,805
71
$16,894
4
$625,492
35
$44,131
APPLICATIONS APPROVED, NOT ACCEPTED
2
$39,870
35
$68,883
44
$50,773
12
$22,731
0
$0
9
$37,363
APPLICATIONS DENIED
8
$54,196
76
$51,584
174
$47,552
82
$13,666
2
$778,000
40
$26,997
APPLICATIONS WITHDRAWN
9
$54,933
23
$81,243
125
$48,375
5
$21,742
0
$0
8
$48,992
FILES CLOSED FOR INCOMPLETENESS
2
$38,875
28
$37,149
18
$44,133
5
$23,996
0
$0
5
$19,350
Aggregated Statistics For Year 2000 (Based on 8 full and 4 partial tracts)
A) FHA, FSA/RHS & VA Home Purchase Loans
B) Conventional Home Purchase Loans
C) Refinancings
D) Home Improvement Loans
E) Loans on Dwellings For 5+ Families
F) Non-occupant Loans on < 5 Family Dwellings (A B C & D)
Number
Average Value
Number
Average Value
Number
Average Value
Number
Average Value
Number
Average Value
Number
Average Value
LOANS ORIGINATED
36
$63,390
175
$76,281
165
$42,492
68
$17,070
2
$1,420,000
28
$26,765
APPLICATIONS APPROVED, NOT ACCEPTED
1
$43,600
46
$42,895
50
$45,569
32
$16,495
0
$0
10
$21,253
APPLICATIONS DENIED
9
$47,719
119
$38,217
175
$34,331
88
$16,198
0
$0
21
$32,639
APPLICATIONS WITHDRAWN
5
$48,592
44
$77,202
100
$34,714
6
$24,580
0
$0
10
$30,310
FILES CLOSED FOR INCOMPLETENESS
2
$37,880
25
$43,819
34
$57,916
2
$14,995
0
$0
3
$22,627
Aggregated Statistics For Year 1999 (Based on 5 full and 10 partial tracts)
A) FHA, FSA/RHS & VA Home Purchase Loans
B) Conventional Home Purchase Loans
C) Refinancings
D) Home Improvement Loans
E) Loans on Dwellings For 5+ Families
F) Non-occupant Loans on < 5 Family Dwellings (A B C & D)
2002 - 2018 National Fire Incident Reporting System (NFIRS) incidents
According to the data from the years 2002 - 2018 the average number of fires per year is 137. The highest number of reported fires - 187 took place in 2005, and the least - 94 in 2007. The data has a declining trend.
When looking into fire subcategories, the most reports belonged to: Structure Fires (40.6%), and Outside Fires (32.8%).
Fire incident types reported to NFIRS in Zip Code 77705


 Nearest zip codes: 77622, 77707, 77627, 77701, 77713, 77702.


 According to the data from the years 2002 - 2018 the average number of fires per year is 137. The highest number of reported fires - 187 took place in 2005, and the least - 94 in 2007. The data has a declining trend.
 When looking into fire subcategories, the most reports belonged to: Structure Fires (40.6%), and Outside Fires (32.8%).