Crime rate in Beaumont, Texas (TX): murders, rapes, robberies, assaults, burglaries, thefts, auto thefts, arson, law enforcement employees, police officers, crime map
Crime rate in Beaumont, TX
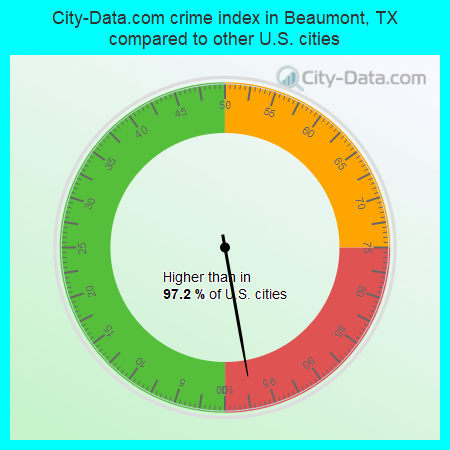
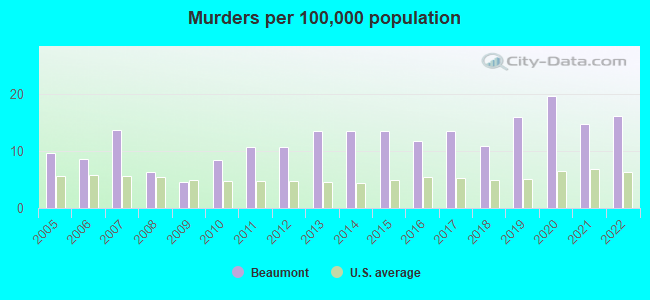
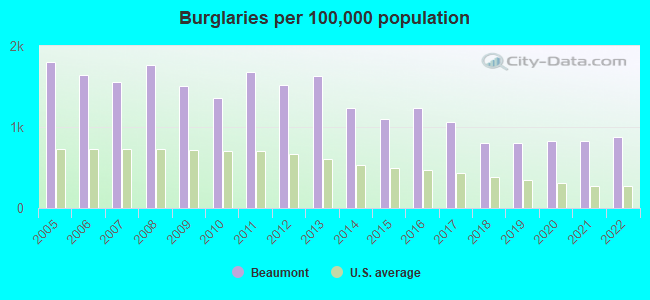
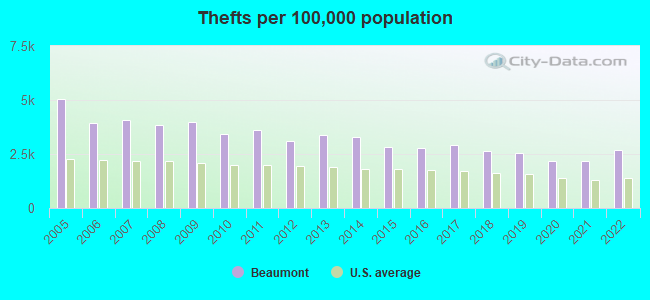
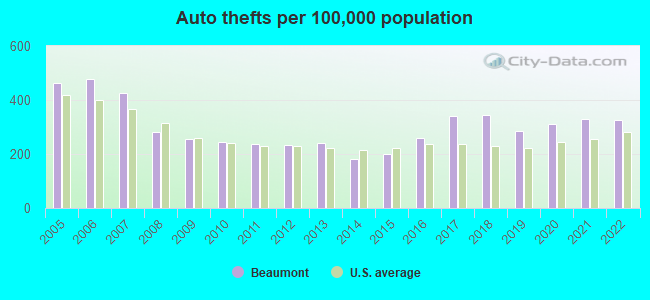
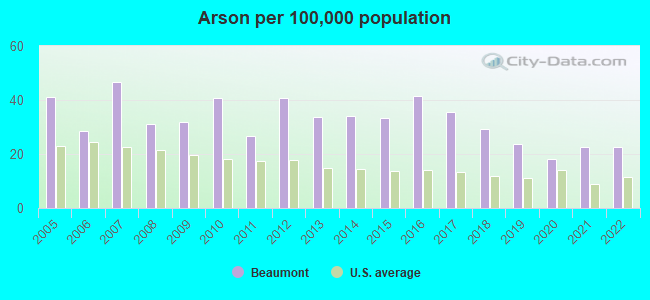
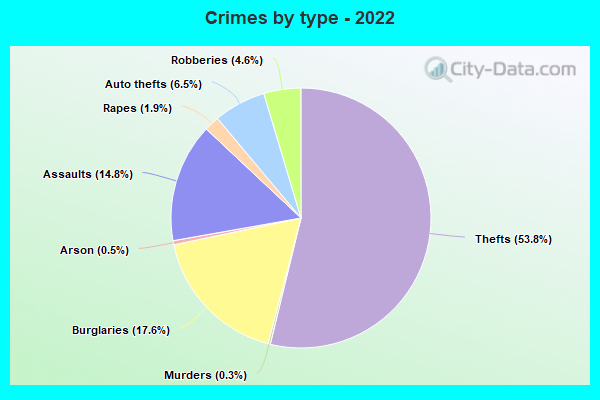
The 2022 crime rate in Beaumont, TX is 520 (City-Data.com crime index), which is 2.1 times higher than the U.S. average. It was higher than in 97.2% U.S. cities. The 2022 Beaumont crime rate rose by 7% compared to 2021. The number of homicides stood at 18 - an increase of 1 compared to 2021. In the last 5 years Beaumont has seen rise of violent crime and rise of property crime.See how dangerous Beaumont, TX is compared to the nearest cities:
(Note: Higher means more crime)
(Note: Higher means more crime)
| Beaumont: | 519.8 |
| Rose City: | 60.1 |
| Vidor: | 181.1 |
| Nederland: | 133.6 |
| Port Neches: | 144.7 |
| Lumberton: | 115.3 |
| Groves: | 159.4 |
| Sour Lake: | 60.9 |
| Bridge City: | 64.5 |
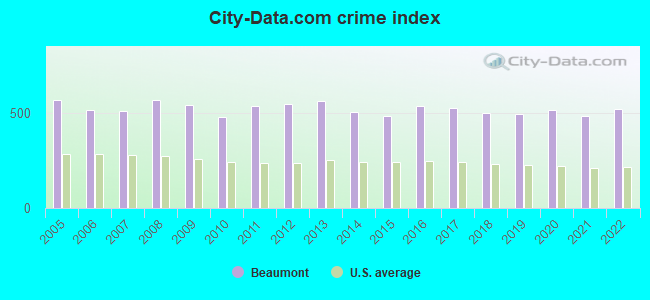
The City-Data.com crime index weighs serious crimes and violent crimes more heavily. Higher means more crime, U.S. average is 246.1. It adjusts for the number of visitors and daily workers commuting into cities.
- means the value is smaller than the state average.- means the value is about the same as the state average.
- means the value is bigger than the state average.
- means the value is much bigger than the state average.
According to our research of Texas and other state lists, there were 682 registered sex offenders living in Beaumont, Texas as of April 27, 2024.
The ratio of all residents to sex offenders in Beaumont is 174 to 1.
Violent crime rate in 2022
| Beaumont: | 611.8 |
| U.S. Average: | 219.8 |
Violent crime rate in 2021
| Beaumont: | 601.1 |
| U.S. Average: | 224.8 |
Violent crime rate in 2020
| Beaumont: | 677.4 |
| U.S. Average: | 228.2 |
Violent crime rate in 2019
| Beaumont: | 588.3 |
| U.S. Average: | 219.9 |
Violent crime rate in 2018
| Beaumont: | 586.4 |
| U.S. Average: | 221.2 |
Violent crime rate in 2017
| Beaumont: | 588.0 |
| U.S. Average: | 226.2 |
Violent crime rate in 2016
| Beaumont: | 610.4 |
| U.S. Average: | 227.3 |
Violent crime rate in 2015
| Beaumont: | 522.0 |
| U.S. Average: | 219.3 |
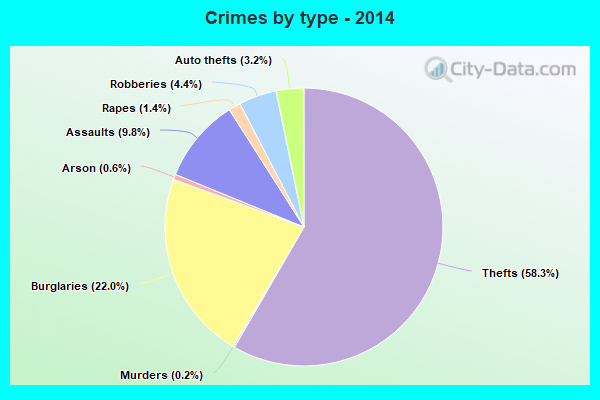
Violent crime rate in 2014
| Beaumont: | 504.2 |
| U.S. Average: | 211.1 |
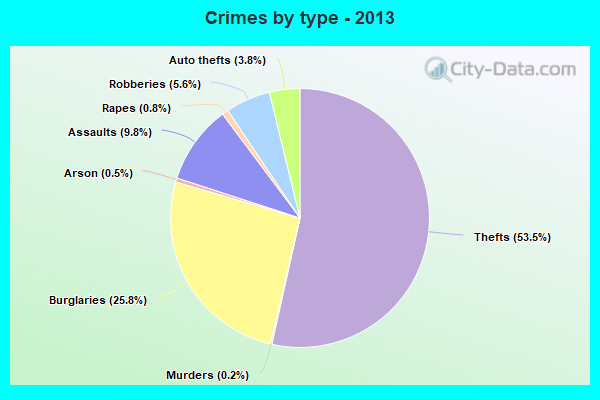
Violent crime rate in 2013
| Beaumont: | 563.6 |
| U.S. Average: | 214.2 |
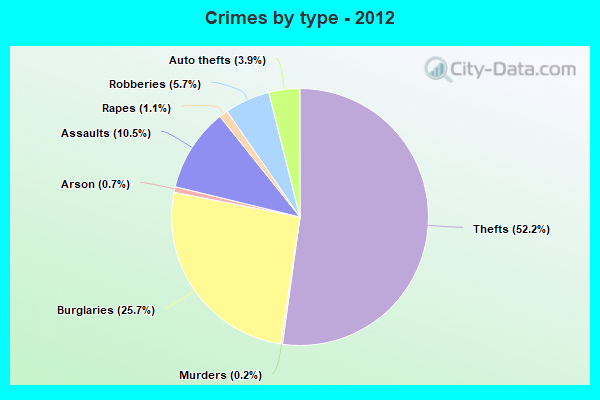
Violent crime rate in 2012
| Beaumont: | 563.9 |
| U.S. Average: | 187.4 |
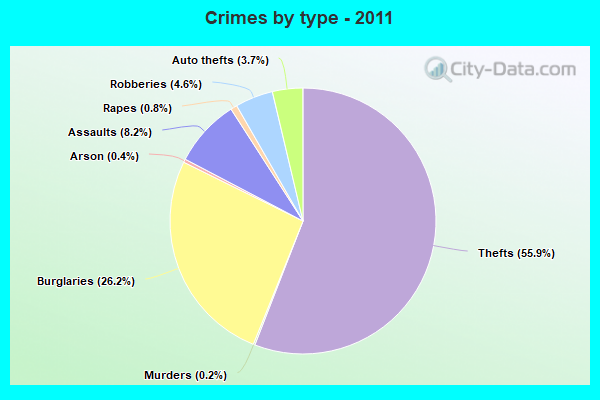
Violent crime rate in 2011
| Beaumont: | 485.6 |
| U.S. Average: | 187.1 |
Violent crime rate in 2010
| Beaumont: | 420.6 |
| U.S. Average: | 195.7 |
Violent crime rate in 2009
| Beaumont: | 494.4 |
| U.S. Average: | 208.9 |
Violent crime rate in 2008
| Beaumont: | 509.2 |
| U.S. Average: | 222.5 |
Violent crime rate in 2007
| Beaumont: | 469.0 |
| U.S. Average: | 229.1 |
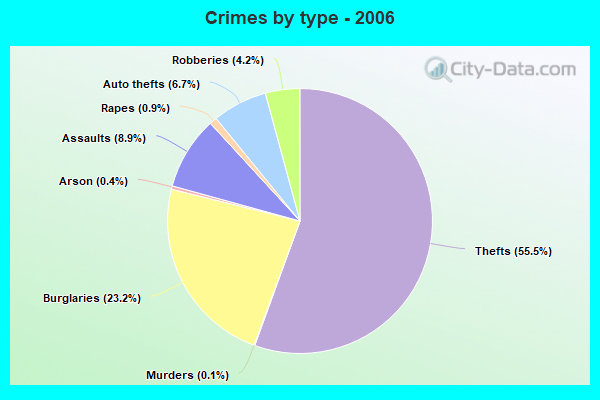
Violent crime rate in 2006
| Beaumont: | 472.7 |
| U.S. Average: | 232.6 |
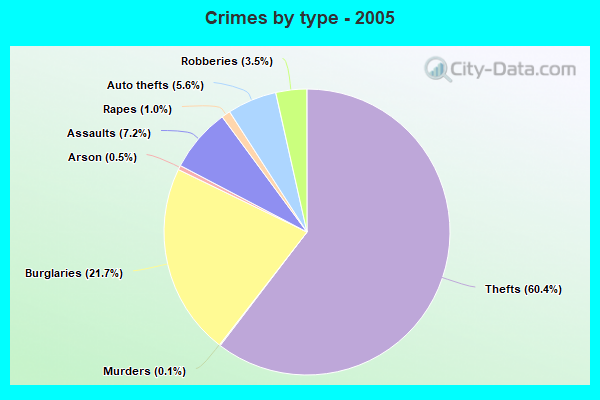
Violent crime rate in 2005
| Beaumont: | 476.1 |
| U.S. Average: | 227.0 |
Property crime rate in 2022
| Beaumont: | 358.0 |
| U.S. Average: | 166.5 |
Property crime rate in 2021
| Beaumont: | 322.8 |
| U.S. Average: | 157.8 |
Property crime rate in 2020
| Beaumont: | 320.6 |
| U.S. Average: | 169.6 |
Property crime rate in 2019
| Beaumont: | 329.5 |
| U.S. Average: | 179.7 |
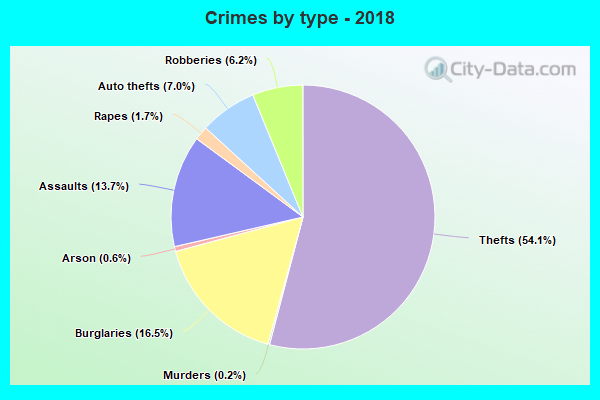
Property crime rate in 2018
| Beaumont: | 344.3 |
| U.S. Average: | 190.2 |
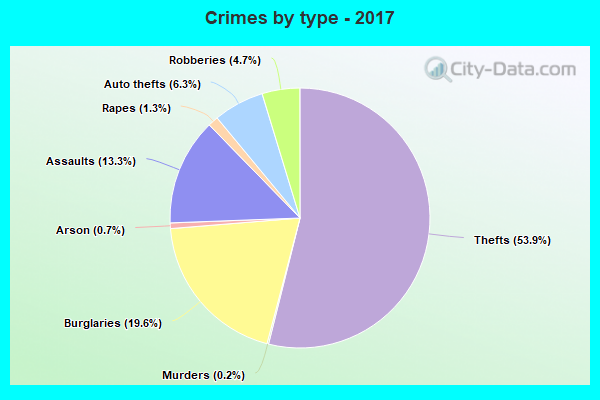
Property crime rate in 2017
| Beaumont: | 410.4 |
| U.S. Average: | 206.4 |
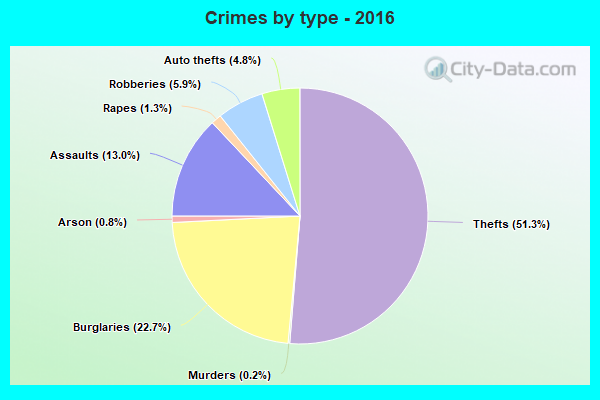
Property crime rate in 2016
| Beaumont: | 425.1 |
| U.S. Average: | 216.6 |
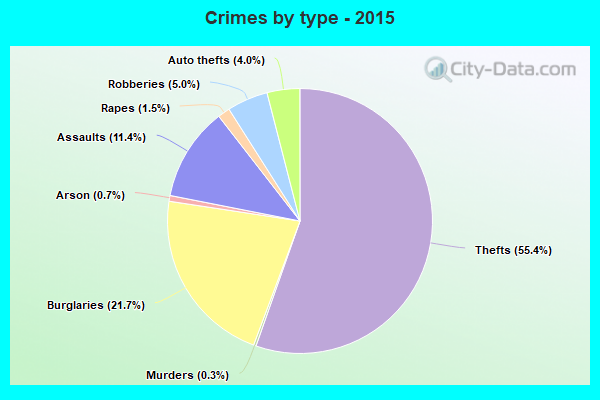
Property crime rate in 2015
| Beaumont: | 391.0 |
| U.S. Average: | 221.5 |
Property crime rate in 2014
| Beaumont: | 437.8 |
| U.S. Average: | 230.8 |
Property crime rate in 2013
| Beaumont: | 529.9 |
| U.S. Average: | 250.4 |
Property crime rate in 2012
| Beaumont: | 493.1 |
| U.S. Average: | 267.3 |
Property crime rate in 2011
| Beaumont: | 551.8 |
| U.S. Average: | 273.5 |
Property crime rate in 2010
| Beaumont: | 479.8 |
| U.S. Average: | 276.4 |
Property crime rate in 2009
| Beaumont: | 539.2 |
| U.S. Average: | 285.6 |
Property crime rate in 2008
| Beaumont: | 586.5 |
| U.S. Average: | 302.2 |
Property crime rate in 2007
| Beaumont: | 500.7 |
| U.S. Average: | 309.2 |
Property crime rate in 2006
| Beaumont: | 514.8 |
| U.S. Average: | 317.3 |
Property crime rate in 2005
| Beaumont: | 587.5 |
| U.S. Average: | 322.3 |


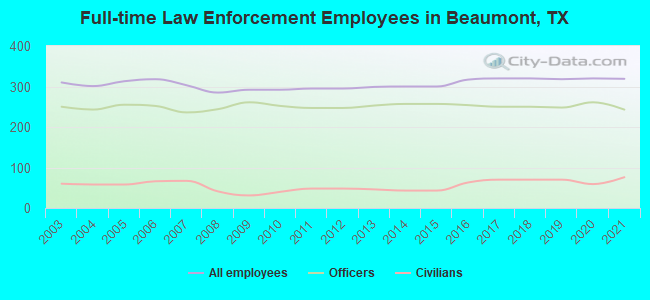
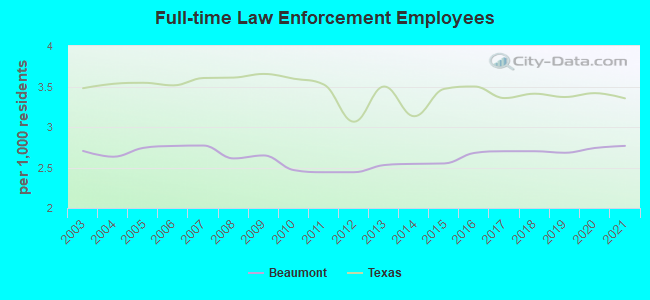
Full-time law enforcement employees in 2021, including police officers: 319 (243 officers - 219 male; 24 female).
| Officers per 1,000 residents here: | 2.11 |
| Texas average: | 2.07 |
Full-time law enforcement employees in 2020, including police officers: 320 (261 officers - 236 male; 25 female).
| Officers per 1,000 residents here: | 2.24 |
| Texas average: | 2.05 |
Full-time law enforcement employees in 2019, including police officers: 318 (248 officers - 222 male; 26 female).
| Officers per 1,000 residents here: | 2.09 |
| Texas average: | 2.02 |
Full-time law enforcement employees in 2017, including police officers: 320 (250 officers - 224 male; 26 female).
| Officers per 1,000 residents here: | 2.11 |
| Texas average: | 2.06 |
Full-time law enforcement employees in 2016, including police officers: 317 (254 officers - 225 male; 29 female).
| Officers per 1,000 residents here: | 2.15 |
| Texas average: | 2.11 |
Full-time law enforcement employees in 2015, including police officers: 300 (257 officers - 229 male; 28 female).
| Officers per 1,000 residents here: | 2.18 |
| Texas average: | 2.13 |
Full-time law enforcement employees in 2014, including police officers: 300 (257 officers - 229 male; 28 female).
| Officers per 1,000 residents here: | 2.18 |
| Texas average: | 2.01 |
Full-time law enforcement employees in 2013, including police officers: 299 (253 officers - 228 male; 25 female).
| Officers per 1,000 residents here: | 2.14 |
| Texas average: | 2.05 |
Full-time law enforcement employees in 2011, including police officers: 295 (247 officers - 222 male; 25 female).
| Officers per 1,000 residents here: | 2.04 |
| Texas average: | 2.17 |
Full-time law enforcement employees in 2010, including police officers: 292 (252 officers - 225 male; 27 female).
| Officers per 1,000 residents here: | 2.13 |
| Texas average: | 2.20 |
Full-time law enforcement employees in 2009, including police officers: 292 (261 officers - 233 male; 28 female).
| Officers per 1,000 residents here: | 2.37 |
| Texas average: | 2.23 |
Full-time law enforcement employees in 2008, including police officers: 285 (244 officers - 215 male; 29 female).
| Officers per 1,000 residents here: | 2.24 |
| Texas average: | 2.17 |
Full-time law enforcement employees in 2007, including police officers: 303 (236 officers - 208 male; 28 female).
| Officers per 1,000 residents here: | 2.16 |
| Texas average: | 2.18 |
Full-time law enforcement employees in 2006, including police officers: 318 (252 officers - 222 male; 30 female).
| Officers per 1,000 residents here: | 2.19 |
| Texas average: | 2.13 |
Full-time law enforcement employees in 2005, including police officers: 313 (255 officers - 225 male; 30 female).
| Officers per 1,000 residents here: | 2.23 |
| Texas average: | 2.18 |
Full-time law enforcement employees in 2004, including police officers: 301 (243 officers - 214 male; 29 female).
| Officers per 1,000 residents here: | 2.13 |
| Texas average: | 2.19 |
Full-time law enforcement employees in 2003, including police officers: 310 (250 officers - 221 male; 29 female).
| Officers per 1,000 residents here: | 2.18 |
| Texas average: | 2.17 |
Zip codes: 77627, 77701, 77702, 77703, 77705, 77706, 77707, 77708, 77713.