Carson, CA (California) Houses and Residents
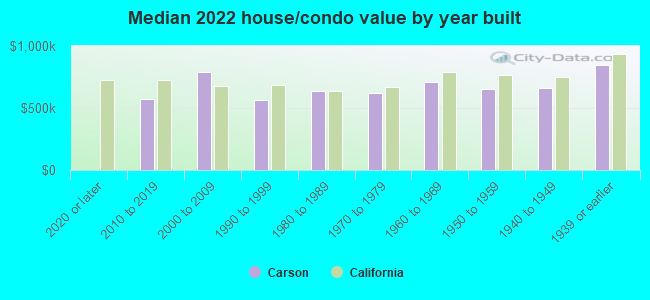
| Carson: | $676,400 |
| California: | $715,900 |
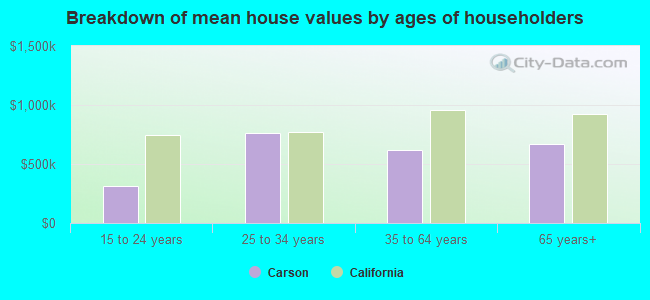
Mean price in 2022:
Detached houses: $734,387
Here: $734,387 State: $988,808 Townhouses or other attached units: $512,466
Here: $512,466 State: $838,546 In 3-to-4-unit structures: $366,884
Here: $366,884 State: $824,253 In 5-or-more-unit structures: $456,723
Here: $456,723 State: $730,996 Mobile homes: $205,025
Here: $205,025 State: $184,506
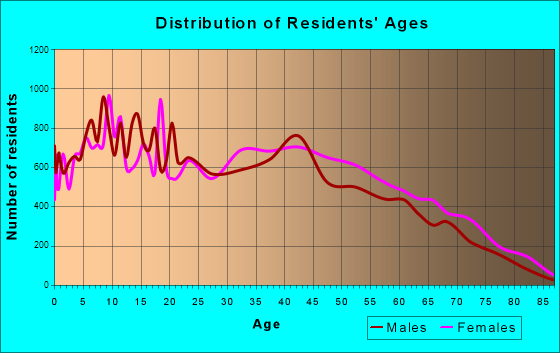
Total population: 93,271 (Urban population: 89,549, Rural population: 0)
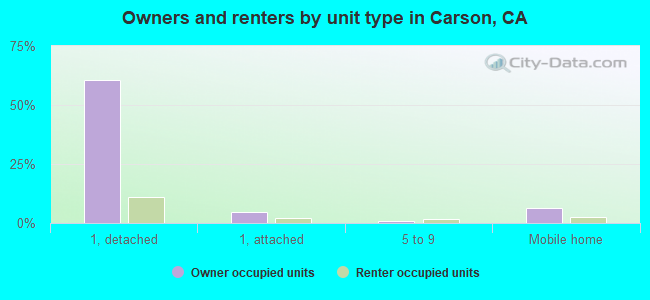
Houses: 28,759 (27,550 occupied: 20,271 owner occupied, 7,279 renter occupied)
| % of renters here: | 26% |
| State: | 44% |
Housing density: 1,526 houses/condos per square mile
Median price asked for vacant for-sale houses and condos in 2022: $365,661.
Median contract rent in 2022: $1,674 (lower quartile is $1,175, upper quartile is over $2,000)
Median rent asked for vacant for-rent units in 2022: $1,725
Median gross rent in Carson, CA in 2022: $1,736
Housing units in Carson with a mortgage: 13,726 (1,502 second mortgage, 0 home equity loan, 962 both second mortgage and home equity loan)
Houses without a mortgage: 58
Median household income for houses/condos with a mortgage: $123,385
Median household income for apartments without a mortgage: $87,999
Median monthly housing costs: $1,906
Compare current foreclosures in Carson, CA:
| Photo | Address | Area | Beds / Baths | Price | Details |
|---|---|---|---|---|---|

|
#1
Anchor Ave # 106
Carson, CA 90745
|
700 sq. feet
|
2 baths 2 beds |
show details | |

|
#2
Leapwood Ave
Carson, CA 90746
|
1,478 sq. feet
|
2 baths 4 beds |
show details | |

|
#3
E 215th Pl
Carson, CA 90745
|
1,225 sq. feet
|
2 baths 4 beds |
show details | |

|
#4
Harlan Ave
Carson, CA 90746
|
1,422 sq. feet
|
2 baths 3 beds |
show details | |

|
#5
E Lincoln St
Carson, CA 90745
|
1,422 sq. feet
|
2 baths 5 beds |
show details | |

|
#6
Marbella Ave
Carson, CA 90745
|
1,348 sq. feet
|
2 baths 3 beds |
show details | |

|
#7
Belshaw Ave
Carson, CA 90746
|
1,472 sq. feet
|
2 baths 4 beds |
show details | |

|
#8
Selwyn Ave
Carson, CA 90745
|
2,003 sq. feet
|
3 baths 4 beds |
show details | |

|
#9
Coslin Ave
Carson, CA 90746
|
1,877 sq. feet
|
2 baths 4 beds |
show details | |

|
#10
Maribel A 23
Carson, CA 90745
|
556 sq. feet
|
1 baths 1 beds |
show details |
| Photo | Address | Area | Beds / Baths | Price | Details |
|---|---|---|---|---|---|

|
#11
E 215th Pl
Carson, CA 90745
|
1,225 sq. feet
|
2 baths 4 beds |
show details | |

|
#12
E Helmick St
Carson, CA 90746
|
2,208 sq. feet
|
3 baths 4 beds |
show details | |

|
#13
Balsam Ct
Carson, CA 90746
|
1,656 sq. feet
|
3 baths 3 beds |
show details | |

|
#14
Billings Dr
Carson, CA 90746
|
1,410 sq. feet
|
2 baths 3 beds |
show details | |

|
#15
E Elsmere Dr
Carson, CA 90746
|
1,545 sq. feet
|
2 baths 4 beds |
show details | |

|
#16
Bayport 107
Carson, CA 90745
|
760 sq. feet
|
2 baths 2 beds |
show details | |

|
#17
E Gladwick St
Carson, CA 90746
|
2,186 sq. feet
|
3 baths 5 beds |
show details | |

|
#18
E Helmick St
Carson, CA 90746
|
1,978 sq. feet
|
2 baths 5 beds |
show details | |

|
#19
Palamino Ln
Carson, CA 90745
|
1,121 sq. feet
|
2 baths 3 beds |
show details | |

|
#20
Craigjon Ave
Carson, CA 90746
|
2,522 sq. feet
|
3 baths 4 beds |
show details |
| Photo | Address | Area | Beds / Baths | Price | Details |
|---|---|---|---|---|---|

|
#21
Belforest Dr
Carson, CA 90746
|
1,983 sq. feet
|
3 baths 4 beds |
show details | |

|
#22
E Cassidy St
Carson, CA 90746
|
1,402 sq. feet
|
2 baths 3 beds |
show details | |

|
#23
Shearer Ave
Carson, CA 90745
|
1,060 sq. feet
|
2 baths 3 beds |
show details | |

|
#24
Nicolle Ave
Carson, CA 90745
|
2,361 sq. feet
|
3 baths 5 beds |
show details | |

|
#25
E Lincoln St
Carson, CA 90745
|
1,422 sq. feet
|
2 baths 5 beds |
show details | |

|
#26
E 222nd St
Carson, CA 90745
|
2,085 sq. feet
|
3 baths 4 beds |
show details | |

|
#27
Dovecote Ln
Carson, CA 90745
|
1,121 sq. feet
|
2 baths 3 beds |
show details | |

|
#28
E 220th St
Carson, CA 90745
|
2,169 sq. feet
|
3 baths 4 beds |
show details | |

|
#29
Ravenna Ave
Carson, CA 90745
|
1,988 sq. feet
|
4 baths 4 beds |
show details | |

|
#30
Grace Ave
Carson, CA 90745
|
1,088 sq. feet
|
1 baths 3 beds |
show details |
| Photo | Address | Area | Beds / Baths | Price | Details |
|---|---|---|---|---|---|

|
#31
E 228th St
Carson, CA 90745
|
1,575 sq. feet
|
2 baths 4 beds |
show details | |

|
#32
Carmel Dr
Carson, CA 90745
|
1,903 sq. feet
|
3 baths 4 beds |
show details | |

|
#33
Sudbury Ct
Carson, CA 90746
|
1,849 sq. feet
|
3 baths 3 beds |
show details | |

|
#34
Indian School Ln
Carson, CA 90745
|
1,111 sq. feet
|
2 baths 3 beds |
show details | |

|
#35
Coslin Ave
Carson, CA 90746
|
1,877 sq. feet
|
2 baths 4 beds |
show details | |

|
#36
E 214th St
Carson, CA 90745
|
878 sq. feet
|
1 baths 2 beds |
show details | |

|
#37
E 215th Pl
Carson, CA 90745
|
1,636 sq. feet
|
2 baths 4 beds |
show details | |

|
#38
Nicolle Ave
Carson, CA 90745
|
1,876 sq. feet
|
3 baths 5 beds |
show details | |

|
#39
Weiser Ave
Carson, CA 90746
|
1,254 sq. feet
|
2 baths 3 beds |
show details | |

|
#40
W 232nd Pl
Carson, CA 90745
|
936 sq. feet
|
1 baths 3 beds |
show details |
| Photo | Address | Area | Beds / Baths | Price | Details |
|---|---|---|---|---|---|

|
#41
E Turmont St
Carson, CA 90746
|
2,470 sq. feet
|
3 baths 4 beds |
show details | |

|
#42
E Moorehaven Dr
Carson, CA 90746
|
1,927 sq. feet
|
2 baths 5 beds |
show details | |

|
#43
Radlett Ave
Carson, CA 90746
|
1,822 sq. feet
|
3 baths 3 beds |
show details | |

|
#44
E 189th St
Carson, CA 90746
|
1,883 sq. feet
|
2 baths 3 beds |
show details | |

|
#45
E Victoria St Unit 112
Carson, CA 90746
|
1,313 sq. feet
|
3 baths 2 beds |
show details | |

|
#46
Pricetown Ave
Carson, CA 90746
|
2,183 sq. feet
|
3 baths 5 beds |
show details | |

|
#47
E Joel St
Carson, CA 90745
|
862 sq. feet
|
1 baths 2 beds |
show details | |

|
#48
E Gladwick St
Carson, CA 90746
|
1,488 sq. feet
|
2 baths 4 beds |
show details | |

|
#49
Neptune Ave
Carson, CA 90745
|
1,518 sq. feet
|
2 baths 4 beds |
show details | |

|
Check over 1 million property listings on Foreclosure.com!
|
browse all offers | |||

Latest news about housing in Carson, CA collected exclusively by city-data.com from local newspapers, TV, and radio stations


Median year apartment built: 1967
Household type by relationship:
Households: 92,391- Male householders: 13,881 (2,235 living alone), Female householders: 13,669 (2,759 living alone)
13,865 spouses (13,704 opposite-sex spouses), 1,562 unmarried partners, (1,562 opposite-sex unmarried partners), 30,976 children (29,529 natural, 296 adopted, 1,151 stepchildren), 4,616 grandchildren, 2,455 brothers or sisters, 3,442 parents, 244 foster children, 4,233 other relatives, 2,394 non-relatives
- In group quarters: 1,054
Size of family households: 5,710 2-persons, 4,174 3-persons, 5,832 4-persons, 3,043 5-persons, 1,772 6-persons, 1,069 7-or-more-persons.
Size of nonfamily households: 4,994 1-person, 872 2-persons, 84 3-persons.
10,505 married couples with children.
3,437 single-parent households (1,910 men, 1,527 women).
46.4% of residents of Carson speak English at home.
31.4% of residents speak Spanish at home (62% speak English very well, 20% speak English well, 13% speak English not well, 5% don't speak English at all).
1.1% of residents speak other Indo-European language at home (71% speak English very well, 24% speak English well, 5% speak English not well, 1% don't speak English at all).
19.3% of residents speak Asian or Pacific Island language at home (56% speak English very well, 33% speak English well, 10% speak English not well, 1% don't speak English at all).
2.1% of residents speak other language at home (75% speak English very well, 21% speak English well, 3% speak English not well, 1% don't speak English at all).
Foreign born population: 29,604 (32.0%)
(66.9% of them are naturalized citizens)
| Here: | 5.6 |
| State: | 6.0 |
| Here: | 4.3 |
| State: | 3.9 |
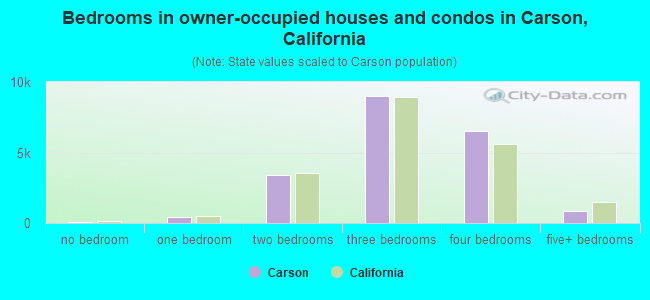
- Bedrooms in owner-occupied houses and condos in Carson, California
- 83no bedroom
- 4091 bedroom
- 3,3922 bedrooms
- 8,9923 bedrooms
- 6,5444 bedrooms
- 8515+ bedrooms
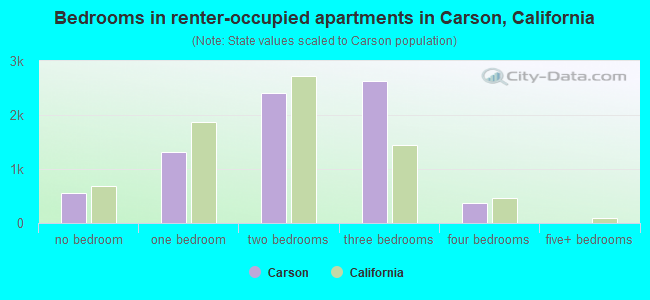
- Bedrooms in renter-occupied apartments in Carson, California
- 551no bedroom
- 1,3231 bedroom
- 2,4092 bedrooms
- 2,6233 bedrooms
- 3734 bedrooms
- 05+ bedrooms
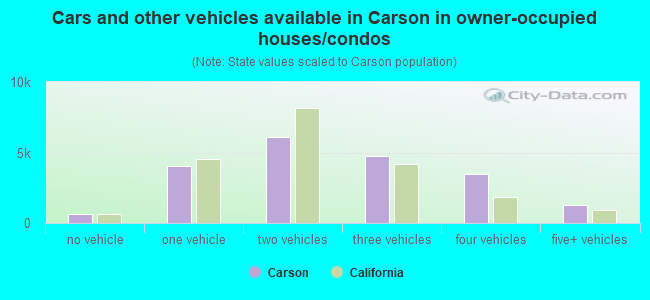
- Cars and other vehicles available in Carson in owner-occupied houses/condos
- 622no vehicle
- 4,0221 vehicle
- 6,0982 vehicles
- 4,7583 vehicles
- 3,4984 vehicles
- 1,2735+ vehicles
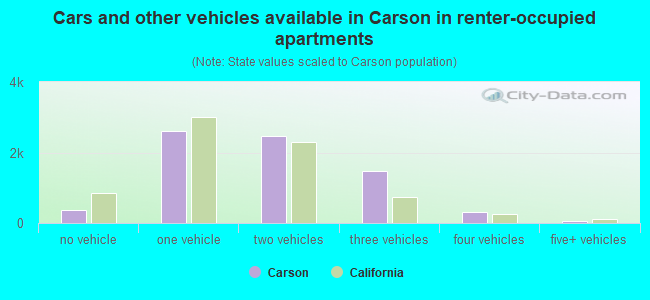
- Cars and other vehicles available in Carson in renter-occupied apartments
- 365no vehicle
- 2,6171 vehicle
- 2,4702 vehicles
- 1,4693 vehicles
- 3004 vehicles
- 585+ vehicles
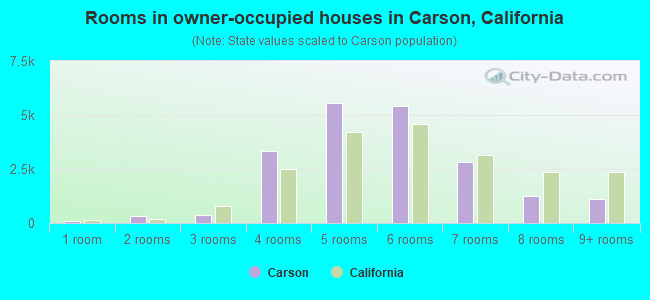
- Rooms in owner-occupied houses in Carson, California
- 831 room
- 3342 rooms
- 3863 rooms
- 3,3214 rooms
- 5,5395 rooms
- 5,3956 rooms
- 2,8327 rooms
- 1,2628 rooms
- 1,1199+ rooms
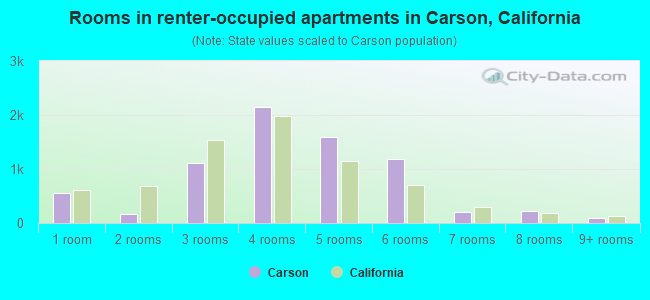
- Rooms in renter-occupied apartments in Carson, California
- 5511 room
- 1672 rooms
- 1,1043 rooms
- 2,1494 rooms
- 1,5915 rooms
- 1,1946 rooms
- 2037 rooms
- 2218 rooms
- 999+ rooms
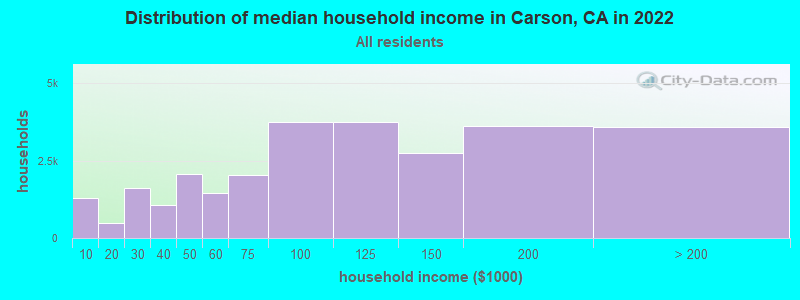
Carson, CA household income distribution

- 1,296Less than $10,000
- 496$10,000 to $19,999
- 1,634$20,000 to $29,999
- 1,084$30,000 to $39,999
- 2,086$40,000 to $49,999
- 1,465$50,000 to $59,999
- 2,037$60,000 to $74,999
- 3,743$75,000 to $99,999
- 3,754$100,000 to $124,999
- 2,744$125,000 to $149,999
- 3,620$150,000 to $199,999
- 3,591$200,000 or more
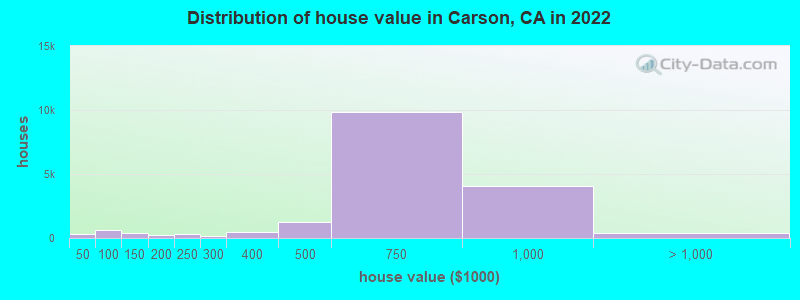
Home value of owner - occupied houses in 2022 in Carson, CA
-
- 242Less than $10,000
- 24$20,000 to $24,999
- 3$35,000 to $39,999
- 45$40,000 to $49,999
- 107$50,000 to $59,999
- 133$60,000 to $69,999
- 37$70,000 to $79,999
- 185$80,000 to $89,999
- 143$90,000 to $99,999
- 310$100,000 to $124,999
- 89$125,000 to $149,999
- 202$150,000 to $174,999
- 52$175,000 to $199,999
- 306$200,000 to $249,999
- 168$250,000 to $299,999
- 500$300,000 to $399,999
- 1,276$400,000 to $499,999
- 9,846$500,000 to $749,999
- 4,034$750,000 to $999,999
- 215$1,000,000 to $1,499,999
- 27$1,500,000 to $1,999,999
- 146$2,000,000 or more
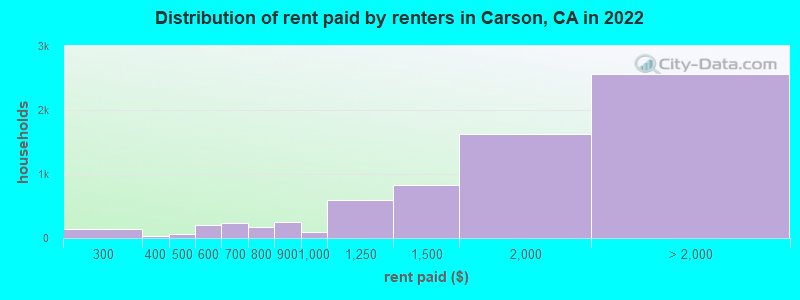
Rent paid by renters in 2022 in Carson, CA
-
- 0Less than $100
- 23$100 to $149
- 73$200 to $249
- 72$250 to $299
- 33$300 to $349
- 34$400 to $449
- 30$450 to $499
- 166$500 to $549
- 42$550 to $599
- 115$600 to $649
- 110$650 to $699
- 62$700 to $749
- 102$750 to $799
- 252$800 to $899
- 100$900 to $999
- 588$1,000 to $1,249
- 833$1,250 to $1,499
- 1,623$1,500 to $1,999
- 822$2,000 to $2,499
- 845$2,500 to $2,999
- 183$3,000 to $3,499
- 393$3,500 or more
- 315No cash rent
Percentage of workers working in this county: 93.0%
Number of people working at home: 3,303 (7.8% of all workers)
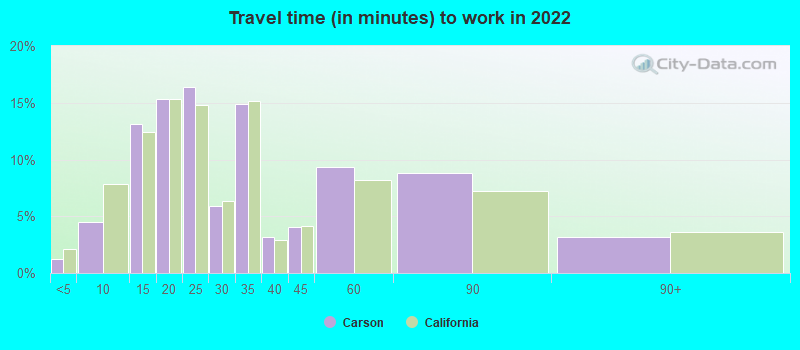
Travel time to work (commute)
- Less than 5 minutes: 335
- 5 to 9 minutes: 2,630
- 10 to 14 minutes: 5,159
- 15 to 19 minutes: 6,176
- 20 to 24 minutes: 6,297
- 25 to 29 minutes: 3,462
- 30 to 34 minutes: 5,110
- 35 to 39 minutes: 1,493
- 40 to 44 minutes: 359
- 45 to 59 minutes: 4,636
- 60 to 89 minutes: 2,447
- 90 or more minutes: 1,165
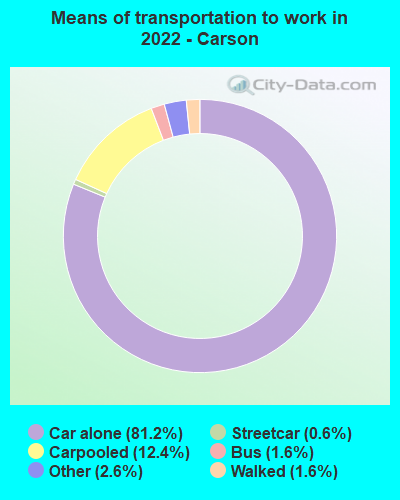
Means of transportation to work:
- Drove a car alone: 48,074 (76.9%)
- Carpooled: 7,315 (11.7%)
- Bus: 922 (1.5%)
- Subway or elevated rail: 347 (0.6%)
- Long-distance train or commuter rail: 55 (0.1%)
- Taxi: 1,535 (2.5%)
- Walked: 962 (1.5%)
- Worked at home: 3,303 (5.3%)
- Unemployment by race in 2022
- Unemployment rate for White non-Hispanic residents
- 6.3%Males
- 11.0%Females
- Unemployment rate for Black residents
- 7.8%Males
- 9.5%Females
- Unemployment rate for American Indian and Alaska Native residents
- 5.3%Females
- Unemployment rate for Asian residents
- 8.1%Males
- 1.7%Females
- Unemployment rate for other race residents
- 6.2%Males
- 13.5%Females
- Unemployment rate for two or more race residents
- 9.7%Males
- 6.6%Females
- Unemployment rate for Hispanic or Latino residents
- 6.6%Males
- 9.8%Females
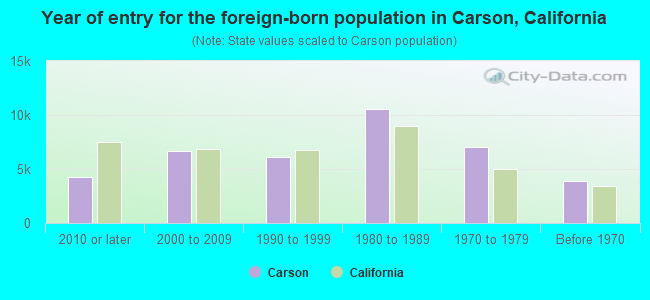
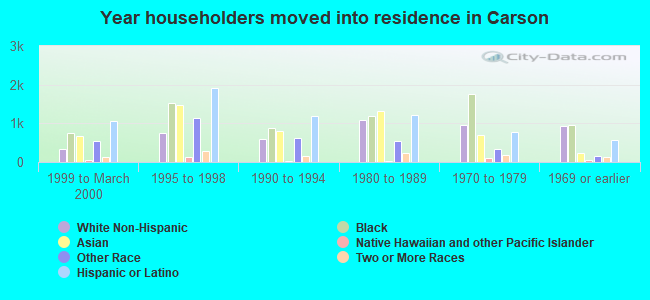
- Year of entry for the foreign-born population in Carson, California
- 4,2482010 or later
- 6,6662000 to 2009
- 6,0701990 to 1999
- 10,5201980 to 1989
- 7,0091970 to 1979
- 3,931Before 1970
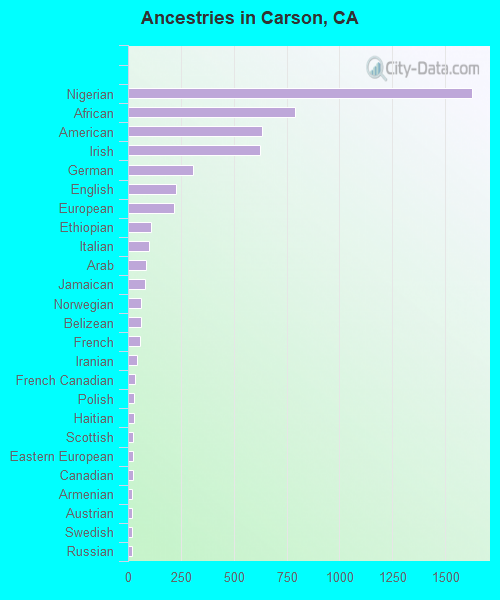
First ancestries reported:
- Nigerian: 1,626 (2.5%)
- African: 790 (1.2%)
- American: 635 (1.0%)
- Irish: 624 (1.0%)
- German: 307 (0.5%)
- English: 225 (0.4%)
- European: 218 (0.3%)
- Ethiopian: 107 (0.2%)
- Italian: 100 (0.2%)
- Arab: 87 (0.1%)
- Jamaican: 81 (0.1%)
- Norwegian: 62 (0.10%)
- Belizean: 62 (0.10%)
- French: 55 (0.09%)
- Iranian: 44 (0.07%)
- French Canadian: 32 (0.05%)
- Polish: 30 (0.05%)
- Haitian: 28 (0.04%)
- Scottish: 26 (0.04%)
- Eastern European: 25 (0.04%)
- Canadian: 23 (0.04%)
- Armenian: 20 (0.03%)
- Austrian: 20 (0.03%)
- Swedish: 20 (0.03%)
- Russian: 19 (0.03%)
- Hungarian: 14 (0.02%)
- Ghanaian: 12 (0.02%)
- Scandinavian: 10 (0.02%)
- Portuguese: 9 (0.01%)
- Somali: 9 (0.01%)
- Guyanese: 9 (0.01%)
- Lebanese: 8 (0.01%)
- Romanian: 7 (0.01%)
- Trinidadian and Tobagonian: 7 (0.01%)
- British: 6 (0.01%)
- Bulgarian: 6 (0.01%)
- Croatian: 6 (0.01%)
- Northern European: 6 (0.01%)
Most common places of birth for foreign-born residents (%):
| Carson: | 39.3% (12,511) |
| California: | 7.8% (818,297) |
| Carson: | 33.6% (10,710) |
| California: | 37.2% (3,881,193) |
| Carson: | 4.4% (1,408) |
| California: | 0.3% (35,557) |
| Carson: | 3.5% (1,110) |
| California: | 3.0% (315,248) |
| Carson: | 2.5% (805) |
| California: | 2.8% (290,436) |
| Carson: | 2.4% (760) |
| California: | 4.2% (440,287) |
Place of birth for U.S.-born residents:
- This state: 51,805
- Other state: 8,783
- Northeast: 803
- Midwest: 1,938
- South: 4,352
- West: 1,690
93.0% of Carson residents lived in the same house 1 years ago.
Out of people who lived in different houses, 42.8% lived in this county.
Out of people who lived in different counties, 67.8% lived in California.
| Carson: | 93.0% |
| State average: | 88.9% |
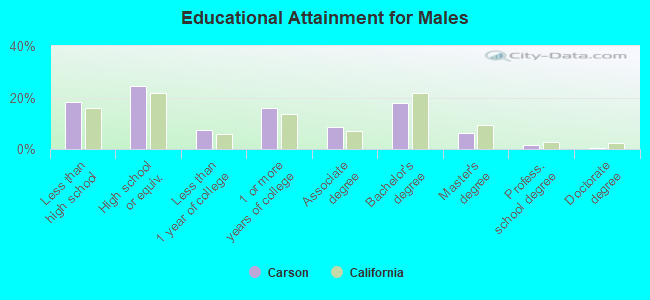
Education attainment for males 25 years and older:
- No schooling: 1,619
- Nursery to 4th grade: 253
- 5th and 6th grade: 384
- 7th and 8th grade: 120
- 9th grade: 1,178
- 10th grade: 112
- 11th grade: 444
- 12th grade, no diploma: 1,631
- High school graduate (or equivalency): 7,767
- Less than 1 year of college: 2,352
- Some college more than 1 year, no degree: 5,015
- Associate degree: 2,689
- Bachelor's degree: 5,626
- Master's degree: 1,916
- Professional school degree: 503
- Doctorate degree: 159
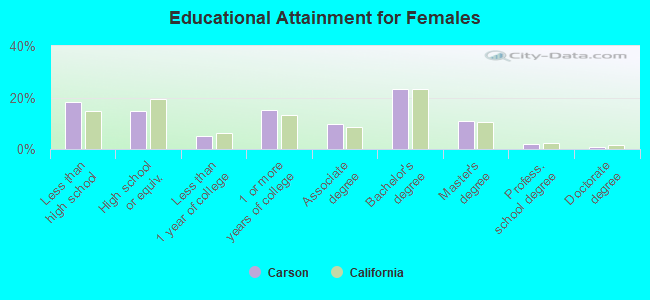
Education attainment for females 25 years and older:
- No schooling: 1,832
- Nursery to 4th grade: 529
- 5th and 6th grade: 701
- 7th and 8th grade: 336
- 9th grade: 614
- 10th grade: 541
- 11th grade: 312
- 12th grade, no diploma: 1,450
- High school graduate (or equivalency): 5,137
- Less than 1 year of college: 1,709
- Some college more than 1 year, no degree: 5,253
- Associate degree: 3,300
- Bachelor's degree: 8,050
- Master's degree: 3,752
- Professional school degree: 694
- Doctorate degree: 312
Housing units in structures:
- One, detached: 19,708
- One, attached: 2,704
- 3 or 4: 455
- 5 to 9: 247
- 10 to 19: 434
- 20 to 49: 313
- 50 or more: 1,964
- Mobile homes: 2,934
Median worth of mobile homes: $217,600
Housing units lacking complete kitchen facilities in 2022: 1.9%
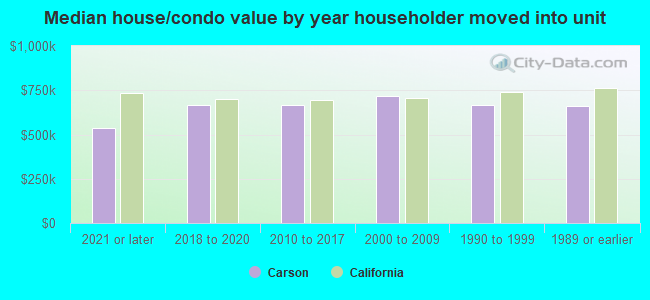
House/condo owner moved in on average 17 years ago
Renter moved in on average 5 years ago
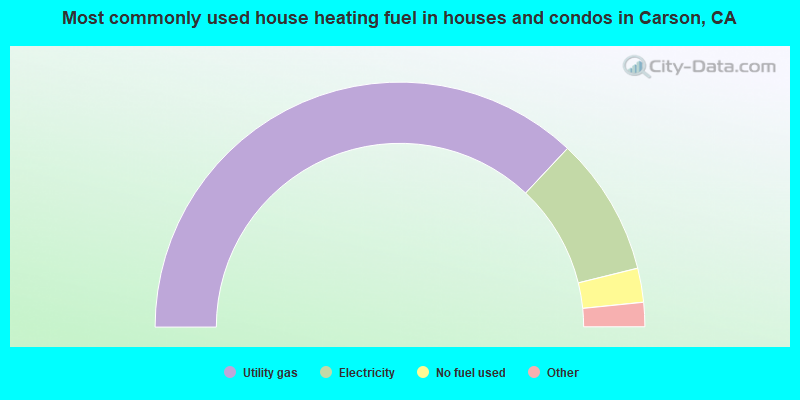
- 74.0%Utility gas
- 18.3%Electricity
- 4.5%No fuel used
- 1.5%Bottled, tank, or LP gas
- 1.4%Solar energy
- 0.2%Wood
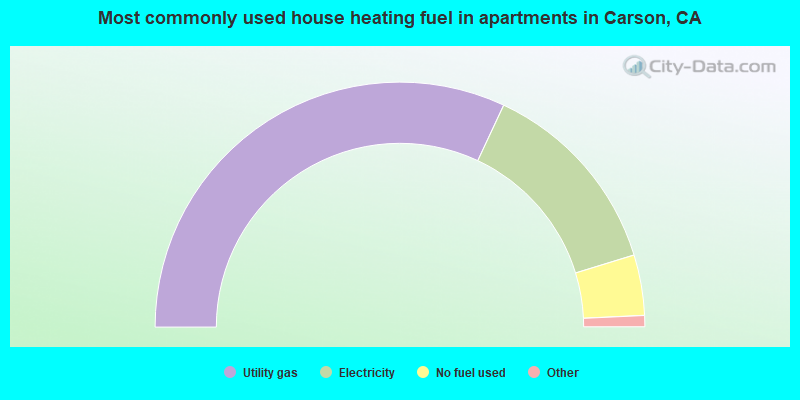
- 64.0%Utility gas
- 26.6%Electricity
- 8.0%No fuel used
- 0.9%Bottled, tank, or LP gas
- 0.3%Solar energy
- 0.2%Other fuel
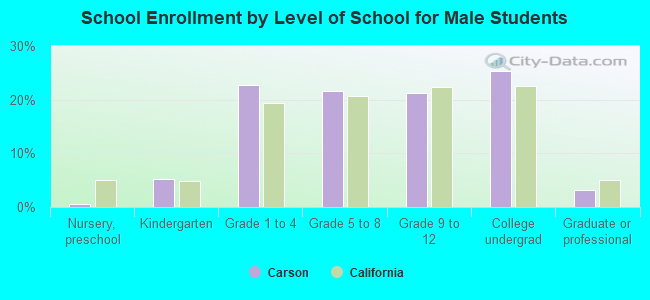
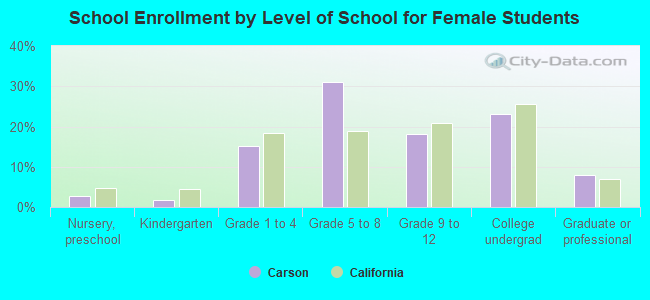
Private vs. public school enrollment:
| Here: | 13.7% |
| California: | 10.5% |
| Here: | 3.7% |
| California: | 8.5% |
| Here: | 15.8% |
| California: | 15.9% |