Castle Pines, CO (Colorado) Houses and Residents
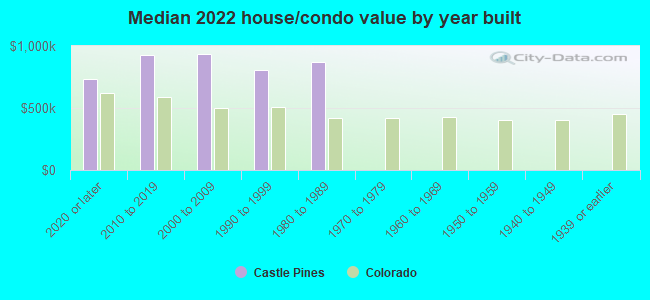
| Castle Pines: | $862,717 |
| Colorado: | $531,100 |
Total population: 10,796 (Urban population: 5,007 (all inside urban clusters), Rural population: 1,114 (all nonfarm))
Houses: 4,496 (4,392 occupied: 3,784 owner occupied, 625 renter occupied)
| % of renters here: | 14% |
| State: | 34% |
Housing density: 439 houses/condos per square mile
Median price asked for vacant for-sale houses and condos in 2022: $2,187,941.
Median contract rent in 2022: over $1,854
Median rent asked for vacant for-rent units in 2022: $393
Median gross rent in Castle Pines, CO in 2022: over $1,935
Housing units in Castle Pines with a mortgage: 2,833 (485 second mortgage, 27 home equity loan, 364 both second mortgage and home equity loan)
Houses without a mortgage: 87
Median household income for houses/condos with a mortgage: $218,414
Median household income for apartments without a mortgage: $195,084
Median monthly housing costs: $2,687
Compare current foreclosures near Castle Pines, CO:
| Photo | Address | Area | Beds / Baths | Price | Details |
|---|---|---|---|---|---|

|
#1
E Alameda Ave Apt 22-106
Denver, CO 80247
|
1,019 sq. feet
|
2 baths 2 beds |
show details | |

|
#2
S Fillmore Cir
Littleton, CO 80122
|
1,036 sq. feet
|
3 baths 3 beds |
show details | |

|
#3
E Mississippi Ave Apt C2
Denver, CO 80247
|
1,142 sq. feet
|
2 baths 2 beds |
show details | |

|
#4
Geneva Creek Lane
Littleton, CO 80125
|
- sq. feet
|
3 baths 3 beds |
show details | |

|
#5
E Maplewood Ave
Englewood, CO 80111
|
2,061 sq. feet
|
4 baths 3 beds |
show details | |

|
#6
Kyle Way
Littleton, CO 80125
|
1,630 sq. feet
|
2 baths 3 beds |
show details | |

|
#7
E Linvale Dr
Aurora, CO 80013
|
1,393 sq. feet
|
2 baths 3 beds |
show details | |

|
#8
S Olathe Ct
Aurora, CO 80013
|
1,620 sq. feet
|
3 baths 3 beds |
show details | |

|
#9
E Vassar Dr
Aurora, CO 80013
|
1,927 sq. feet
|
2 baths 3 beds |
show details | |

|
#10
S Danube Way Unit 103
Aurora, CO 80013
|
697 sq. feet
|
1 baths 1 beds |
show details |
| Photo | Address | Area | Beds / Baths | Price | Details |
|---|---|---|---|---|---|

|
#11
E Caspian Pl
Aurora, CO 80013
|
2,638 sq. feet
|
3 baths 4 beds |
show details | |

|
#12
E Asbury Ave
Aurora, CO 80013
|
1,646 sq. feet
|
3 baths 3 beds |
show details | |

|
#13
S Madison St
Denver, CO 80210
|
2,947 sq. feet
|
3 baths 4 beds |
show details | |

|
#14
Starling Ln
Elizabeth, CO 80107
|
1,496 sq. feet
|
1 baths 3 beds |
show details | |

|
#15
S Richfield Way
Aurora, CO 80013
|
1,054 sq. feet
|
1 baths 2 beds |
show details | |

|
#16
S Blackhawk Way
Aurora, CO 80014
|
3,021 sq. feet
|
2 baths 3 beds |
show details | |

|
#17
S Joplin Way
Aurora, CO 80013
|
1,132 sq. feet
|
2 baths 3 beds |
show details | |

|
#18
S Rifle Way
Aurora, CO 80013
|
2,047 sq. feet
|
3 baths 1 beds |
show details | |

|
#19
S Newland Cir
Littleton, CO 80123
|
1,898 sq. feet
|
2 baths 4 beds |
show details | |

|
#20
White Bay Dr
Littleton, CO 80126
|
3,315 sq. feet
|
4 baths 5 beds |
show details |
| Photo | Address | Area | Beds / Baths | Price | Details |
|---|---|---|---|---|---|

|
#21
S Flat Rock Ct
Aurora, CO 80016
|
2,822 sq. feet
|
2 baths 3 beds |
show details | |

|
#22
S Akron Way
Denver, CO 80247
|
2,663 sq. feet
|
2 baths 3 beds |
show details | |

|
#23
Horton Court
Parker, CO 80134
|
- sq. feet
|
2 baths 3 beds |
show details | |

|
#24
E Mississippi Ave Apt 1502
Denver, CO 80247
|
1,428 sq. feet
|
2 baths 2 beds |
show details | |

|
#25
Rose Heath Rd
Parker, CO 80134
|
- sq. feet
|
3 baths 3 beds |
show details | |

|
#26
S Pitkin Cir
Aurora, CO 80017
|
738 sq. feet
|
1 baths 1 beds |
show details | |

|
#27
Charissglen Ln
Littleton, CO 80126
|
4,450 sq. feet
|
3 baths 4 beds |
show details | |

|
#28
Lodgepole Trl
Littleton, CO 80124
|
3,064 sq. feet
|
3 baths 4 beds |
show details | |

|
#29
Spanish Oaks Way
Castle Rock, CO 80108
|
- sq. feet
|
3 baths 4 beds |
show details | |

|
#30
W Adriatic Pl
Englewood, CO 80110
|
1,104 sq. feet
|
1 baths 3 beds |
show details |
| Photo | Address | Area | Beds / Baths | Price | Details |
|---|---|---|---|---|---|

|
#31
S Jasper Way
Aurora, CO 80013
|
1,036 sq. feet
|
1 baths 2 beds |
show details | |

|
#32
S Vaughn Cir
Aurora, CO 80012
|
2,152 sq. feet
|
3 baths 4 beds |
show details | |

|
#33
Belmont Way
Parker, CO 80134
|
2,484 sq. feet
|
2 baths 3 beds |
show details | |

|
#34
E Davies Ave
Aurora, CO 80016
|
1,400 sq. feet
|
3 baths 3 beds |
show details | |

|
#35
S Galapago St
Englewood, CO 80110
|
1,040 sq. feet
|
2 baths 3 beds |
show details | |

|
#36
Banyon Cir
Parker, CO 80134
|
- sq. feet
|
2 baths 4 beds |
show details | |

|
#37
E Girard Ave Apt 102
Denver, CO 80231
|
1,050 sq. feet
|
2 baths 2 beds |
show details | |

|
#38
Bridle Path Ln
Parker, CO 80134
|
3,665 sq. feet
|
4 baths 5 beds |
show details | |

|
#39
E Evans Ave
Aurora, CO 80014
|
3,152 sq. feet
|
4 baths 4 beds |
show details | |

|
#40
S Elk Way
Aurora, CO 80016
|
1,984 sq. feet
|
2 baths 4 beds |
show details |
| Photo | Address | Area | Beds / Baths | Price | Details |
|---|---|---|---|---|---|

|
#41
S Pitkin Cir
Aurora, CO 80013
|
1,320 sq. feet
|
2 baths 3 beds |
show details | |

|
#42
Haystack Rd
Castle Rock, CO 80104
|
2,500 sq. feet
|
2 baths 3 beds |
show details | |

|
#43
Ponderosa Ave
Parker, CO 80134
|
1,224 sq. feet
|
2 baths 3 beds |
show details | |

|
#44
Dawkins Drive
Castle Rock, CO 80104
|
1,505 sq. feet
|
2 baths 2 beds |
show details | |

|
#45
E Columbia Dr
Aurora, CO 80014
|
1,008 sq. feet
|
2 baths 3 beds |
show details | |

|
#46
Country Club Dr
Larkspur, CO 80118
|
3,763 sq. feet
|
5 baths 4 beds |
show details | |

|
#47
S Jasper St
Aurora, CO 80013
|
1,032 sq. feet
|
2 baths 5 beds |
show details | |

|
#48
E Eastman Pl
Aurora, CO 80013
|
1,526 sq. feet
|
2 baths 3 beds |
show details | |

|
#49
Raleigh Cir
Castle Rock, CO 80104
|
2,036 sq. feet
|
3 baths 3 beds |
show details | |

|
Check over 1 million property listings on Foreclosure.com!
|
browse all offers | |||


 | Colorado metro districts and developers create billions in debt, leaving homeowners with soaring tax bills (39 replies) |
| Rental Townhouse in Castle Pines (4 replies) |
| Housing advice (38 replies) |
| Castle Pines Colorado or Highlands Ranch (8 replies) |
| Relocating to CO, office is in Centennial (72 replies) |
| Whats the scoop on living in Highlands Ranch? Pros and cons? (29 replies) |
Median year apartment built: 1997
Household type by relationship:
Households: 12,328- Male householders: 2,520 (163 living alone), Female householders: 1,815 (252 living alone)
3,264 spouses (3,215 opposite-sex spouses), 335 unmarried partners, (325 opposite-sex unmarried partners), 3,912 children (3,683 natural, 68 adopted, 159 stepchildren), 73 grandchildren, 50 brothers or sisters, 171 parents, 17 foster children, 49 other relatives, 98 non-relatives
- In group quarters: 21
Size of family households: 1,598 2-persons, 1,007 3-persons, 812 4-persons, 194 5-persons, 61 6-persons, 12 7-or-more-persons.
Size of nonfamily households: 429 1-person, 226 2-persons, 6 3-persons.
2,228 married couples with children.
265 single-parent households (70 men, 195 women).
89.4% of residents of Castle Pines speak English at home.
2.9% of residents speak Spanish at home (60% speak English very well, 29% speak English well, 11% speak English not well).
3.4% of residents speak other Indo-European language at home (98% speak English very well, 2% speak English well).
2.3% of residents speak Asian or Pacific Island language at home (85% speak English very well, 15% speak English well).
2.2% of residents speak other language at home (60% speak English very well, 40% speak English well).
Foreign born population: 1,492 (12.1%)
(45.2% of them are naturalized citizens)
| Here: | 10.0 |
| State: | 6.8 |
| Here: | 4.4 |
| State: | 4.0 |
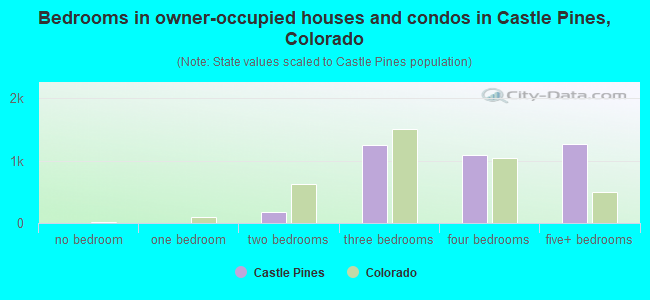
- Bedrooms in owner-occupied houses and condos in Castle Pines, Colorado
- 0no bedroom
- 01 bedroom
- 1842 bedrooms
- 1,2493 bedrooms
- 1,0884 bedrooms
- 1,2635+ bedrooms
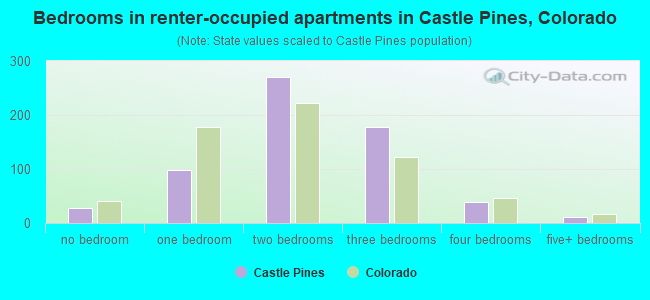
- Bedrooms in renter-occupied apartments in Castle Pines, Colorado
- 27no bedroom
- 991 bedroom
- 2712 bedrooms
- 1783 bedrooms
- 394 bedrooms
- 125+ bedrooms
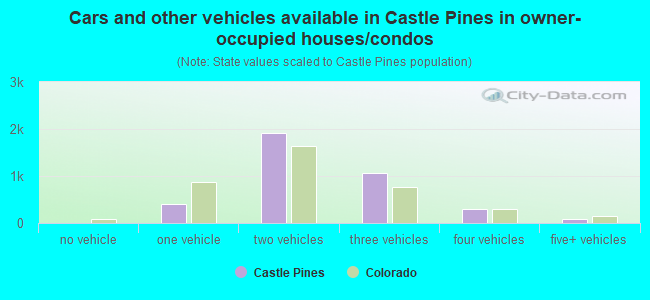
- Cars and other vehicles available in Castle Pines in owner-occupied houses/condos
- 8no vehicle
- 3991 vehicle
- 1,9082 vehicles
- 1,0743 vehicles
- 3064 vehicles
- 895+ vehicles
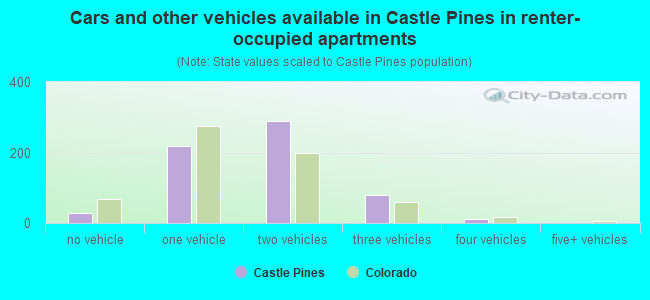
- Cars and other vehicles available in Castle Pines in renter-occupied apartments
- 28no vehicle
- 2191 vehicle
- 2892 vehicles
- 803 vehicles
- 114 vehicles
- 05+ vehicles
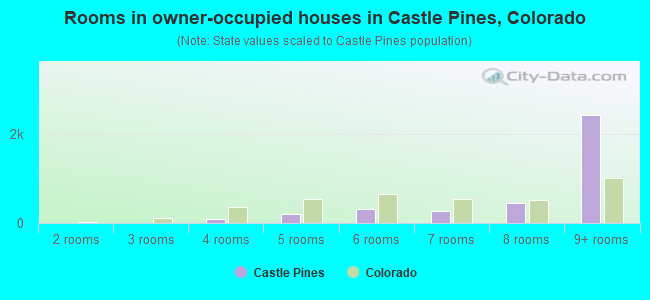
- Rooms in owner-occupied houses in Castle Pines, Colorado
- 01 room
- 02 rooms
- 03 rooms
- 1014 rooms
- 2105 rooms
- 3246 rooms
- 2747 rooms
- 4418 rooms
- 2,4359+ rooms
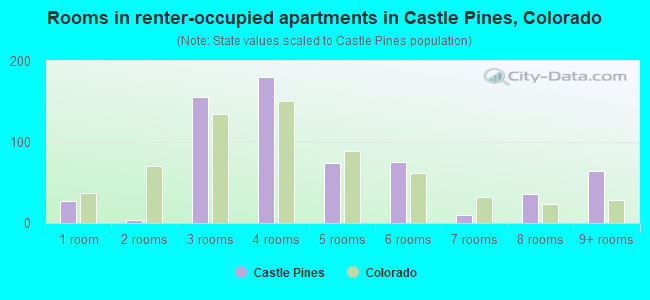
- Rooms in renter-occupied apartments in Castle Pines, Colorado
- 271 room
- 42 rooms
- 1553 rooms
- 1804 rooms
- 745 rooms
- 756 rooms
- 107 rooms
- 368 rooms
- 649+ rooms
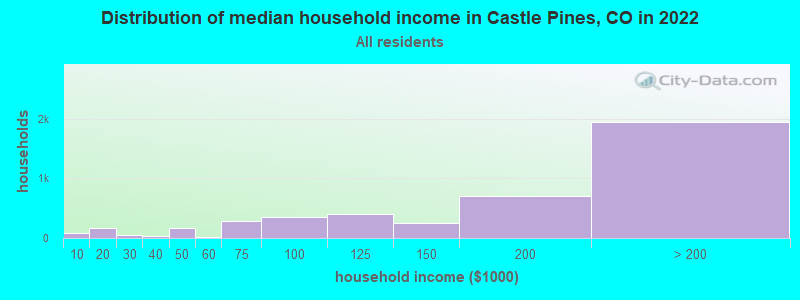
Castle Pines, CO household income distribution

- 82Less than $10,000
- 176$10,000 to $19,999
- 50$20,000 to $29,999
- 34$30,000 to $39,999
- 170$40,000 to $49,999
- 23$50,000 to $59,999
- 279$60,000 to $74,999
- 359$75,000 to $99,999
- 399$100,000 to $124,999
- 245$125,000 to $149,999
- 709$150,000 to $199,999
- 1,947$200,000 or more
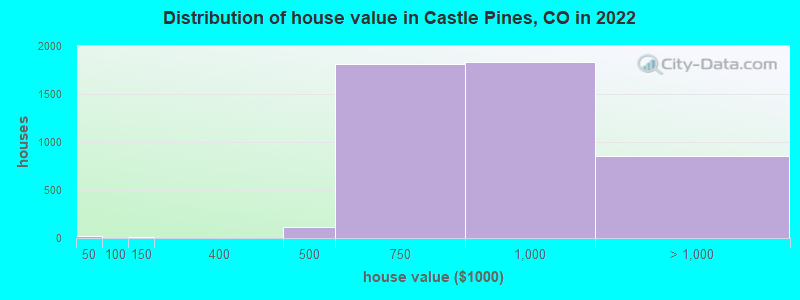
Home value of owner - occupied houses in 2022 in Castle Pines, CO
-
- 22$25,000 to $29,999
- 8$100,000 to $124,999
- 115$400,000 to $499,999
- 1,815$500,000 to $749,999
- 1,832$750,000 to $999,999
- 720$1,000,000 to $1,499,999
- 99$1,500,000 to $1,999,999
- 36$2,000,000 or more
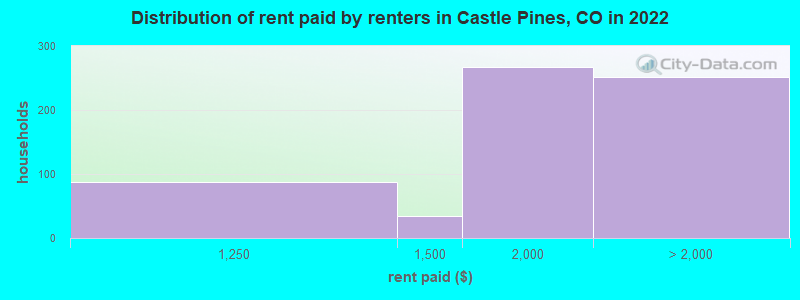
Rent paid by renters in 2022 in Castle Pines, CO
-
- 87$1,000 to $1,249
- 35$1,250 to $1,499
- 267$1,500 to $1,999
- 121$2,000 to $2,499
- 44$2,500 to $2,999
- 57$3,000 to $3,499
- 5$3,500 or more
- 22No cash rent
Percentage of workers working in this county: 65.3%
Number of people working at home: 2,316 (34.4% of all workers)
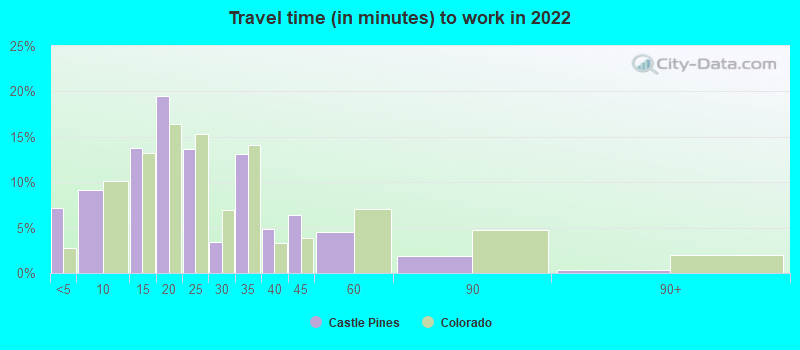
Travel time to work (commute)
- Less than 5 minutes: 143
- 5 to 9 minutes: 346
- 10 to 14 minutes: 376
- 15 to 19 minutes: 926
- 20 to 24 minutes: 649
- 25 to 29 minutes: 277
- 30 to 34 minutes: 466
- 35 to 39 minutes: 140
- 40 to 44 minutes: 432
- 45 to 59 minutes: 452
- 60 to 89 minutes: 127
- 90 or more minutes: 57
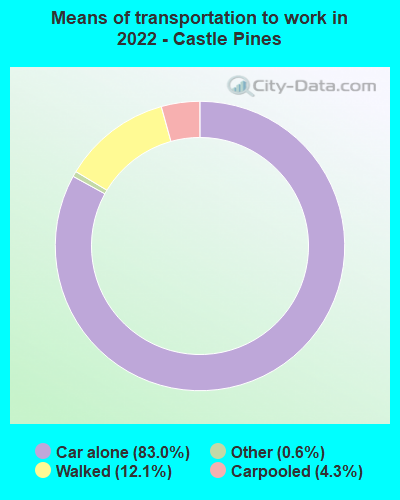
Means of transportation to work:
- Drove a car alone: 1,894 (42.6%)
- Carpooled: 111 (2.5%)
- Taxi: 13 (0.3%)
- Walked: 257 (5.8%)
- Worked at home: 2,316 (52.0%)

- Unemployment by race in 2022
- Unemployment rate for White non-Hispanic residents
- 2.0%Males
- 3.9%Females
- Unemployment rate for other race residents
- 37.1%Males
- Unemployment rate for Hispanic or Latino residents
- 26.6%Males
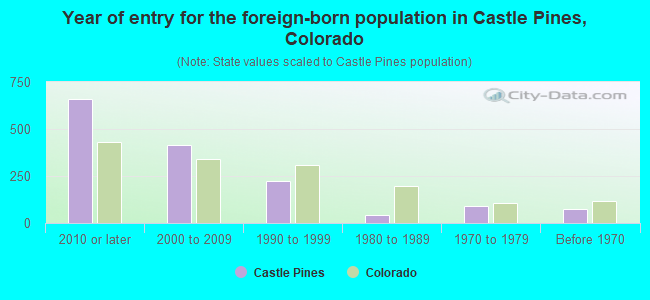
- Year of entry for the foreign-born population in Castle Pines, Colorado
- 6612010 or later
- 4132000 to 2009
- 2251990 to 1999
- 401980 to 1989
- 881970 to 1979
- 76Before 1970
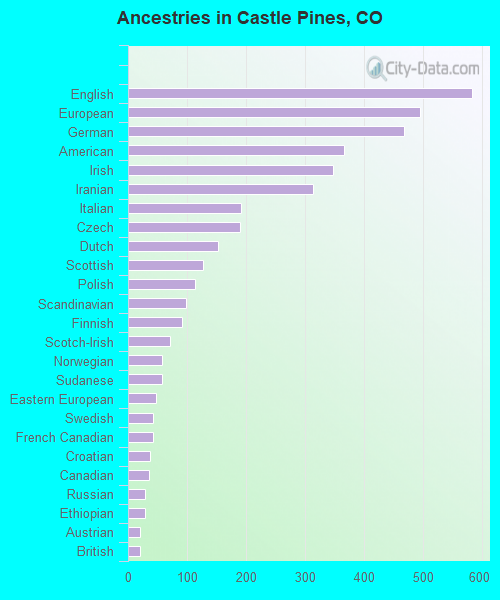
First ancestries reported:
- English: 582 (10.2%)
- European: 494 (8.7%)
- German: 467 (8.2%)
- American: 365 (6.4%)
- Irish: 347 (6.1%)
- Iranian: 313 (5.5%)
- Italian: 191 (3.4%)
- Czech: 190 (3.3%)
- Dutch: 153 (2.7%)
- Scottish: 127 (2.2%)
- Polish: 113 (2.0%)
- Scandinavian: 98 (1.7%)
- Finnish: 91 (1.6%)
- Scotch-Irish: 71 (1.2%)
- Norwegian: 58 (1.0%)
- Sudanese: 58 (1.0%)
- Eastern European: 47 (0.8%)
- Swedish: 43 (0.8%)
- French Canadian: 42 (0.7%)
- Croatian: 38 (0.7%)
- Canadian: 35 (0.6%)
- Russian: 28 (0.5%)
- Ethiopian: 28 (0.5%)
- Austrian: 21 (0.4%)
- British: 21 (0.4%)
- Czechoslovakian: 14 (0.2%)
- Brazilian: 11 (0.2%)
- Luxembourger: 11 (0.2%)
- Portuguese: 10 (0.2%)
- French: 8 (0.1%)
- Lithuanian: 7 (0.1%)
- Northern European: 7 (0.1%)
- Yugoslavian: 6 (0.1%)
- Hungarian: 2 (0.04%)
Most common places of birth for foreign-born residents (%):
| Castle Pines: | 18.8% (261) |
| Colorado: | 2.3% (12,342) |
| Castle Pines: | 15.5% (214) |
| Colorado: | 0.9% (4,829) |
| Castle Pines: | 15.4% (213) |
| Colorado: | 0.4% (2,099) |
| Castle Pines: | 14.9% (206) |
| Colorado: | 0.7% (3,568) |
| Castle Pines: | 7.4% (103) |
| Colorado: | 4.0% (21,689) |
| Castle Pines: | 4.8% (66) |
| Colorado: | 0.3% (1,788) |
| Castle Pines: | 3.6% (50) |
| Colorado: | 38.3% (209,491) |
| Castle Pines: | 3.3% (46) |
| Colorado: | 2.7% (15,026) |
| Castle Pines: | 2.8% (39) |
| Colorado: | 0.0% (213) |
| Castle Pines: | 2.6% (36) |
| Colorado: | 1.2% (6,672) |
| Castle Pines: | 2.3% (32) |
| Colorado: | 1.4% (7,860) |
| Castle Pines: | 2.2% (31) |
| Colorado: | 1.9% (10,372) |
| Castle Pines: | 1.6% (22) |
| Colorado: | 0.9% (4,772) |
Place of birth for U.S.-born residents:
- This state: 4,099
- Other state: 6,604
- Northeast: 646
- Midwest: 2,535
- South: 1,604
- West: 1,815
88.0% of Castle Pines residents lived in the same house 1 years ago.
Out of people who lived in different houses, 41.2% lived in this county.
Out of people who lived in different counties, 60.8% lived in Colorado.
| Castle Pines: | 88.0% |
| State average: | 83.6% |
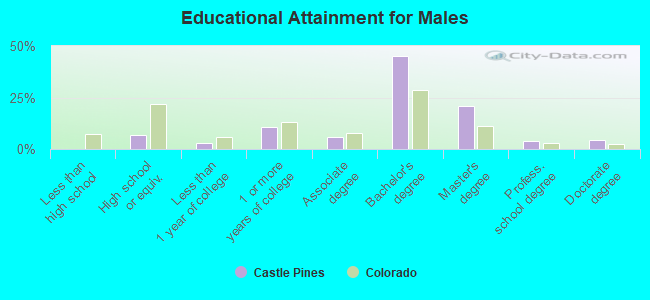
Education attainment for males 25 years and older:
- No schooling: 0
- Nursery to 4th grade: 0
- 5th and 6th grade: 0
- 7th and 8th grade: 6
- 9th grade: 0
- 10th grade: 1
- 11th grade: 0
- 12th grade, no diploma: 0
- High school graduate (or equivalency): 289
- Less than 1 year of college: 122
- Some college more than 1 year, no degree: 473
- Associate degree: 243
- Bachelor's degree: 1,958
- Master's degree: 898
- Professional school degree: 160
- Doctorate degree: 183
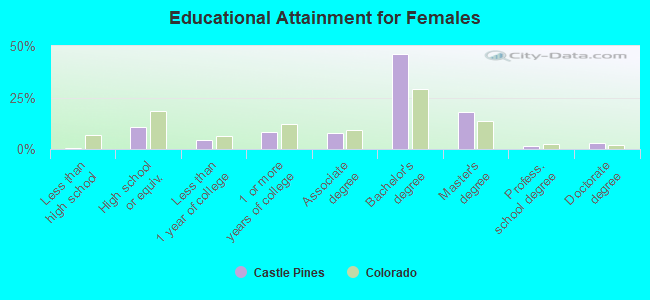
Education attainment for females 25 years and older:
- No schooling: 0
- Nursery to 4th grade: 0
- 5th and 6th grade: 0
- 7th and 8th grade: 0
- 9th grade: 0
- 10th grade: 20
- 11th grade: 0
- 12th grade, no diploma: 8
- High school graduate (or equivalency): 476
- Less than 1 year of college: 193
- Some college more than 1 year, no degree: 368
- Associate degree: 348
- Bachelor's degree: 2,047
- Master's degree: 790
- Professional school degree: 59
- Doctorate degree: 135

Housing units in structures:
- One, detached: 3,811
- One, attached: 219
- Two: 35
- 3 or 4: 70
- 5 to 9: 163
- 10 to 19: 190
- 50 or more: 4
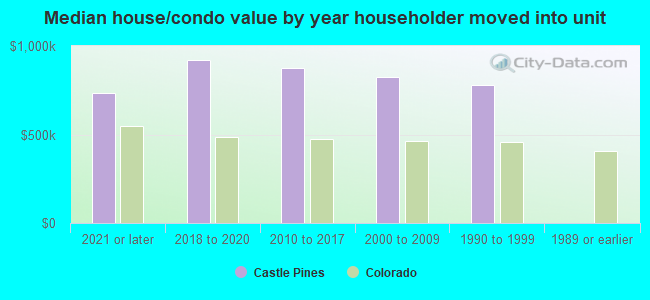
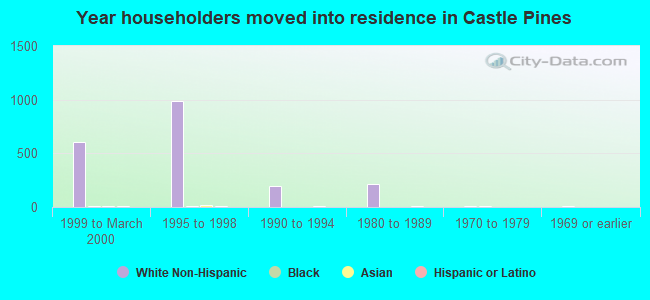
House/condo owner moved in on average 7 years ago
Renter moved in on average 2 years ago
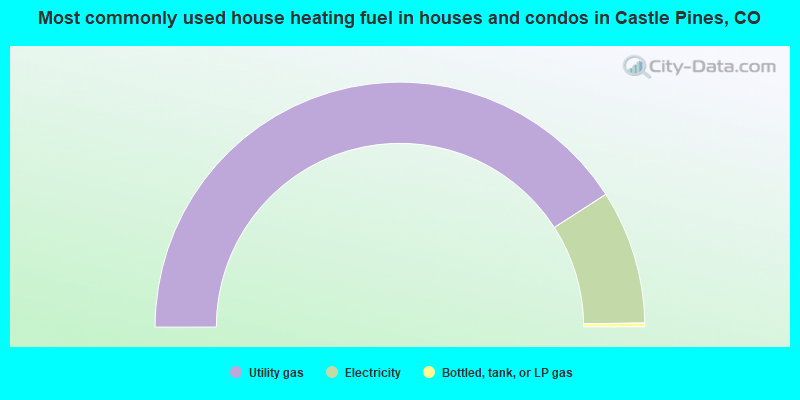
- 81.8%Utility gas
- 17.7%Electricity
- 0.5%Bottled, tank, or LP gas
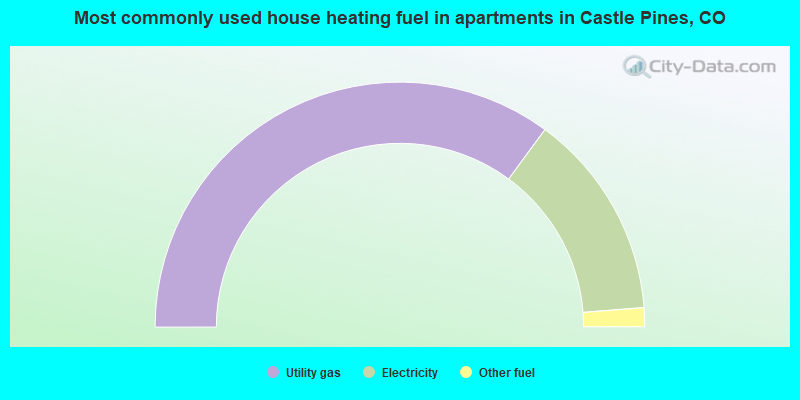
- 70.1%Utility gas
- 27.3%Electricity
- 2.5%Other fuel
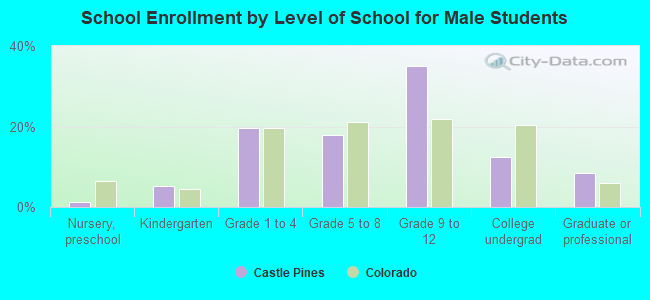
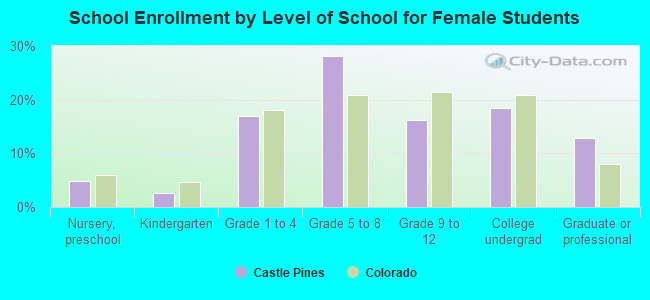
Private vs. public school enrollment:
| Here: | 14.7% |
| Colorado: | 11.4% |
| Here: | 17.4% |
| Colorado: | 8.5% |
| Here: | 3.8% |
| Colorado: | 14.0% |