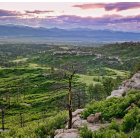
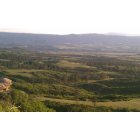
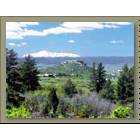
Castle Pines, Colorado Submit your own pictures of this place and show them to the world
OSM Map
General Map
Google Map
MSN Map
OSM Map
General Map
Google Map
MSN Map
OSM Map
General Map
Google Map
MSN Map
OSM Map
General Map
Google Map
MSN Map
Please wait while loading the map...
Population in 2022: 13,486 (100% urban, 0% rural). Population change since 2000: +126.4%Males: 6,811 Females: 6,675
March 2022 cost of living index in Castle Pines: 107.6 (more than average, U.S. average is 100) Percentage of residents living in poverty in 2022: 4.5%for White Non-Hispanic residents , 46.8% for Black residents , 1.1% for Hispanic or Latino residents , 1.3% for two or more races residents )Business Search - 14 Million verified businesses
Data:
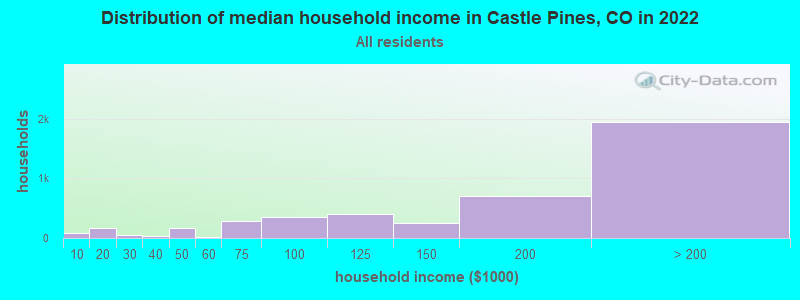
Median household income ($)
Median household income (% change since 2000)
Household income diversity
Ratio of average income to average house value (%)
Ratio of average income to average rent
Median household income ($) - White
Median household income ($) - Black or African American
Median household income ($) - Asian
Median household income ($) - Hispanic or Latino
Median household income ($) - American Indian and Alaska Native
Median household income ($) - Multirace
Median household income ($) - Other Race
Median household income for houses/condos with a mortgage ($)
Median household income for apartments without a mortgage ($)
Races - White alone (%)
Races - White alone (% change since 2000)
Races - Black alone (%)
Races - Black alone (% change since 2000)
Races - American Indian alone (%)
Races - American Indian alone (% change since 2000)
Races - Asian alone (%)
Races - Asian alone (% change since 2000)
Races - Hispanic (%)
Races - Hispanic (% change since 2000)
Races - Native Hawaiian and Other Pacific Islander alone (%)
Races - Native Hawaiian and Other Pacific Islander alone (% change since 2000)
Races - Two or more races (%)
Races - Two or more races (% change since 2000)
Races - Other race alone (%)
Races - Other race alone (% change since 2000)
Racial diversity
Unemployment (%)
Unemployment (% change since 2000)
Unemployment (%) - White
Unemployment (%) - Black or African American
Unemployment (%) - Asian
Unemployment (%) - Hispanic or Latino
Unemployment (%) - American Indian and Alaska Native
Unemployment (%) - Multirace
Unemployment (%) - Other Race
Population density (people per square mile)
Population - Males (%)
Population - Females (%)
Population - Males (%) - White
Population - Males (%) - Black or African American
Population - Males (%) - Asian
Population - Males (%) - Hispanic or Latino
Population - Males (%) - American Indian and Alaska Native
Population - Males (%) - Multirace
Population - Males (%) - Other Race
Population - Females (%) - White
Population - Females (%) - Black or African American
Population - Females (%) - Asian
Population - Females (%) - Hispanic or Latino
Population - Females (%) - American Indian and Alaska Native
Population - Females (%) - Multirace
Population - Females (%) - Other Race
Coronavirus confirmed cases (Apr 28, 2024)
Deaths caused by coronavirus (Apr 28, 2024)
Coronavirus confirmed cases (per 100k population) (Apr 28, 2024)
Deaths caused by coronavirus (per 100k population) (Apr 28, 2024)
Daily increase in number of cases (Apr 28, 2024)
Weekly increase in number of cases (Apr 28, 2024)
Cases doubled (in days) (Apr 28, 2024)
Hospitalized patients (Apr 18, 2022)
Negative test results (Apr 18, 2022)
Total test results (Apr 18, 2022)
COVID Vaccine doses distributed (per 100k population) (Sep 19, 2023)
COVID Vaccine doses administered (per 100k population) (Sep 19, 2023)
COVID Vaccine doses distributed (Sep 19, 2023)
COVID Vaccine doses administered (Sep 19, 2023)
Likely homosexual households (%)
Likely homosexual households (% change since 2000)
Likely homosexual households - Lesbian couples (%)
Likely homosexual households - Lesbian couples (% change since 2000)
Likely homosexual households - Gay men (%)
Likely homosexual households - Gay men (% change since 2000)
Cost of living index
Median gross rent ($)
Median contract rent ($)
Median monthly housing costs ($)
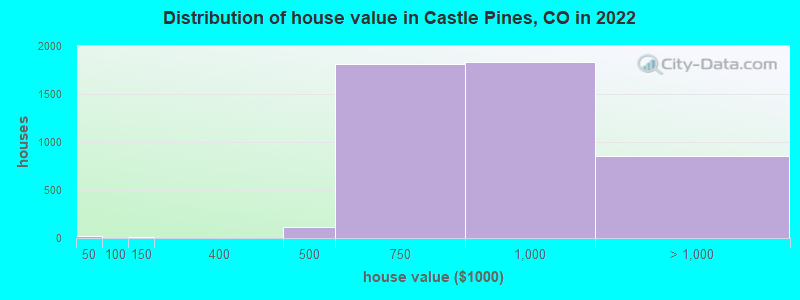
Median house or condo value ($)
Median house or condo value ($ change since 2000)
Mean house or condo value by units in structure - 1, detached ($)
Mean house or condo value by units in structure - 1, attached ($)
Mean house or condo value by units in structure - 2 ($)
Mean house or condo value by units in structure by units in structure - 3 or 4 ($)
Mean house or condo value by units in structure - 5 or more ($)
Mean house or condo value by units in structure - Boat, RV, van, etc. ($)
Mean house or condo value by units in structure - Mobile home ($)
Median house or condo value ($) - White
Median house or condo value ($) - Black or African American
Median house or condo value ($) - Asian
Median house or condo value ($) - Hispanic or Latino
Median house or condo value ($) - American Indian and Alaska Native
Median house or condo value ($) - Multirace
Median house or condo value ($) - Other Race
Median resident age
Resident age diversity
Median resident age - Males
Median resident age - Females
Median resident age - White
Median resident age - Black or African American
Median resident age - Asian
Median resident age - Hispanic or Latino
Median resident age - American Indian and Alaska Native
Median resident age - Multirace
Median resident age - Other Race
Median resident age - Males - White
Median resident age - Males - Black or African American
Median resident age - Males - Asian
Median resident age - Males - Hispanic or Latino
Median resident age - Males - American Indian and Alaska Native
Median resident age - Males - Multirace
Median resident age - Males - Other Race
Median resident age - Females - White
Median resident age - Females - Black or African American
Median resident age - Females - Asian
Median resident age - Females - Hispanic or Latino
Median resident age - Females - American Indian and Alaska Native
Median resident age - Females - Multirace
Median resident age - Females - Other Race
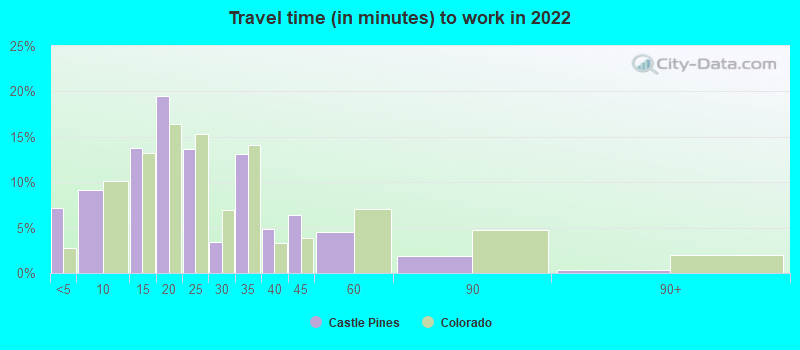
Commute - mean travel time to work (minutes)
Travel time to work - Less than 5 minutes (%)
Travel time to work - Less than 5 minutes (% change since 2000)
Travel time to work - 5 to 9 minutes (%)
Travel time to work - 5 to 9 minutes (% change since 2000)
Travel time to work - 10 to 19 minutes (%)
Travel time to work - 10 to 19 minutes (% change since 2000)
Travel time to work - 20 to 29 minutes (%)
Travel time to work - 20 to 29 minutes (% change since 2000)
Travel time to work - 30 to 39 minutes (%)
Travel time to work - 30 to 39 minutes (% change since 2000)
Travel time to work - 40 to 59 minutes (%)
Travel time to work - 40 to 59 minutes (% change since 2000)
Travel time to work - 60 to 89 minutes (%)
Travel time to work - 60 to 89 minutes (% change since 2000)
Travel time to work - 90 or more minutes (%)
Travel time to work - 90 or more minutes (% change since 2000)
Marital status - Never married (%)
Marital status - Now married (%)
Marital status - Separated (%)
Marital status - Widowed (%)
Marital status - Divorced (%)
Median family income ($)
Median family income (% change since 2000)
Median non-family income ($)
Median non-family income (% change since 2000)
Median per capita income ($)
Median per capita income (% change since 2000)
Median family income ($) - White
Median family income ($) - Black or African American
Median family income ($) - Asian
Median family income ($) - Hispanic or Latino
Median family income ($) - American Indian and Alaska Native
Median family income ($) - Multirace
Median family income ($) - Other Race
Median year house/condo built
Median year apartment built
Year house built - Built 2005 or later (%)
Year house built - Built 2000 to 2004 (%)
Year house built - Built 1990 to 1999 (%)
Year house built - Built 1980 to 1989 (%)
Year house built - Built 1970 to 1979 (%)
Year house built - Built 1960 to 1969 (%)
Year house built - Built 1950 to 1959 (%)
Year house built - Built 1940 to 1949 (%)
Year house built - Built 1939 or earlier (%)
Average household size
Household density (households per square mile)
Average household size - White
Average household size - Black or African American
Average household size - Asian
Average household size - Hispanic or Latino
Average household size - American Indian and Alaska Native
Average household size - Multirace
Average household size - Other Race
Occupied housing units (%)
Vacant housing units (%)
Owner occupied housing units (%)
Renter occupied housing units (%)
Vacancy status - For rent (%)
Vacancy status - For sale only (%)
Vacancy status - Rented or sold, not occupied (%)
Vacancy status - For seasonal, recreational, or occasional use (%)
Vacancy status - For migrant workers (%)
Vacancy status - Other vacant (%)
Residents with income below the poverty level (%)
Residents with income below 50% of the poverty level (%)
Children below poverty level (%)
Poor families by family type - Married-couple family (%)
Poor families by family type - Male, no wife present (%)
Poor families by family type - Female, no husband present (%)
Poverty status for native-born residents (%)
Poverty status for foreign-born residents (%)
Poverty among high school graduates not in families (%)
Poverty among people who did not graduate high school not in families (%)
Residents with income below the poverty level (%) - White
Residents with income below the poverty level (%) - Black or African American
Residents with income below the poverty level (%) - Asian
Residents with income below the poverty level (%) - Hispanic or Latino
Residents with income below the poverty level (%) - American Indian and Alaska Native
Residents with income below the poverty level (%) - Multirace
Residents with income below the poverty level (%) - Other Race
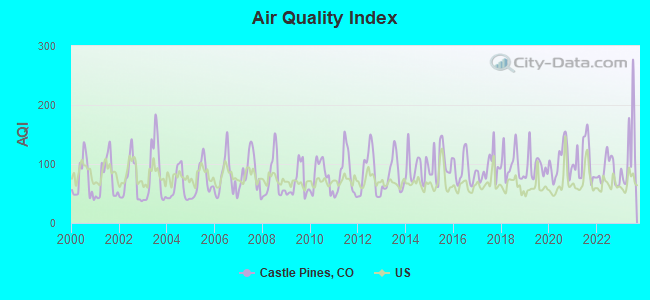
Air pollution - Air Quality Index (AQI)
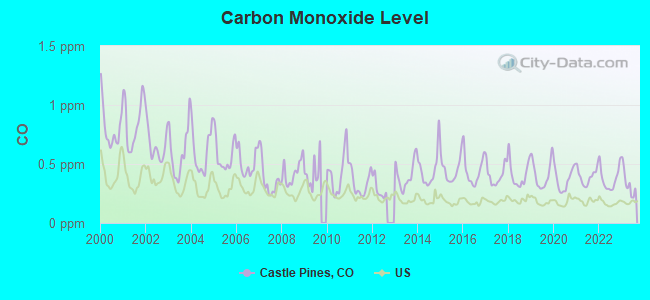
Air pollution - CO
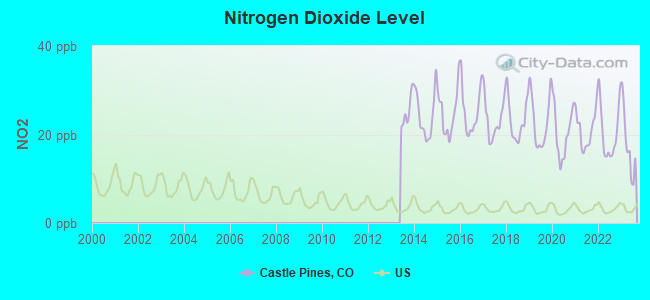
Air pollution - NO2
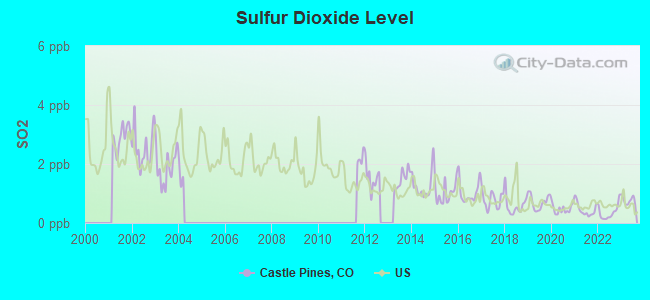
Air pollution - SO2
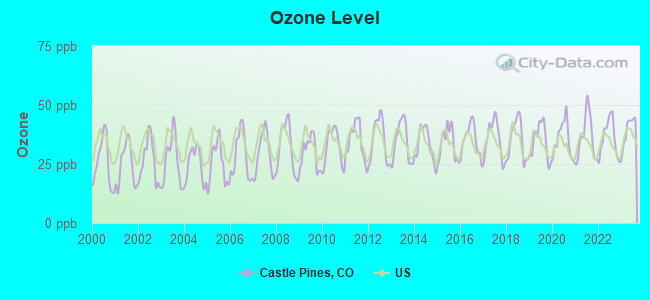
Air pollution - Ozone
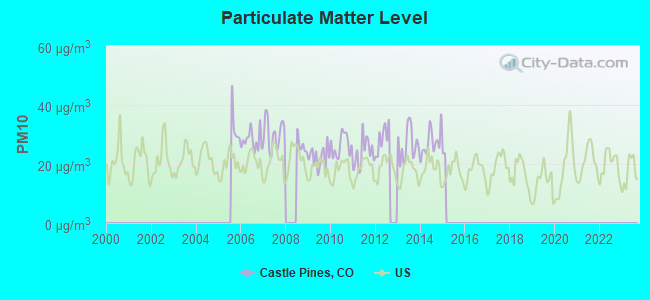
Air pollution - PM10
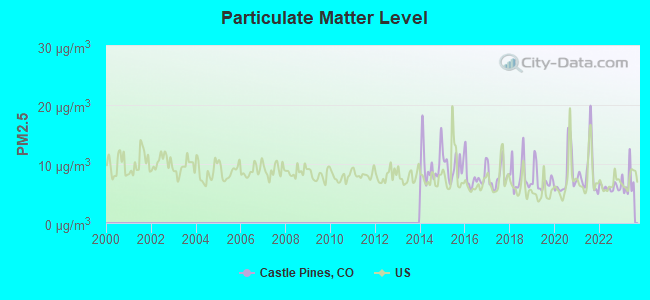
Air pollution - PM25
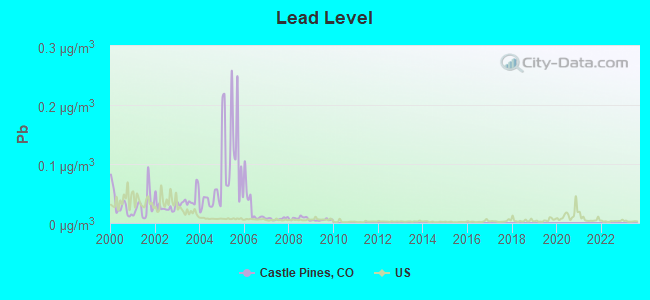
Air pollution - Pb
Crime - Murders per 100,000 population
Crime - Rapes per 100,000 population
Crime - Robberies per 100,000 population
Crime - Assaults per 100,000 population
Crime - Burglaries per 100,000 population
Crime - Thefts per 100,000 population
Crime - Auto thefts per 100,000 population
Crime - Arson per 100,000 population
Crime - City-data.com crime index
Crime - Violent crime index
Crime - Property crime index
Crime - Murders per 100,000 population (5 year average)
Crime - Rapes per 100,000 population (5 year average)
Crime - Robberies per 100,000 population (5 year average)
Crime - Assaults per 100,000 population (5 year average)
Crime - Burglaries per 100,000 population (5 year average)
Crime - Thefts per 100,000 population (5 year average)
Crime - Auto thefts per 100,000 population (5 year average)
Crime - Arson per 100,000 population (5 year average)
Crime - City-data.com crime index (5 year average)
Crime - Violent crime index (5 year average)
Crime - Property crime index (5 year average)
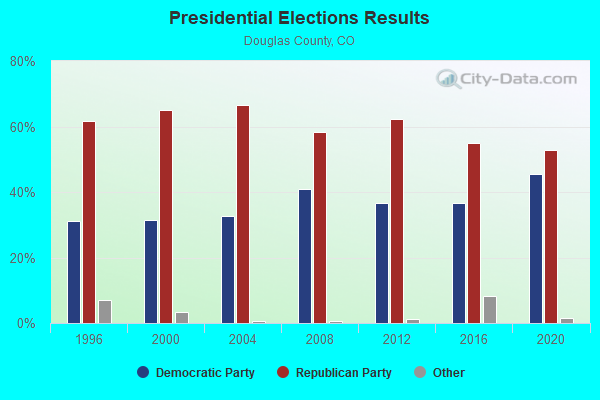
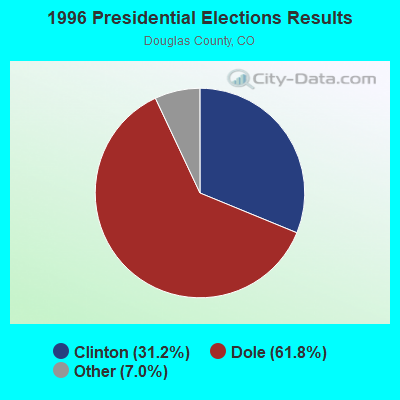
1996 Presidential Elections Results (%) - Democratic Party (Clinton)
1996 Presidential Elections Results (%) - Republican Party (Dole)
1996 Presidential Elections Results (%) - Other
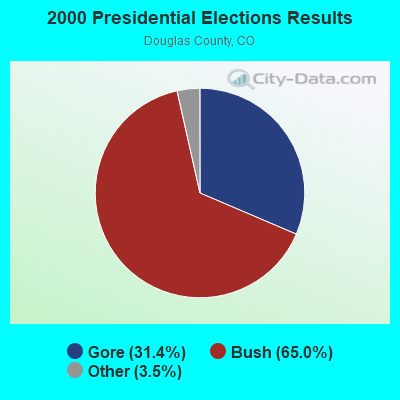
2000 Presidential Elections Results (%) - Democratic Party (Gore)
2000 Presidential Elections Results (%) - Republican Party (Bush)
2000 Presidential Elections Results (%) - Other
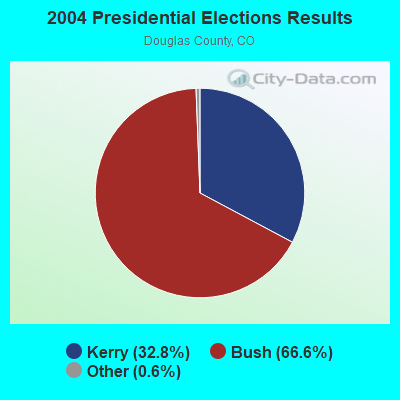
2004 Presidential Elections Results (%) - Democratic Party (Kerry)
2004 Presidential Elections Results (%) - Republican Party (Bush)
2004 Presidential Elections Results (%) - Other
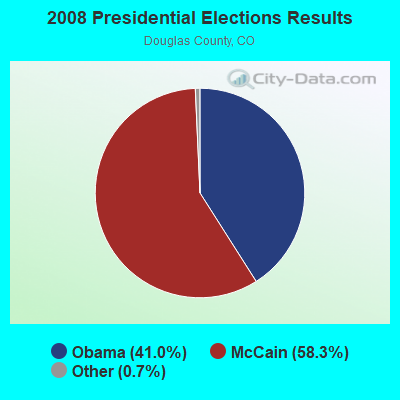
2008 Presidential Elections Results (%) - Democratic Party (Obama)
2008 Presidential Elections Results (%) - Republican Party (McCain)
2008 Presidential Elections Results (%) - Other
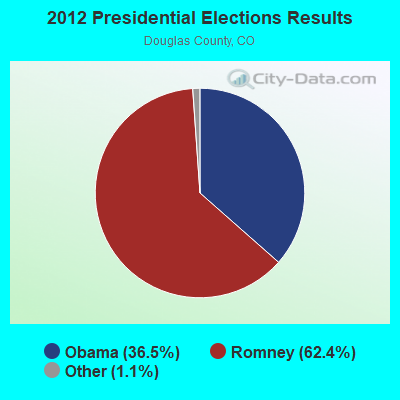
2012 Presidential Elections Results (%) - Democratic Party (Obama)
2012 Presidential Elections Results (%) - Republican Party (Romney)
2012 Presidential Elections Results (%) - Other
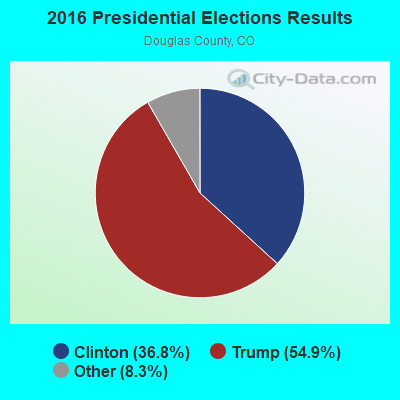
2016 Presidential Elections Results (%) - Democratic Party (Clinton)
2016 Presidential Elections Results (%) - Republican Party (Trump)
2016 Presidential Elections Results (%) - Other
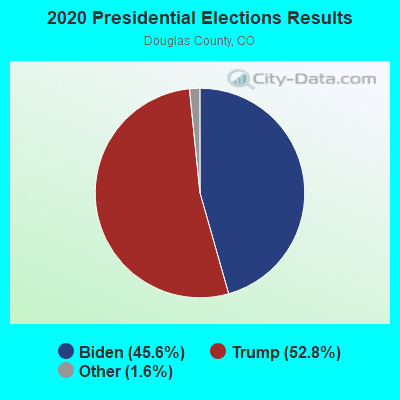
2020 Presidential Elections Results (%) - Democratic Party (Biden)
2020 Presidential Elections Results (%) - Republican Party (Trump)
2020 Presidential Elections Results (%) - Other
Ancestries Reported - Arab (%)
Ancestries Reported - Czech (%)
Ancestries Reported - Danish (%)
Ancestries Reported - Dutch (%)
Ancestries Reported - English (%)
Ancestries Reported - French (%)
Ancestries Reported - French Canadian (%)
Ancestries Reported - German (%)
Ancestries Reported - Greek (%)
Ancestries Reported - Hungarian (%)
Ancestries Reported - Irish (%)
Ancestries Reported - Italian (%)
Ancestries Reported - Lithuanian (%)
Ancestries Reported - Norwegian (%)
Ancestries Reported - Polish (%)
Ancestries Reported - Portuguese (%)
Ancestries Reported - Russian (%)
Ancestries Reported - Scotch-Irish (%)
Ancestries Reported - Scottish (%)
Ancestries Reported - Slovak (%)
Ancestries Reported - Subsaharan African (%)
Ancestries Reported - Swedish (%)
Ancestries Reported - Swiss (%)
Ancestries Reported - Ukrainian (%)
Ancestries Reported - United States (%)
Ancestries Reported - Welsh (%)
Ancestries Reported - West Indian (%)
Ancestries Reported - Other (%)
Educational Attainment - No schooling completed (%)
Educational Attainment - Less than high school (%)
Educational Attainment - High school or equivalent (%)
Educational Attainment - Less than 1 year of college (%)
Educational Attainment - 1 or more years of college (%)
Educational Attainment - Associate degree (%)
Educational Attainment - Bachelor's degree (%)
Educational Attainment - Master's degree (%)
Educational Attainment - Professional school degree (%)
Educational Attainment - Doctorate degree (%)
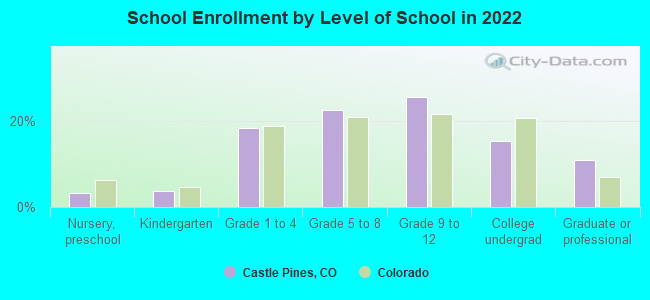
School Enrollment - Nursery, preschool (%)
School Enrollment - Kindergarten (%)
School Enrollment - Grade 1 to 4 (%)
School Enrollment - Grade 5 to 8 (%)
School Enrollment - Grade 9 to 12 (%)
School Enrollment - College undergrad (%)
School Enrollment - Graduate or professional (%)
School Enrollment - Not enrolled in school (%)
School enrollment - Public schools (%)
School enrollment - Private schools (%)
School enrollment - Not enrolled (%)
Median number of rooms in houses and condos
Median number of rooms in apartments
Housing units lacking complete plumbing facilities (%)
Housing units lacking complete kitchen facilities (%)
Density of houses
Urban houses (%)
Rural houses (%)
Households with people 60 years and over (%)
Households with people 65 years and over (%)
Households with people 75 years and over (%)
Households with one or more nonrelatives (%)
Households with no nonrelatives (%)
Population in households (%)
Family households (%)
Nonfamily households (%)
Population in families (%)
Family households with own children (%)
Median number of bedrooms in owner occupied houses
Mean number of bedrooms in owner occupied houses
Median number of bedrooms in renter occupied houses
Mean number of bedrooms in renter occupied houses
Median number of vehichles in owner occupied houses
Mean number of vehichles in owner occupied houses
Median number of vehichles in renter occupied houses
Mean number of vehichles in renter occupied houses
Mortgage status - with mortgage (%)
Mortgage status - with second mortgage (%)
Mortgage status - with home equity loan (%)
Mortgage status - with both second mortgage and home equity loan (%)
Mortgage status - without a mortgage (%)
Average family size
Average family size - White
Average family size - Black or African American
Average family size - Asian
Average family size - Hispanic or Latino
Average family size - American Indian and Alaska Native
Average family size - Multirace
Average family size - Other Race
Geographical mobility - Same house 1 year ago (%)
Geographical mobility - Moved within same county (%)
Geographical mobility - Moved from different county within same state (%)
Geographical mobility - Moved from different state (%)
Geographical mobility - Moved from abroad (%)
Place of birth - Born in state of residence (%)
Place of birth - Born in other state (%)
Place of birth - Native, outside of US (%)
Place of birth - Foreign born (%)
Housing units in structures - 1, detached (%)
Housing units in structures - 1, attached (%)
Housing units in structures - 2 (%)
Housing units in structures - 3 or 4 (%)
Housing units in structures - 5 to 9 (%)
Housing units in structures - 10 to 19 (%)
Housing units in structures - 20 to 49 (%)
Housing units in structures - 50 or more (%)
Housing units in structures - Mobile home (%)
Housing units in structures - Boat, RV, van, etc. (%)
House/condo owner moved in on average (years ago)
Renter moved in on average (years ago)
Year householder moved into unit - Moved in 1999 to March 2000 (%)
Year householder moved into unit - Moved in 1995 to 1998 (%)
Year householder moved into unit - Moved in 1990 to 1994 (%)
Year householder moved into unit - Moved in 1980 to 1989 (%)
Year householder moved into unit - Moved in 1970 to 1979 (%)
Year householder moved into unit - Moved in 1969 or earlier (%)
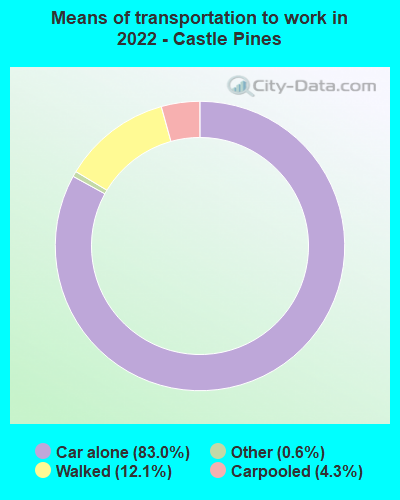
Means of transportation to work - Drove car alone (%)
Means of transportation to work - Carpooled (%)
Means of transportation to work - Public transportation (%)
Means of transportation to work - Bus or trolley bus (%)
Means of transportation to work - Streetcar or trolley car (%)
Means of transportation to work - Subway or elevated (%)
Means of transportation to work - Railroad (%)
Means of transportation to work - Ferryboat (%)
Means of transportation to work - Taxicab (%)
Means of transportation to work - Motorcycle (%)
Means of transportation to work - Bicycle (%)
Means of transportation to work - Walked (%)
Means of transportation to work - Other means (%)
Working at home (%)
Industry diversity
Most Common Industries - Agriculture, forestry, fishing and hunting, and mining (%)
Most Common Industries - Agriculture, forestry, fishing and hunting (%)
Most Common Industries - Mining, quarrying, and oil and gas extraction (%)
Most Common Industries - Construction (%)
Most Common Industries - Manufacturing (%)
Most Common Industries - Wholesale trade (%)
Most Common Industries - Retail trade (%)
Most Common Industries - Transportation and warehousing, and utilities (%)
Most Common Industries - Transportation and warehousing (%)
Most Common Industries - Utilities (%)
Most Common Industries - Information (%)
Most Common Industries - Finance and insurance, and real estate and rental and leasing (%)
Most Common Industries - Finance and insurance (%)
Most Common Industries - Real estate and rental and leasing (%)
Most Common Industries - Professional, scientific, and management, and administrative and waste management services (%)
Most Common Industries - Professional, scientific, and technical services (%)
Most Common Industries - Management of companies and enterprises (%)
Most Common Industries - Administrative and support and waste management services (%)
Most Common Industries - Educational services, and health care and social assistance (%)
Most Common Industries - Educational services (%)
Most Common Industries - Health care and social assistance (%)
Most Common Industries - Arts, entertainment, and recreation, and accommodation and food services (%)
Most Common Industries - Arts, entertainment, and recreation (%)
Most Common Industries - Accommodation and food services (%)
Most Common Industries - Other services, except public administration (%)
Most Common Industries - Public administration (%)
Occupation diversity
Most Common Occupations - Management, business, science, and arts occupations (%)
Most Common Occupations - Management, business, and financial occupations (%)
Most Common Occupations - Management occupations (%)
Most Common Occupations - Business and financial operations occupations (%)
Most Common Occupations - Computer, engineering, and science occupations (%)
Most Common Occupations - Computer and mathematical occupations (%)
Most Common Occupations - Architecture and engineering occupations (%)
Most Common Occupations - Life, physical, and social science occupations (%)
Most Common Occupations - Education, legal, community service, arts, and media occupations (%)
Most Common Occupations - Community and social service occupations (%)
Most Common Occupations - Legal occupations (%)
Most Common Occupations - Education, training, and library occupations (%)
Most Common Occupations - Arts, design, entertainment, sports, and media occupations (%)
Most Common Occupations - Healthcare practitioners and technical occupations (%)
Most Common Occupations - Health diagnosing and treating practitioners and other technical occupations (%)
Most Common Occupations - Health technologists and technicians (%)
Most Common Occupations - Service occupations (%)
Most Common Occupations - Healthcare support occupations (%)
Most Common Occupations - Protective service occupations (%)
Most Common Occupations - Fire fighting and prevention, and other protective service workers including supervisors (%)
Most Common Occupations - Law enforcement workers including supervisors (%)
Most Common Occupations - Food preparation and serving related occupations (%)
Most Common Occupations - Building and grounds cleaning and maintenance occupations (%)
Most Common Occupations - Personal care and service occupations (%)
Most Common Occupations - Sales and office occupations (%)
Most Common Occupations - Sales and related occupations (%)
Most Common Occupations - Office and administrative support occupations (%)
Most Common Occupations - Natural resources, construction, and maintenance occupations (%)
Most Common Occupations - Farming, fishing, and forestry occupations (%)
Most Common Occupations - Construction and extraction occupations (%)
Most Common Occupations - Installation, maintenance, and repair occupations (%)
Most Common Occupations - Production, transportation, and material moving occupations (%)
Most Common Occupations - Production occupations (%)
Most Common Occupations - Transportation occupations (%)
Most Common Occupations - Material moving occupations (%)
People in Group quarters - Institutionalized population (%)
People in Group quarters - Correctional institutions (%)
People in Group quarters - Federal prisons and detention centers (%)
People in Group quarters - Halfway houses (%)
People in Group quarters - Local jails and other confinement facilities (including police lockups) (%)
People in Group quarters - Military disciplinary barracks (%)
People in Group quarters - State prisons (%)
People in Group quarters - Other types of correctional institutions (%)
People in Group quarters - Nursing homes (%)
People in Group quarters - Hospitals/wards, hospices, and schools for the handicapped (%)
People in Group quarters - Hospitals/wards and hospices for chronically ill (%)
People in Group quarters - Hospices or homes for chronically ill (%)
People in Group quarters - Military hospitals or wards for chronically ill (%)
People in Group quarters - Other hospitals or wards for chronically ill (%)
People in Group quarters - Hospitals or wards for drug/alcohol abuse (%)
People in Group quarters - Mental (Psychiatric) hospitals or wards (%)
People in Group quarters - Schools, hospitals, or wards for the mentally retarded (%)
People in Group quarters - Schools, hospitals, or wards for the physically handicapped (%)
People in Group quarters - Institutions for the deaf (%)
People in Group quarters - Institutions for the blind (%)
People in Group quarters - Orthopedic wards and institutions for the physically handicapped (%)
People in Group quarters - Wards in general hospitals for patients who have no usual home elsewhere (%)
People in Group quarters - Wards in military hospitals for patients who have no usual home elsewhere (%)
People in Group quarters - Juvenile institutions (%)
People in Group quarters - Long-term care (%)
People in Group quarters - Homes for abused, dependent, and neglected children (%)
People in Group quarters - Residential treatment centers for emotionally disturbed children (%)
People in Group quarters - Training schools for juvenile delinquents (%)
People in Group quarters - Short-term care, detention or diagnostic centers for delinquent children (%)
People in Group quarters - Type of juvenile institution unknown (%)
People in Group quarters - Noninstitutionalized population (%)
People in Group quarters - College dormitories (includes college quarters off campus) (%)
People in Group quarters - Military quarters (%)
People in Group quarters - On base (%)
People in Group quarters - Barracks, unaccompanied personnel housing (UPH), (Enlisted/Officer), ;and similar group living quarters for military personnel (%)
People in Group quarters - Transient quarters for temporary residents (%)
People in Group quarters - Military ships (%)
People in Group quarters - Group homes (%)
People in Group quarters - Homes or halfway houses for drug/alcohol abuse (%)
People in Group quarters - Homes for the mentally ill (%)
People in Group quarters - Homes for the mentally retarded (%)
People in Group quarters - Homes for the physically handicapped (%)
People in Group quarters - Other group homes (%)
People in Group quarters - Religious group quarters (%)
People in Group quarters - Dormitories (%)
People in Group quarters - Agriculture workers' dormitories on farms (%)
People in Group quarters - Job Corps and vocational training facilities (%)
People in Group quarters - Other workers' dormitories (%)
People in Group quarters - Crews of maritime vessels (%)
People in Group quarters - Other nonhousehold living situations (%)
People in Group quarters - Other noninstitutional group quarters (%)
Residents speaking English at home (%)
Residents speaking English at home - Born in the United States (%)
Residents speaking English at home - Native, born elsewhere (%)
Residents speaking English at home - Foreign born (%)
Residents speaking Spanish at home (%)
Residents speaking Spanish at home - Born in the United States (%)
Residents speaking Spanish at home - Native, born elsewhere (%)
Residents speaking Spanish at home - Foreign born (%)
Residents speaking other language at home (%)
Residents speaking other language at home - Born in the United States (%)
Residents speaking other language at home - Native, born elsewhere (%)
Residents speaking other language at home - Foreign born (%)
Class of Workers - Employee of private company (%)
Class of Workers - Self-employed in own incorporated business (%)
Class of Workers - Private not-for-profit wage and salary workers (%)
Class of Workers - Local government workers (%)
Class of Workers - State government workers (%)
Class of Workers - Federal government workers (%)
Class of Workers - Self-employed workers in own not incorporated business and Unpaid family workers (%)
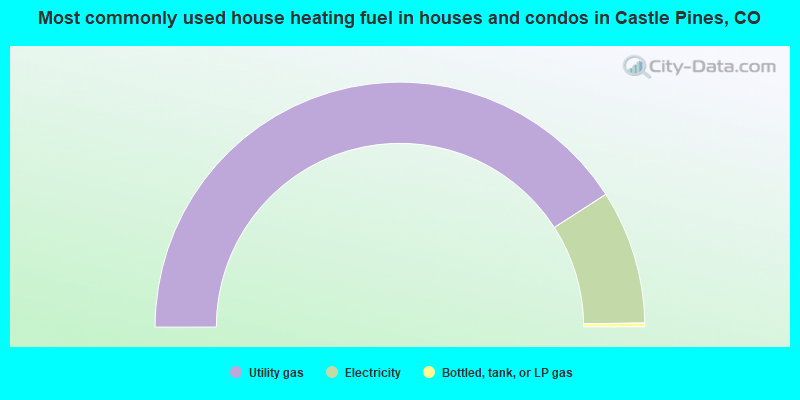
House heating fuel used in houses and condos - Utility gas (%)
House heating fuel used in houses and condos - Bottled, tank, or LP gas (%)
House heating fuel used in houses and condos - Electricity (%)
House heating fuel used in houses and condos - Fuel oil, kerosene, etc. (%)
House heating fuel used in houses and condos - Coal or coke (%)
House heating fuel used in houses and condos - Wood (%)
House heating fuel used in houses and condos - Solar energy (%)
House heating fuel used in houses and condos - Other fuel (%)
House heating fuel used in houses and condos - No fuel used (%)
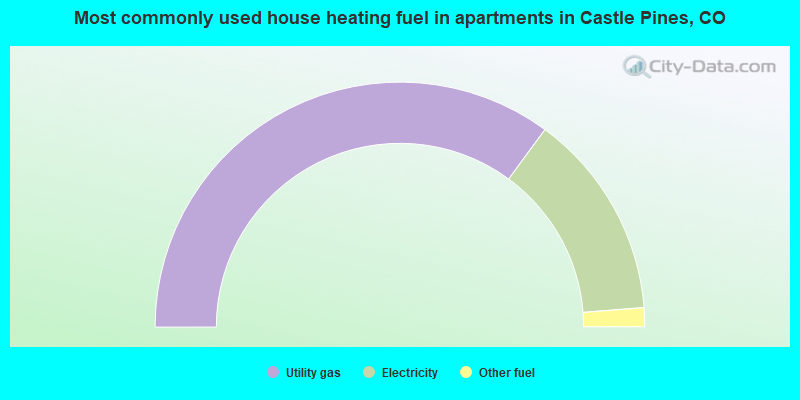
House heating fuel used in apartments - Utility gas (%)
House heating fuel used in apartments - Bottled, tank, or LP gas (%)
House heating fuel used in apartments - Electricity (%)
House heating fuel used in apartments - Fuel oil, kerosene, etc. (%)
House heating fuel used in apartments - Coal or coke (%)
House heating fuel used in apartments - Wood (%)
House heating fuel used in apartments - Solar energy (%)
House heating fuel used in apartments - Other fuel (%)
House heating fuel used in apartments - No fuel used (%)
Armed forces status - In Armed Forces (%)
Armed forces status - Civilian (%)
Armed forces status - Civilian - Veteran (%)
Armed forces status - Civilian - Nonveteran (%)
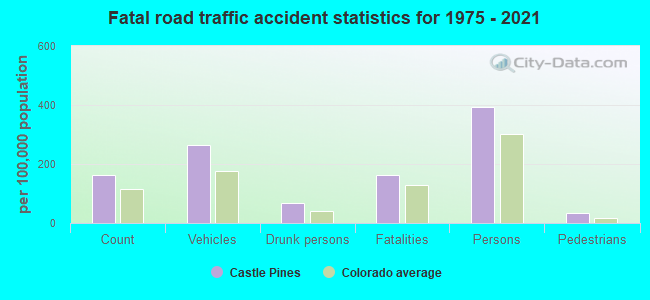
Fatal accidents locations in years 2005-2021
Fatal accidents locations in 2005
Fatal accidents locations in 2006
Fatal accidents locations in 2007
Fatal accidents locations in 2008
Fatal accidents locations in 2009
Fatal accidents locations in 2010
Fatal accidents locations in 2011
Fatal accidents locations in 2012
Fatal accidents locations in 2013
Fatal accidents locations in 2014
Fatal accidents locations in 2015
Fatal accidents locations in 2016
Fatal accidents locations in 2017
Fatal accidents locations in 2018
Fatal accidents locations in 2019
Fatal accidents locations in 2020
Fatal accidents locations in 2021
Alcohol use - People drinking some alcohol every month (%)
Alcohol use - People not drinking at all (%)
Alcohol use - Average days/month drinking alcohol
Alcohol use - Average drinks/week
Alcohol use - Average days/year people drink much
Audiometry - Average condition of hearing (%)
Audiometry - People that can hear a whisper from across a quiet room (%)
Audiometry - People that can hear normal voice from across a quiet room (%)
Audiometry - Ears ringing, roaring, buzzing (%)
Audiometry - Had a job exposure to loud noise (%)
Audiometry - Had off-work exposure to loud noise (%)
Blood Pressure & Cholesterol - Has high blood pressure (%)
Blood Pressure & Cholesterol - Checking blood pressure at home (%)
Blood Pressure & Cholesterol - Frequently checking blood cholesterol (%)
Blood Pressure & Cholesterol - Has high cholesterol level (%)
Consumer Behavior - Money monthly spent on food at supermarket/grocery store
Consumer Behavior - Money monthly spent on food at other stores
Consumer Behavior - Money monthly spent on eating out
Consumer Behavior - Money monthly spent on carryout/delivered foods
Consumer Behavior - Income spent on food at supermarket/grocery store (%)
Consumer Behavior - Income spent on food at other stores (%)
Consumer Behavior - Income spent on eating out (%)
Consumer Behavior - Income spent on carryout/delivered foods (%)
Current Health Status - General health condition (%)
Current Health Status - Blood donors (%)
Current Health Status - Has blood ever tested for HIV virus (%)
Current Health Status - Left-handed people (%)
Dermatology - People using sunscreen (%)
Diabetes - Diabetics (%)
Diabetes - Had a blood test for high blood sugar (%)
Diabetes - People taking insulin (%)
Diet Behavior & Nutrition - Diet health (%)
Diet Behavior & Nutrition - Milk product consumption (# of products/month)
Diet Behavior & Nutrition - Meals not home prepared (#/week)
Diet Behavior & Nutrition - Meals from fast food or pizza place (#/week)
Diet Behavior & Nutrition - Ready-to-eat foods (#/month)
Diet Behavior & Nutrition - Frozen meals/pizza (#/month)
Drug Use - People that ever used marijuana or hashish (%)
Drug Use - Ever used hard drugs (%)
Drug Use - Ever used any form of cocaine (%)
Drug Use - Ever used heroin (%)
Drug Use - Ever used methamphetamine (%)
Health Insurance - People covered by health insurance (%)
Kidney Conditions-Urology - Avg. # of times urinating at night
Medical Conditions - People with asthma (%)
Medical Conditions - People with anemia (%)
Medical Conditions - People with psoriasis (%)
Medical Conditions - People with overweight (%)
Medical Conditions - Elderly people having difficulties in thinking or remembering (%)
Medical Conditions - People who ever received blood transfusion (%)
Medical Conditions - People having trouble seeing even with glass/contacts (%)
Medical Conditions - People with arthritis (%)
Medical Conditions - People with gout (%)
Medical Conditions - People with congestive heart failure (%)
Medical Conditions - People with coronary heart disease (%)
Medical Conditions - People with angina pectoris (%)
Medical Conditions - People who ever had heart attack (%)
Medical Conditions - People who ever had stroke (%)
Medical Conditions - People with emphysema (%)
Medical Conditions - People with thyroid problem (%)
Medical Conditions - People with chronic bronchitis (%)
Medical Conditions - People with any liver condition (%)
Medical Conditions - People who ever had cancer or malignancy (%)
Mental Health - People who have little interest in doing things (%)
Mental Health - People feeling down, depressed, or hopeless (%)
Mental Health - People who have trouble sleeping or sleeping too much (%)
Mental Health - People feeling tired or having little energy (%)
Mental Health - People with poor appetite or overeating (%)
Mental Health - People feeling bad about themself (%)
Mental Health - People who have trouble concentrating on things (%)
Mental Health - People moving or speaking slowly or too fast (%)
Mental Health - People having thoughts they would be better off dead (%)
Oral Health - Average years since last visit a dentist
Oral Health - People embarrassed because of mouth (%)
Oral Health - People with gum disease (%)
Oral Health - General health of teeth and gums (%)
Oral Health - Average days a week using dental floss/device
Oral Health - Average days a week using mouthwash for dental problem
Oral Health - Average number of teeth
Pesticide Use - Households using pesticides to control insects (%)
Pesticide Use - Households using pesticides to kill weeds (%)
Physical Activity - People doing vigorous-intensity work activities (%)
Physical Activity - People doing moderate-intensity work activities (%)
Physical Activity - People walking or bicycling (%)
Physical Activity - People doing vigorous-intensity recreational activities (%)
Physical Activity - People doing moderate-intensity recreational activities (%)
Physical Activity - Average hours a day doing sedentary activities
Physical Activity - Average hours a day watching TV or videos
Physical Activity - Average hours a day using computer
Physical Functioning - People having limitations keeping them from working (%)
Physical Functioning - People limited in amount of work they can do (%)
Physical Functioning - People that need special equipment to walk (%)
Physical Functioning - People experiencing confusion/memory problems (%)
Physical Functioning - People requiring special healthcare equipment (%)
Prescription Medications - Average number of prescription medicines taking
Preventive Aspirin Use - Adults 40+ taking low-dose aspirin (%)
Reproductive Health - Vaginal deliveries (%)
Reproductive Health - Cesarean deliveries (%)
Reproductive Health - Deliveries resulted in a live birth (%)
Reproductive Health - Pregnancies resulted in a delivery (%)
Reproductive Health - Women breastfeeding newborns (%)
Reproductive Health - Women that had a hysterectomy (%)
Reproductive Health - Women that had both ovaries removed (%)
Reproductive Health - Women that have ever taken birth control pills (%)
Reproductive Health - Women taking birth control pills (%)
Reproductive Health - Women that have ever used Depo-Provera or injectables (%)
Reproductive Health - Women that have ever used female hormones (%)
Sexual Behavior - People 18+ that ever had sex (vaginal, anal, or oral) (%)
Sexual Behavior - Males 18+ that ever had vaginal sex with a woman (%)
Sexual Behavior - Males 18+ that ever performed oral sex on a woman (%)
Sexual Behavior - Males 18+ that ever had anal sex with a woman (%)
Sexual Behavior - Males 18+ that ever had any sex with a man (%)
Sexual Behavior - Females 18+ that ever had vaginal sex with a man (%)
Sexual Behavior - Females 18+ that ever performed oral sex on a man (%)
Sexual Behavior - Females 18+ that ever had anal sex with a man (%)
Sexual Behavior - Females 18+ that ever had any kind of sex with a woman (%)
Sexual Behavior - Average age people first had sex
Sexual Behavior - Average number of female sex partners in lifetime (males 18+)
Sexual Behavior - Average number of female vaginal sex partners in lifetime (males 18+)
Sexual Behavior - Average age people first performed oral sex on a woman (18+)
Sexual Behavior - Average number of woman performed oral sex on in lifetime (18+)
Sexual Behavior - Average number of male sex partners in lifetime (males 18+)
Sexual Behavior - Average number of male anal sex partners in lifetime (males 18+)
Sexual Behavior - Average age people first performed oral sex on a man (18+)
Sexual Behavior - Average number of male oral sex partners in lifetime (18+)
Sexual Behavior - People using protection when performing oral sex (%)
Sexual Behavior - Average number of times people have vaginal or anal sex a year
Sexual Behavior - People having sex without condom (%)
Sexual Behavior - Average number of male sex partners in lifetime (females 18+)
Sexual Behavior - Average number of male vaginal sex partners in lifetime (females 18+)
Sexual Behavior - Average number of female sex partners in lifetime (females 18+)
Sexual Behavior - Circumcised males 18+ (%)
Sleep Disorders - Average hours sleeping at night
Sleep Disorders - People that has trouble sleeping (%)
Smoking-Cigarette Use - People smoking cigarettes (%)
Taste & Smell - People 40+ having problems with smell (%)
Taste & Smell - People 40+ having problems with taste (%)
Taste & Smell - People 40+ that ever had wisdom teeth removed (%)
Taste & Smell - People 40+ that ever had tonsils teeth removed (%)
Taste & Smell - People 40+ that ever had a loss of consciousness because of a head injury (%)
Taste & Smell - People 40+ that ever had a broken nose or other serious injury to face or skull (%)
Taste & Smell - People 40+ that ever had two or more sinus infections (%)
Weight - Average height (inches)
Weight - Average weight (pounds)
Weight - Average BMI
Weight - People that are obese (%)
Weight - People that ever were obese (%)
Weight - People trying to lose weight (%)
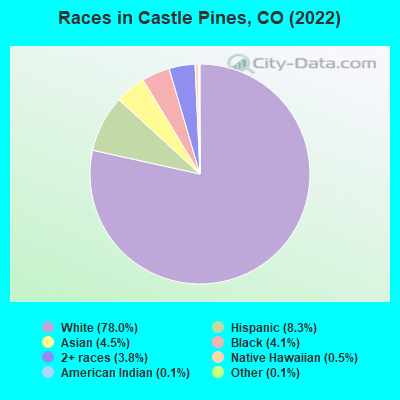
9,612 78.0% White alone 1,022 8.3% Hispanic 553 4.5% Asian alone 506 4.1% Black alone 467 3.8% Two or more races 60 0.5% Native Hawaiian and Other 16 0.1% American Indian alone 13 0.1% Other race alone
According to our research of Colorado and other state lists, there was 1 registered sex offender living in Castle Pines, Colorado as of April 28, 2024 . The ratio of all residents to sex offenders in Castle Pines is 10,864 to 1.The ratio of registered sex offenders to all residents in this city is much lower than the state average.
Latest news from Castle Pines, CO collected exclusively by city-data.com from local newspapers, TV, and radio stations
Ancestries: European (9.7%), English (8.6%), German (8.2%), Irish (6.0%), American (5.9%), Iranian (5.6%).
Current Local Time:
Land area: 10.2 square miles.
Population density: 1,316 people per square mile (low).
1,385 residents are foreign born (5.0% Asia , 2.6% Africa , 2.0% Latin America , 1.5% Europe ).
This place:
11.2%Colorado:
9.5%
Median real estate property taxes paid for housing units with mortgages in 2022: $4,838 (0.5%)Median real estate property taxes paid for housing units with no mortgage in 2022: $4,254 (0.6%)
Nearest city with pop. 50,000+: Highlands Ranch, CO
Nearest city with pop. 200,000+: South Aurora, CO (15.1 miles
Nearest city with pop. 1,000,000+: Phoenix, AZ
Nearest cities:
Meridian, CO (2.5 miles)
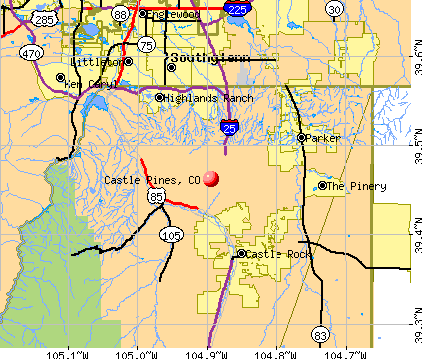
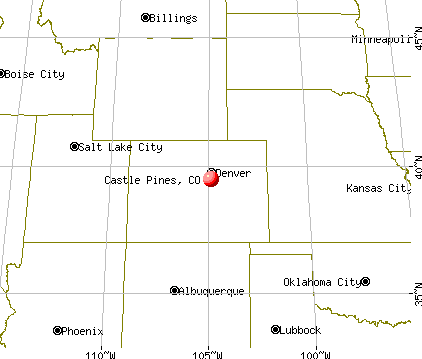
Latitude: 39.46 N, Longitude: 104.89 W
Daytime population change due to commuting: -2,272 (-18.4%)Workers who live and work in this place: 3,323 (49.4%)
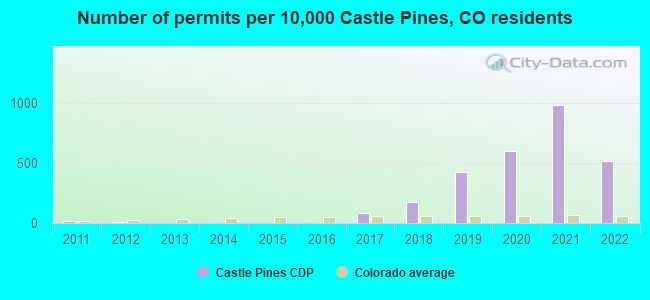
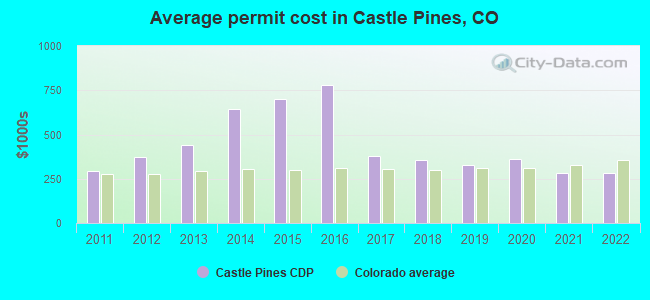
Single-family new house construction building permits:
2022: 309 buildings , average cost: $281,2002021: 585 buildings , average cost: $284,6002020: 358 buildings , average cost: $364,4002019: 254 buildings , average cost: $326,8002018: 106 buildings , average cost: $358,1002017: 47 buildings , average cost: $381,3002016: 2 buildings , average cost: $777,0002015: 1 building , cost: $700,0002014: 1 building , cost: $645,0002013: 1 building , cost: $440,0002012: 7 buildings , average cost: $372,9002011: 9 buildings , average cost: $294,600Unemployment in December 2023:
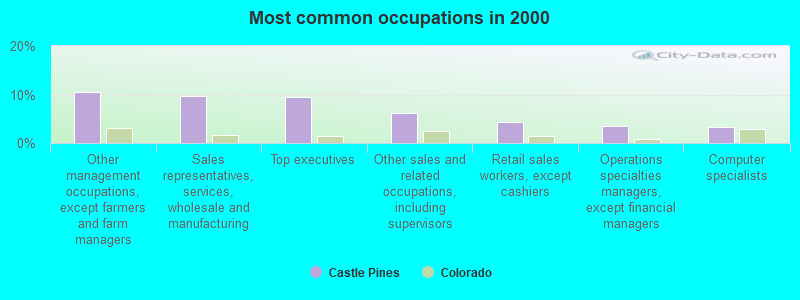
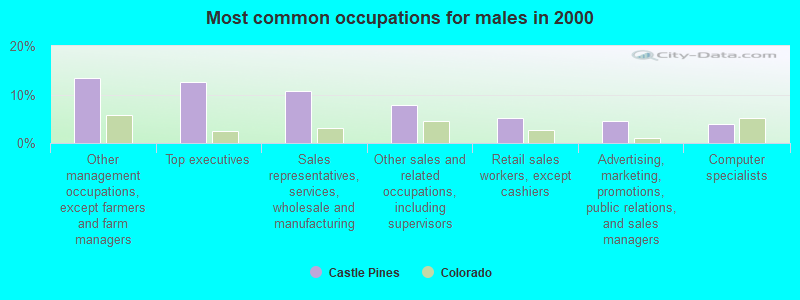
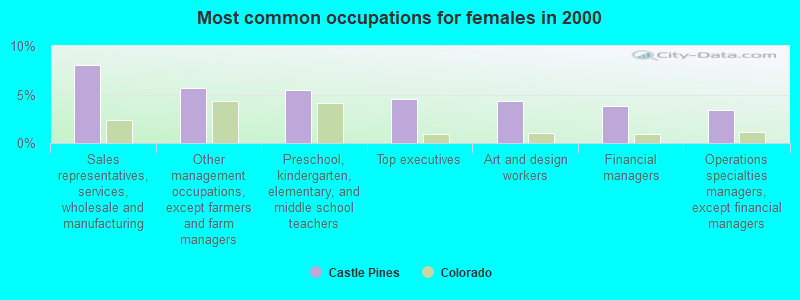
Most common occupations in Castle Pines, CO (%)
Both Males Females
Other management occupations, except farmers and farm managers (10.4%)
Sales representatives, services, wholesale and manufacturing (9.7%)
Top executives (9.5%)
Other sales and related occupations, including supervisors (6.1%)
Retail sales workers, except cashiers (4.4%)
Operations specialties managers, except financial managers (3.5%)
Computer specialists (3.4%)
Other management occupations, except farmers and farm managers (13.3%)
Top executives (12.6%)
Sales representatives, services, wholesale and manufacturing (10.8%)
Other sales and related occupations, including supervisors (7.8%)
Retail sales workers, except cashiers (5.1%)
Advertising, marketing, promotions, public relations, and sales managers (4.6%)
Computer specialists (4.0%)
Sales representatives, services, wholesale and manufacturing (8.0%)
Other management occupations, except farmers and farm managers (5.7%)
Preschool, kindergarten, elementary, and middle school teachers (5.5%)
Top executives (4.5%)
Art and design workers (4.3%)
Financial managers (3.8%)
Operations specialties managers, except financial managers (3.4%)
Tornado activity:
Castle Pines-area historical tornado activity is above Colorado state average. It is 22% greater than the overall U.S. average.
On 6/15/1988, a category F3 (max. wind speeds 158-206 mph) tornado 18.6 miles away from the Castle Pines place center injured 7 people and caused between $5,000,000 and $50,000,000 in damages.
On 5/18/1975, a category F3 tornado 25.0 miles away from the place center .
Earthquake activity:
Castle Pines-area historical earthquake activity is significantly above Colorado state average. It is 713% greater than the overall U.S. average. On 8/18/1959 at 06:37:13, a magnitude 7.7 (7.7 UK, Class: Major, Intensity: VIII - XII) earthquake occurred 460.5 miles away from the city center, causing $26,000,000 total damage On 10/18/1984 at 15:30:23, a magnitude 5.5 (5.4 MB, 5.1 MS, 5.5 ML, Class: Moderate, Intensity: VI - VII) earthquake occurred 205.9 miles away from Castle Pines center On 8/23/2011 at 05:46:18, a magnitude 5.3 (5.3 MW, Depth: 2.5 mi) earthquake occurred 166.3 miles away from the city center On 10/28/1983 at 14:06:06, a magnitude 7.3 (6.2 MB, 7.3 MS, 7.0 MW) earthquake occurred 559.0 miles away from the city center, causing 2 deaths ( 2 shaking deaths) and 3 injuries, causing $15,000,000 total damage On 8/10/2005 at 22:08:22, a magnitude 5.0 (5.0 MW, Depth: 3.1 mi) earthquake occurred 174.0 miles away from Castle Pines center On 8/10/2005 at 22:08:22, a magnitude 5.0 (5.0 MB, 4.7 MS, 5.0 MW) earthquake occurred 176.0 miles away from Castle Pines center Magnitude types: body-wave magnitude (MB), local magnitude (ML), surface-wave magnitude (MS), moment magnitude (MW) Natural disasters: The number of natural disasters in Douglas County (11) is smaller than the US average (15).Major Disasters (Presidential) Declared: 4Emergencies Declared: 4Fires: 3, Floods: 3, Snows: 2, Storms: 2, Drought: 1, Heavy Rain: 1, Hurricane: 1, Snowstorm: 1, Tornado: 1, Other: 1 (Note: some incidents may be assigned to more than one category). Hospitals and medical centers near Castle Pines: CASTLE ROCK CARE CENTER (Nursing Home, about 4 miles away; CASTLE ROCK, CO)
CASTLE HOME CARE (Home Health Center, about 7 miles away; CASTLE ROCK, CO)
BROOKSIDE INN (Nursing Home, about 7 miles away; CASTLE ROCK, CO)
COMFORT CARE HOME HEALTH (Home Health Center, about 9 miles away; PARKER, CO)
PARKER DIALYSIS (DVA) (Dialysis Facility, about 9 miles away; PARKER, CO)
HIGHLANDS RANCH SAME DAY SURGERY (Hospital, about 9 miles away; HIGHLANDS RANCH, CO)
CHRISTIAN LIVING COMMUNITIES THE JOHNSON CENTER SK (Nursing Home, about 10 miles away; CENTENNIAL, CO)
Colleges/universities with over 2000 students nearest to Castle Pines:
Jones International University (about 8 miles; Centennial, CO ; Full-time enrollment: 2,556)
Colorado State University-Global Campus (about 11 miles; Greenwood Village, CO ; FT enrollment: 3,642)
Arapahoe Community College (about 13 miles; Littleton, CO ; FT enrollment: 6,619)
University of Denver (about 17 miles; Denver, CO ; FT enrollment: 9,621)
Community College of Aurora (about 19 miles; Aurora, CO ; FT enrollment: 4,730)
Emily Griffith Technical College (about 21 miles; Denver, CO ; FT enrollment: 2,460)
Community College of Denver (about 21 miles; Denver, CO ; FT enrollment: 7,329)
Public elementary/middle school in Castle Pines: AMERICAN ACADEMY Students: 41, Location: 6971 MIRA VISTA LANE, Grades: PK-8, Charter school )See full list of schools located in Castle Pines Douglas County has a predicted average indoor radon screening level greater than 4 pCi/L (pico curies per liter) - Highest Potential Drinking water stations with addresses in Castle Pines and their reported violations in the past:
CASTLE PINES NORTH MD (Population served: 9,500, Purch surface water):
Past monitoring violations:
Monitoring and Reporting (DBP) - Between JAN-2009 and MAR-2009, Contaminant: TTHM. Follow-up actions: St Public Notif requested (APR-23-2009), St Violation/Reminder Notice (APR-23-2009), St Compliance achieved (AUG-07-2009)
Monitoring and Reporting (DBP) - Between JAN-2009 and MAR-2009, Contaminant: Total Haloacetic Acids (HAA5). Follow-up actions: St Public Notif requested (APR-23-2009), St Violation/Reminder Notice (APR-23-2009), St Compliance achieved (AUG-07-2009)
Follow-up Or Routine LCR Tap M/R - In OCT-01-2008, Contaminant: Lead and Copper Rule. Follow-up actions: St Public Notif requested (NOV-11-2008), St Violation/Reminder Notice (NOV-11-2008), St Compliance achieved (NOV-18-2008)
Monitoring, Routine (IDSE) - In APR-01-2008, Contaminant: DBP STAGE 2. Follow-up actions: St Violation/Reminder Notice (JUL-15-2008), St Compliance achieved (APR-13-2009)
Monitoring and Reporting (DBP) - Between JAN-2008 and MAR-2008, Contaminant: Chlorine. Follow-up actions: St Public Notif requested (MAY-09-2008), St Violation/Reminder Notice (MAY-09-2008), St Compliance achieved (SEP-03-2008)
22 regular monitoring violations
2 other older monitoring violations
Average household size: This place:
2.7 peopleColorado:
2.5 people
Percentage of family households: This place:
88.4%Whole state:
63.9%
Percentage of households with unmarried partners: This place:
1.7%Whole state:
6.5%
Likely homosexual households (counted as self-reported same-sex unmarried-partner households)
Lesbian couples: 0.2% of all households Gay men: 0.1% of all households
Banks with branches in Castle Pines (2011 data):
Castle Rock Bank: 506 Castle Pines Parkway Branch at 506 Castle Pines North Pkwy, branch established on 2005/04/18. Info updated 2006/11/03: Bank assets: $105.3 mil, Deposits: $92.9 mil, headquarters in Castle Rock, CO, positive income , Commercial Lending Specialization, 2 total offices , Holding Company: Castle Rock Bank Holding Company
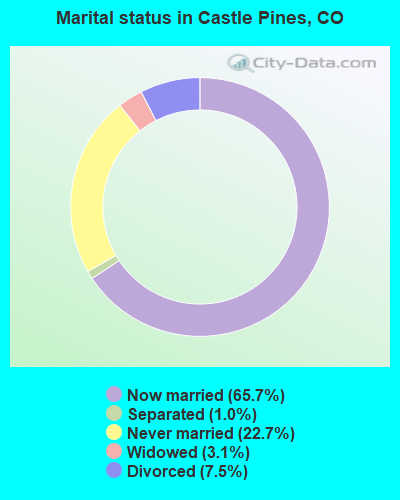
For population 15 years and over in Castle Pines:
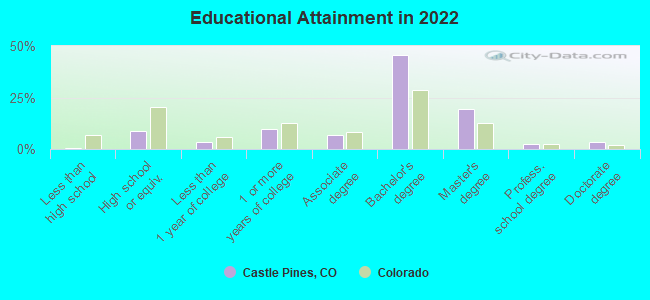
Never married: 22.7%Now married: 65.7%Separated: 1.0%Widowed: 3.1%Divorced: 7.5% For population 25 years and over in Castle Pines:
High school or higher: 99.6%Bachelor's degree or higher: 69.4%Graduate or professional degree: 25.7%Unemployed: 1.0%Mean travel time to work (commute): 17.4 minutes
Education Gini index (Inequality in education) Here:
7.3Colorado average:
11.1
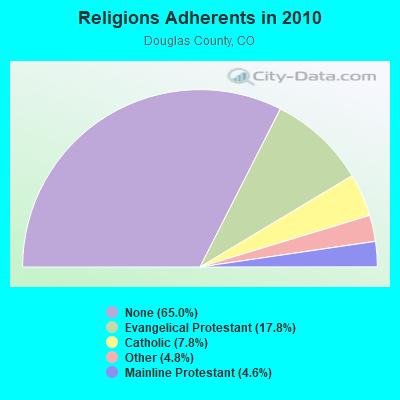
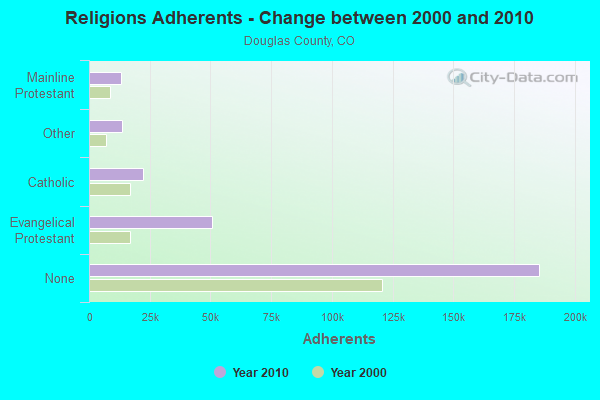
Religion statistics for Castle Pines, CO (based on Douglas County data)
Religion Adherents Congregations Evangelical Protestant 50,827 86 Catholic 22,360 4 Other 13,649 34 Mainline Protestant 13,182 12 Orthodox - - None 185,447 -
Source: Clifford Grammich, Kirk Hadaway, Richard Houseal, Dale E.Jones, Alexei Krindatch, Richie Stanley and Richard H.Taylor. 2012. 2010 U.S.Religion Census: Religious Congregations & Membership Study. Association of Statisticians of American Religious Bodies. Jones, Dale E., et al. 2002. Congregations and Membership in the United States 2000. Nashville, TN: Glenmary Research Center. Graphs represent county-level data
Food Environment Statistics: Number of grocery stores : 22Douglas County :
0.81 / 10,000 pop.Colorado :
1.50 / 10,000 pop.
Number of supercenters and club stores : 4This county :
0.15 / 10,000 pop.Colorado :
0.15 / 10,000 pop.
Number of convenience stores (no gas) : 3Here :
0.11 / 10,000 pop.Colorado :
0.45 / 10,000 pop.
Number of convenience stores (with gas) : 52Douglas County :
1.92 / 10,000 pop.Colorado :
3.13 / 10,000 pop.
Number of full-service restaurants : 173This county :
6.38 / 10,000 pop.Colorado :
8.99 / 10,000 pop.
Adult diabetes rate : This county :
3.6%Colorado :
5.3%
Adult obesity rate : Douglas County :
16.0%Colorado :
18.4%
Low-income preschool obesity rate : This county :
7.0%State :
9.6%
Health and Nutrition: Healthy diet rate : Castle Pines:
55.6%State:
49.4%
Average overall health of teeth and gums : People feeling badly about themselves : Castle Pines:
19.4%Colorado:
20.7%
People not drinking alcohol at all : Average hours sleeping at night : Castle Pines:
6.9Colorado:
6.8
Overweight people : Castle Pines:
35.8%Colorado:
33.3%
General health condition : This city:
62.2%Colorado:
57.3%
Average condition of hearing : Castle Pines:
81.7%Colorado:
80.2%
More about Health and Nutrition of Castle Pines, CO Residents
Local government employment and payroll (March 2022)
Function
Full-time employees
Monthly full-time payroll
Average yearly full-time wage
Part-time employees
Monthly part-time payroll
Other Government Administration
6 $49,247 $98,494 0 $0 Streets and Highways
3 $23,158 $92,632 0 $0 Financial Administration
1 $4,935 $59,220 0 $0 Parks and Recreation
0 $0 1 $1,061
Totals for Government
10 $77,341 $92,809 1 $1,061
Castle Pines government finances - Expenditure in 2017 (per resident):
Construction - Regular Highways: $1,824,000 ($135.25)
Current Operations - Regular Highways: $2,545,000 ($188.71)
Central Staff Services: $994,000 ($73.71)General - Other: $560,000 ($41.52)Parks and Recreation: $558,000 ($41.38)Financial Administration: $104,000 ($7.71)Solid Waste Management: $30,000 ($2.22)General Public Buildings: $26,000 ($1.93)Intergovernmental to Local - Other - Police Protection: $866,000 ($64.21)
Other - Judicial and Legal Services: $39,000 ($2.89)Total Salaries and Wages: $514,000 ($38.11)
Castle Pines government finances - Revenue in 2017 (per resident):
Local Intergovernmental - Highways: $433,000 ($32.11)
General Local Government Support: $410,000 ($30.40)Other: $60,000 ($4.45)Miscellaneous - Donations From Private Sources: $175,000 ($12.98)
Fines and Forfeits: $72,000 ($5.34)Interest Earnings: $45,000 ($3.34)General Revenue - Other: $1,000 ($0.07)State Intergovernmental - Highways: $278,000 ($20.61)
General Local Government Support: $6,000 ($0.44)Other: $5,000 ($0.37)Tax - General Sales and Gross Receipts: $2,715,000 ($201.32)
Property: $866,000 ($64.21)Public Utilities Sales: $491,000 ($36.41)Motor Vehicle License: $40,000 ($2.97)Occupation and Business License - Other: $34,000 ($2.52)Alcoholic Beverage License: $4,000 ($0.30)
Castle Pines government finances - Cash and Securities in 2017 (per resident):
Other Funds - Cash and Securities: $6,123,000 ($454.03)
12.60% of this county's 2021 resident taxpayers lived in other counties in 2020 ($109,095 average adjusted gross income )
Here:
12.60%Colorado average:
11.28%
0.03% of residents moved from foreign countries ($228 average AGI )Douglas County:
0.03%Colorado average:
0.05%
Top counties from which taxpayers relocated into this county between 2020 and 2021:
10.65% of this county's 2020 resident taxpayers moved to other counties in 2021 ($99,710 average adjusted gross income )
Here:
10.65%Colorado average:
11.05%
0.02% of residents moved to foreign countries ($200 average AGI )Douglas County:
0.02%Colorado average:
0.03%
Top counties to which taxpayers relocated from this county between 2020 and 2021: Businesses in Castle Pines, CO
Strongest AM radio stations in Castle Pines:
KOA (850 AM; 50 kW; DENVER, CO; Owner: JACOR BROADCASTING OF COLORADO, INC.)
KCUV (1510 AM; 25 kW; LITTLETON, CO; Owner: PEOPLE WIRELESS, INC.)
KEZW (1430 AM; 10 kW; AURORA, CO; Owner: ENTERCOM DENVER LICENSE, LLC)
KMXA (1090 AM; 50 kW; AURORA, CO; Owner: ENTRAVISION HOLDINGS, LLC)
KNRC (1150 AM; 10 kW; ENGLEWOOD, CO; Owner: NRC BROADCASTING, INC.)
KLTT (670 AM; 50 kW; COMMERCE CITY, CO; Owner: KLZ RADIO, INC.)
KKZN (760 AM; 50 kW; THORNTON, CO; Owner: JACOR BROADCASTING OF COLORADO, INC.)
KBNO (1280 AM; 5 kW; DENVER, CO; Owner: LATINO COMMUNICATIONS, LLC)
KADZ (1550 AM; 10 kW; ARVADA, CO; Owner: ABC, INC.)
KDDZ (1690 AM; 10 kW; ARVADA, CO; Owner: ABC, INC.)
KRKS (990 AM; 10 kW; DENVER, CO; Owner: SALEM MEDIA OF COLORADO, INC.)
KCKK (1600 AM; 5 kW; LAKEWOOD, CO; Owner: JEFFERSON-PILOT COMMUNICATIONS COMPANY OF COLORADO)
KLZ (560 AM; 5 kW; DENVER, CO; Owner: KLZ RADIO, INC.)
Strongest FM radio stations in Castle Pines:
KJMN (92.1 FM; CASTLE ROCK, CO; Owner: ENTRAVISION HOLDINGS, LLC)
KQMT (99.5 FM; DENVER, CO; Owner: ENTERCOM DENVER LICENSE, LLC)
KXKL-FM (105.1 FM; DENVER, CO; Owner: INFINITY RADIO OPERATIONS INC.)
KLDV (91.1 FM; MORRISON, CO; Owner: EDUCATIONAL MEDIA FOUNDATION)
KALC (105.9 FM; DENVER, CO; Owner: ENTERCOM DENVER LICENSE, LLC)
KBPI (106.7 FM; DENVER, CO; Owner: JACOR BROADCASTING OF COLORADO, INC.)
KOSI (101.1 FM; DENVER, CO; Owner: ENTERCOM DENVER LICENSE, LLC)
KFMD (95.7 FM; DENVER, CO; Owner: CITICASTERS LICENSES, L.P.)
KRFX (103.5 FM; DENVER, CO; Owner: JACOR BROADCASTING OF COLORADO, INC.)
KQKS (107.5 FM; LAKEWOOD, CO; Owner: JEFFERSON-PILOT COMMUNICATIONS COMPANY OF COLORADO)
KIMN (100.3 FM; DENVER, CO; Owner: INFINITY RADIO OPERATIONS INC.)
KVOD (90.1 FM; DENVER, CO; Owner: PUBLIC BROADCASTING OF COLORADO, INC)
KYGO-FM (98.5 FM; DENVER, CO; Owner: JEFFERSON-PILOT COMMUNICATIONS COMPANY OF COLORADO)
KXPK (96.5 FM; EVERGREEN, CO; Owner: ENTRAVISION HOLDINGS, LLC)
KUVO (89.3 FM; DENVER, CO; Owner: DENVER EDUCATIONAL BROADCASTING)
KKFM (98.1 FM; COLORADO SPRINGS, CO; Owner: CITADEL BROADCASTING COMPANY)
KBIQ (102.7 FM; MANITOU SPRINGS, CO; Owner: BISON MEDIA, INC.)
KKCS-FM (101.9 FM; COLORADO SPRINGS, CO; Owner: WALTON STATIONS - COLORADO, INC.)
KRCC (91.5 FM; COLORADO SPRINGS, CO; Owner: THE COLORADO COLLEGE)
KSKX (105.5 FM; SECURITY, CO; Owner: OPTIMA COMMUNICATIONS, INC.)
TV broadcast stations around Castle Pines:
KMGH-TV (Channel 7; DENVER, CO; Owner: MCGRAW-HILL BROADCASTING COMPANY, INC.)
K48FW (Channel 48; DENVER, CO; Owner: TRINITY BROADCASTING NETWORK)
KDEO-LP (Channel 38; AURORA, CO; Owner: PETER B. VAN DE SANDE)
KRMA-TV (Channel 6; DENVER, CO; Owner: ROCKY MOUNTAIN PUBLIC BROADCASTING NETWORK, INC.)
KUSA-TV (Channel 9; DENVER, CO; Owner: MULTIMEDIA HOLDINGS CORPORATION)
KWHD (Channel 53; CASTLE ROCK, CO; Owner: LESEA BROADCASTING CORPORATION)
KTVD (Channel 20; DENVER, CO; Owner: TWENVER BROADCAST, INC.)
KCNC-TV (Channel 4; DENVER, CO; Owner: CBS TELEVISION STATIONS INC.)
KDEV-LP (Channel 62; AURORA, CO; Owner: TIGER EYE BROADCASTING CORPORATION)
KWGN-TV (Channel 2; DENVER, CO; Owner: KWGN INC.)
KMAS-LP (Channel 63; DENVER, CO; Owner: TELEMUNDO OF STEAMBOAT SPRINGS COLO. LIC. CORP.)
KDEN (Channel 25; LONGMONT, CO; Owner: LONGMONT CHANNEL 25, INC.)
KPXC-TV (Channel 59; DENVER, CO; Owner: PAXSON DENVER LICENSE, INC.)
KDVR (Channel 31; DENVER, CO; Owner: FOX TELEVISION STATIONS, INC.)
KSBS-LP (Channel 67; DENVER, CO; Owner: TELEMUNDO OF STEAMBOAT SPRINGS COLO. LIC. CORP.)
National Bridge Inventory (NBI) Statistics 6 Number of bridges66ft / 19.8m Total length131,640 Total average daily traffic6,900 Total average daily truck traffic186,838 Total future (year 2040) average daily traffic
FCC Registered Antenna Towers: 3
Ronald D Obermueller, Daniels Park Substation 4.8 Mi Ne (Lat: 39.494472 Lon: -104.905278), Type: 57.9, Structure height: 08035 m, Overall height: 57.9 m, Registrant: Lerman Senter Pllc, Kcookler@lermansenter.Com, , Washi-ngton, Phone: (202) 416-6749 Ronald D Obermueller, Daniels Park Substation 4.8 Mi Ne (Lat: 39.494472 Lon: -104.905278), Type: 57.9, Structure height: 08035 m, Overall height: 57.9 m, Licensee ID: C, Registrant: Xcel Energy Services Inc., Ronald.D.Obermueller@xcelenergy.Com, , Minne-apolis, Phone: (612) 330-2876 Thomas Weiss, Daniels Park Substation 4.8 Mi Ne (Lat: 39.494472 Lon: -104.905278), Type: 57.9, Structure height: 08035 m, Overall height: 57.9 m, Registrant: Lerman Senter Pllc, Kcookler@lermansenter.Com, Suite 400, Washi-ngton, Phone: (202) 416-6749 FCC Registered Microwave Towers: 12 (
See the full list of FCC Registered Microwave Towers in this town )
FCC Registered Amateur Radio Licenses: 37 (
See the full list of FCC Registered Amateur Radio Licenses in Castle Pines )
FAA Registered Aircraft: 8 (
See the full list of FAA Registered Aircraft in Castle Pines )
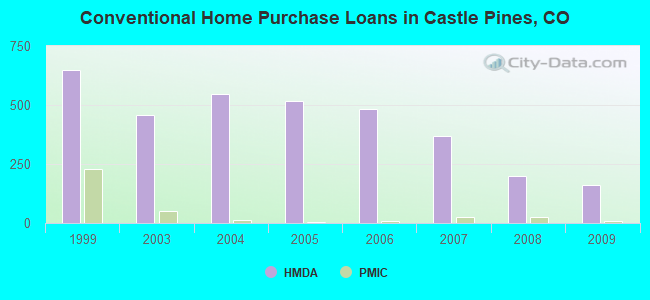
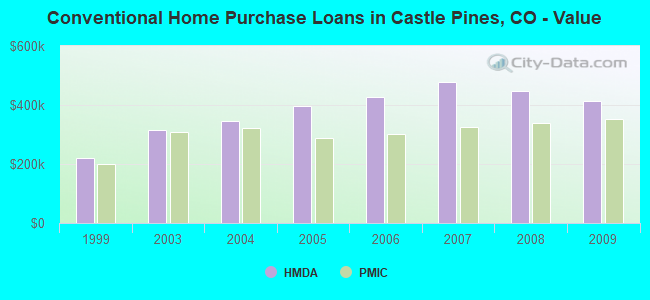
Home Mortgage Disclosure Act Aggregated Statistics For Year 2009(Based on 1 full and 2 partial tracts) A) FHA, FSA/RHS & VA B) Conventional C) Refinancings D) Home Improvement Loans F) Non-occupant Loans on Number Average Value Number Average Value Number Average Value Number Average Value Number Average Value
LOANS ORIGINATED 30 $328,380 163 $413,569 758 $344,991 15 $401,988 26 $458,084 APPLICATIONS APPROVED, NOT ACCEPTED 2 $221,050 18 $437,729 65 $406,107 1 $571,430 4 $331,485 APPLICATIONS DENIED 6 $371,502 18 $503,301 153 $505,878 13 $75,815 4 $227,168 APPLICATIONS WITHDRAWN 2 $385,555 23 $532,201 109 $348,293 2 $276,420 3 $289,533 FILES CLOSED FOR INCOMPLETENESS 0 $0 4 $563,838 31 $369,264 1 $454,500 0 $0
Aggregated Statistics For Year 2008(Based on 1 full and 2 partial tracts) A) FHA, FSA/RHS & VA B) Conventional C) Refinancings D) Home Improvement Loans F) Non-occupant Loans on G) Loans On Manufactured Number Average Value Number Average Value Number Average Value Number Average Value Number Average Value Number Average Value
LOANS ORIGINATED 19 $331,017 200 $446,204 285 $432,843 14 $93,780 20 $517,023 0 $0 APPLICATIONS APPROVED, NOT ACCEPTED 1 $226,400 28 $531,357 53 $458,932 3 $68,640 1 $357,320 1 $39,000 APPLICATIONS DENIED 6 $297,093 27 $556,593 115 $516,072 8 $145,068 8 $421,808 0 $0 APPLICATIONS WITHDRAWN 3 $285,847 27 $472,502 71 $430,271 6 $187,955 4 $649,035 0 $0 FILES CLOSED FOR INCOMPLETENESS 1 $217,270 5 $631,878 17 $455,464 1 $44,490 0 $0 0 $0
Aggregated Statistics For Year 2007(Based on 1 full and 2 partial tracts) A) FHA, FSA/RHS & VA B) Conventional C) Refinancings D) Home Improvement Loans E) Loans on Dwellings For 5+ Families F) Non-occupant Loans on Number Average Value Number Average Value Number Average Value Number Average Value Number Average Value Number Average Value
LOANS ORIGINATED 3 $377,577 369 $479,610 316 $431,911 41 $143,318 0 $0 53 $451,746 APPLICATIONS APPROVED, NOT ACCEPTED 0 $0 65 $465,518 54 $398,340 10 $121,216 0 $0 11 $597,085 APPLICATIONS DENIED 1 $85,000 72 $598,800 145 $481,500 15 $435,023 0 $0 21 $707,773 APPLICATIONS WITHDRAWN 0 $0 39 $401,391 73 $493,536 3 $276,627 1 $1,256,000 10 $496,529 FILES CLOSED FOR INCOMPLETENESS 0 $0 6 $758,380 23 $440,097 0 $0 0 $0 3 $540,227
Aggregated Statistics For Year 2006(Based on 1 full and 2 partial tracts) A) FHA, FSA/RHS & VA B) Conventional C) Refinancings D) Home Improvement Loans F) Non-occupant Loans on Number Average Value Number Average Value Number Average Value Number Average Value Number Average Value
LOANS ORIGINATED 6 $214,962 483 $425,462 371 $391,707 39 $116,765 37 $396,652 APPLICATIONS APPROVED, NOT ACCEPTED 0 $0 59 $418,856 61 $358,284 7 $62,647 8 $430,281 APPLICATIONS DENIED 0 $0 66 $436,712 167 $460,856 14 $200,408 12 $416,647 APPLICATIONS WITHDRAWN 1 $110,160 68 $388,193 106 $407,767 5 $104,586 13 $628,709 FILES CLOSED FOR INCOMPLETENESS 0 $0 12 $548,998 22 $317,338 0 $0 1 $234,000
Aggregated Statistics For Year 2005(Based on 1 full and 2 partial tracts) A) FHA, FSA/RHS & VA B) Conventional C) Refinancings D) Home Improvement Loans F) Non-occupant Loans on Number Average Value Number Average Value Number Average Value Number Average Value Number Average Value
LOANS ORIGINATED 3 $162,470 518 $397,196 453 $409,375 35 $124,086 45 $325,467 APPLICATIONS APPROVED, NOT ACCEPTED 0 $0 62 $396,402 61 $392,654 7 $109,143 8 $611,810 APPLICATIONS DENIED 0 $0 71 $526,240 154 $427,659 12 $120,428 4 $449,502 APPLICATIONS WITHDRAWN 1 $221,000 67 $419,377 111 $432,136 8 $303,250 10 $538,712 FILES CLOSED FOR INCOMPLETENESS 0 $0 14 $367,246 34 $484,320 1 $30,000 2 $447,090
Aggregated Statistics For Year 2004(Based on 1 full and 2 partial tracts) A) FHA, FSA/RHS & VA B) Conventional C) Refinancings D) Home Improvement Loans F) Non-occupant Loans on Number Average Value Number Average Value Number Average Value Number Average Value Number Average Value
LOANS ORIGINATED 6 $182,885 548 $347,275 563 $394,165 28 $131,268 30 $268,071 APPLICATIONS APPROVED, NOT ACCEPTED 1 $322,370 42 $420,140 69 $355,326 5 $57,984 2 $301,000 APPLICATIONS DENIED 2 $209,500 56 $427,943 143 $494,455 15 $148,573 8 $217,730 APPLICATIONS WITHDRAWN 1 $171,000 64 $300,898 102 $381,484 4 $254,718 2 $322,435 FILES CLOSED FOR INCOMPLETENESS 0 $0 12 $235,777 20 $420,002 1 $128,120 1 $1,876,060
Aggregated Statistics For Year 2003(Based on 1 full and 2 partial tracts) A) FHA, FSA/RHS & VA B) Conventional C) Refinancings D) Home Improvement Loans F) Non-occupant Loans on Number Average Value Number Average Value Number Average Value Number Average Value Number Average Value
LOANS ORIGINATED 7 $168,333 458 $315,861 1,335 $332,724 19 $98,206 33 $239,863 APPLICATIONS APPROVED, NOT ACCEPTED 1 $182,870 45 $458,352 130 $327,459 12 $55,347 5 $306,622 APPLICATIONS DENIED 0 $0 27 $571,835 166 $437,506 10 $108,745 6 $690,027 APPLICATIONS WITHDRAWN 1 $179,380 57 $321,231 127 $365,442 5 $310,258 1 $147,770 FILES CLOSED FOR INCOMPLETENESS 0 $0 10 $365,456 36 $408,137 1 $20,000 1 $1,051,950
Aggregated Statistics For Year 1999(Based on 1 partial tract) A) FHA, FSA/RHS & VA B) Conventional C) Refinancings D) Home Improvement Loans F) Non-occupant Loans on Number Average Value Number Average Value Number Average Value Number Average Value Number Average Value
LOANS ORIGINATED 121 $173,007 649 $219,259 251 $204,676 78 $33,177 14 $170,529 APPLICATIONS APPROVED, NOT ACCEPTED 3 $135,970 47 $230,309 44 $198,909 12 $27,828 3 $250,803 APPLICATIONS DENIED 7 $156,881 57 $196,815 77 $169,426 21 $33,131 2 $148,790 APPLICATIONS WITHDRAWN 12 $179,013 87 $201,254 47 $208,184 3 $20,007 1 $134,840 FILES CLOSED FOR INCOMPLETENESS 1 $215,150 14 $189,369 10 $208,602 1 $27,050 0 $0
Detailed HMDA statistics for the following Tracts:
0141.17
, 0141.22 , 0141.23
Private Mortgage Insurance Companies Aggregated Statistics For Year 2009(Based on 1 full and 1 partial tracts) A) Conventional B) Refinancings C) Non-occupant Loans on Number Average Value Number Average Value Number Average Value
LOANS ORIGINATED 10 $352,457 7 $336,683 0 $0 APPLICATIONS APPROVED, NOT ACCEPTED 0 $0 2 $283,080 0 $0 APPLICATIONS DENIED 0 $0 2 $310,635 1 $221,130 APPLICATIONS WITHDRAWN 0 $0 1 $359,780 0 $0 FILES CLOSED FOR INCOMPLETENESS 0 $0 0 $0 0 $0
Aggregated Statistics For Year 2008(Based on 1 full and 2 partial tracts) A) Conventional B) Refinancings C) Non-occupant Loans on Number Average Value Number Average Value Number Average Value
LOANS ORIGINATED 26 $339,501 11 $306,504 1 $391,370 APPLICATIONS APPROVED, NOT ACCEPTED 4 $375,262 6 $370,733 0 $0 APPLICATIONS DENIED 2 $371,355 0 $0 0 $0 APPLICATIONS WITHDRAWN 2 $380,585 0 $0 1 $417,000 FILES CLOSED FOR INCOMPLETENESS 2 $600,020 0 $0 0 $0
Aggregated Statistics For Year 2007(Based on 1 full and 2 partial tracts) A) Conventional B) Refinancings C) Non-occupant Loans on Number Average Value Number Average Value Number Average Value
LOANS ORIGINATED 24 $324,822 11 $367,207 3 $324,787 APPLICATIONS APPROVED, NOT ACCEPTED 1 $925,130 2 $434,010 0 $0 APPLICATIONS DENIED 1 $784,000 0 $0 0 $0 APPLICATIONS WITHDRAWN 1 $150,930 0 $0 0 $0 FILES CLOSED FOR INCOMPLETENESS 0 $0 0 $0 0 $0
Aggregated Statistics For Year 2006(Based on 1 full and 2 partial tracts) A) Conventional B) Refinancings Number Average Value Number Average Value
LOANS ORIGINATED 9 $302,307 4 $320,128 APPLICATIONS APPROVED, NOT ACCEPTED 1 $197,000 3 $418,583 APPLICATIONS DENIED 0 $0 0 $0 APPLICATIONS WITHDRAWN 0 $0 1 $405,050 FILES CLOSED FOR INCOMPLETENESS 0 $0 0 $0
Aggregated Statistics For Year 2005(Based on 1 full and 2 partial tracts) A) Conventional B) Refinancings C) Non-occupant Loans on Number Average Value Number Average Value Number Average Value
LOANS ORIGINATED 5 $289,062 7 $300,549 2 $251,305 APPLICATIONS APPROVED, NOT ACCEPTED 2 $351,260 3 $326,500 0 $0 APPLICATIONS DENIED 0 $0 0 $0 0 $0 APPLICATIONS WITHDRAWN 0 $0 1 $332,330 0 $0 FILES CLOSED FOR INCOMPLETENESS 0 $0 0 $0 0 $0
Aggregated Statistics For Year 2004(Based on 1 full and 2 partial tracts) A) Conventional B) Refinancings C) Non-occupant Loans on Number Average Value Number Average Value Number Average Value
LOANS ORIGINATED 11 $321,685 11 $349,537 3 $213,503 APPLICATIONS APPROVED, NOT ACCEPTED 7 $328,373 9 $288,011 0 $0 APPLICATIONS DENIED 1 $235,000 1 $239,000 1 $239,000 APPLICATIONS WITHDRAWN 3 $386,680 1 $277,000 1 $447,000 FILES CLOSED FOR INCOMPLETENESS 0 $0 0 $0 0 $0
Aggregated Statistics For Year 2003(Based on 1 full and 2 partial tracts) A) Conventional B) Refinancings C) Non-occupant Loans on Number Average Value Number Average Value Number Average Value
LOANS ORIGINATED 51 $306,896 50 $287,720 2 $193,995 APPLICATIONS APPROVED, NOT ACCEPTED 8 $322,849 9 $307,806 0 $0 APPLICATIONS DENIED 1 $412,510 1 $292,030 0 $0 APPLICATIONS WITHDRAWN 2 $365,965 2 $294,965 1 $164,620 FILES CLOSED FOR INCOMPLETENESS 1 $556,880 0 $0 0 $0
Aggregated Statistics For Year 1999(Based on 1 partial tract) A) Conventional B) Refinancings C) Non-occupant Loans on Number Average Value Number Average Value Number Average Value
LOANS ORIGINATED 227 $201,060 34 $186,995 4 $142,978 APPLICATIONS APPROVED, NOT ACCEPTED 31 $205,446 7 $232,183 1 $325,060 APPLICATIONS DENIED 10 $227,539 1 $186,410 1 $241,360 APPLICATIONS WITHDRAWN 6 $221,353 3 $212,197 0 $0 FILES CLOSED FOR INCOMPLETENESS 0 $0 0 $0 0 $0
Detailed PMIC statistics for the following Tracts:
0141.17
, 0141.22 , 0141.23 Castle Pines compared to Colorado state average:
Median household income above state average. Median house value above state average. Unemployed percentage significantly below state average. Black race population percentage above state average. Median age significantly above state average. Foreign-born population percentage significantly above state average. Renting percentage significantly below state average. Length of stay since moving in significantly above state average. Number of rooms per house significantly above state average. House age significantly below state average. Number of college students above state average. Percentage of population with a bachelor's degree or higher above state average. Castle Pines on our top lists :
#19 on the list of "Top 101 cities with largest percentage of females in occupations: management occupations (population 5,000+)"
#33 on the list of "Top 101 cities with largest percentage of males in industries: information (population 5,000+)"
#39 on the list of "Top 101 cities with largest percentage of females in industries: information (population 5,000+)"
#49 on the list of "Top 101 cities with largest percentage of males in occupations: management occupations (population 5,000+)"
#51 on the list of "Top 101 cities with the highest percentage of workers working at home, population 5,000+"
#66 on the list of "Top 101 cities with the highest percentage of family households, population 10,000+"
#86 on the list of "Top 100 cities with biggest houses (pop. 5,000+)"
#89 on the list of "Top 100 cities with highest median household income (pop. 5,000+)"
#1 on the list of "Top 101 counties with the highest percentage of residents that exercised in the past month"
#1 on the list of "Top 101 counties with the lowest number of deaths per 1000 residents 2007-2013 (pop. 50,000+)"
#1 on the list of "Top 101 counties with the largest increase in the number of deaths per 1000 residents 2000-2006 to 2007-2013 (pop. 50,000+)"
#1 on the list of "Top 101 counties with the largest number of children under 18 without health insurance coverage in 2000 (pop. 50,000+)"
#2 on the list of "Top 101 counties with the best general health status score of residents (1-5), 3 years of data"
Top Patent Applicants
Steven Michael Casagrande (10)
Barry Mosteller (6)
Samantha A. Schwartz (5)
Sean Leach (5)
Sean A. Leach (5)
Joseph M. Wong (5)
William Kit Dean (5)
Garey Hassler (5)
Aaron Johnson (4)
Daniel J. Murphy (3)
Total of 83 patent applications in 2008-2024.


 Recent articles from our blog. Our writers, many of them Ph.D. graduates or candidates, create easy-to-read articles on a wide variety of topics.

 (6.9 miles