Charleston, WV (West Virginia) Houses and Residents
Estimated median house or condo value in 2022: $178,463 (it was $100,800 in 2000 )
Charleston:
$178,463West Virginia:
$155,100
Lower value quartile - upper value quartile: $99,447 - $313,020Mean price in 2022: Detached houses: $292,846 Here:
$292,846State:
$206,655
Townhouses or other attached units: $296,066 Here:
$296,066State:
$205,683
In 2-unit structures: $288,840 Here:
$288,840State:
$127,101
In 3-to-4-unit structures: $282,062 Here:
$282,062State:
$136,692
In 5-or-more-unit structures: $325,415 Here:
$325,415State:
$177,533
Mobile homes: $107,370 Here:
$107,370State:
$63,963
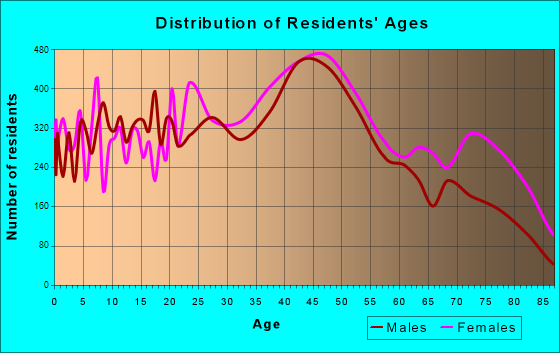
Total population: 50,404 (All urban)
Houses: 25,731 (21,726 occupied: 13,387 owner occupied, 8,638 renter occupied )
% of renters here:
39%State:
26%
Housing density: 814 houses/condos per square mile
Median price asked for vacant for-sale houses and condos in 2022: $153,089.
Median contract rent in 2022: $614 (lower quartile is $405, upper quartile is $799)
Median rent asked for vacant for-rent units in 2022: $763
Median gross rent in Charleston, WV in 2022: $838
Housing units in Charleston with a mortgage: 7,281 (653 second mortgage, 0 home equity loan, 526 both second mortgage and home equity loan )Houses without a mortgage: 456
Median household income for houses/condos with a mortgage: $105,977
Median household income for apartments without a mortgage: $62,030
Median monthly housing costs: $872
Data:
Median house or condo value ($)
Median house or condo value ($ change since 2000)
Median house or condo value ($) - White
Median house or condo value ($) - Black or African American
Median house or condo value ($) - Asian
Median house or condo value ($) - Hispanic or Latino
Median house or condo value ($) - American Indian and Alaska Native
Median house or condo value ($) - Multirace
Median house or condo value ($) - Other Race
Median price asked for mobile homes ($)
Household density (households per square mile)
Mean house or condo value by units in structure - 1, detached ($)
Mean house or condo value by units in structure - 1, attached ($)
Mean house or condo value by units in structure - 2 ($)
Mean house or condo value by units in structure by units in structure - 3 or 4 ($)
Mean house or condo value by units in structure - 5 or more ($)
Mean house or condo value by units in structure - Boat, RV, van, etc. ($)
Mean house or condo value by units in structure - Mobile home ($)
Median contract rent ($)
Median contract rent - Lower quartile ($)
Median contract rent - Upper quartile ($)
Median gross rent ($)
Urban houses (%)
Rural houses (%)
Houses occupied (%)
Houses occupied (% change since 2000)
Houses owner occupied (%)
Houses owner occupied (% change since 2000)
Houses renter occupied (%)
Houses renter occupied (% change since 2000)
Vacant housing units - For rent (%)
Vacant housing units - For rent (% change since 2000)
Vacant housing units - For sale only (%)
Vacant housing units - For sale only (% change since 2000)
Vacant housing units - Rented or sold, not occupied (%)
Vacant housing units - Rented or sold, not occupied (% change since 2000)
Vacant housing units - For seasonal, recreational, or occasional use (%)
Vacant housing units - For seasonal, recreational, or occasional use (% change since 2000)
Vacant housing units - For migrant workers (%)
Vacant housing units - For migrant workers (% change since 2000)
Vacant housing units - Other vacant (%)
Vacant housing units - Other vacant (% change since 2000)
Median monthly housing costs ($)
Median household income for houses/condos with a mortgage ($)
Median household income for houses/condos without a mortgage ($)
Median household income ($)
Median household income ($) - White
Median household income ($) - Black or African American
Median household income ($) - Asian
Median household income ($) - Hispanic or Latino
Median household income ($) - American Indian and Alaska Native
Median household income ($) - Multirace
Median household income ($) - Other Race
Mortgage status - with mortgage (%)
Mortgage status - with second mortgage (%)
Mortgage status - with home equity loan (%)
Mortgage status - with both second mortgage and home equity loan (%)
Mortgage status - without a mortgage (%)
Median year house/condo built
Median year apartment built
Household type by relationship - Male householder living alone (%)
Household type by relationship - Male householder not living alone (%)
Household type by relationship - Female householder living alone (%)
Household type by relationship - Female householder not living alone (%)
Household type by relationship - Opposite-Sex spouse (%)
Household type by relationship - Same-Sex spouse (%)
Household type by relationship - Opposite-Sex unmarried partner (%)
Household type by relationship - Same-Sex unmarried partner (%)
Household type by relationship - In group quarters (%)
Size of family households - 2-person household (%)
Size of family households - 3-person household (%)
Size of family households - 4-person household (%)
Size of family households - 5-person household (%)
Size of family households - 6-person household (%)
Size of family households - 7-or-more-person household (%)
Size of nonfamily households - 1-person household (%)
Size of nonfamily households - 2-person household (%)
Size of nonfamily households - 3-person household (%)
Size of nonfamily households - 4-person household (%)
Size of nonfamily households - 5-person household (%)
Size of nonfamily households - 6-person household (%)
Size of nonfamily households - 7-or-moreperson household (%)
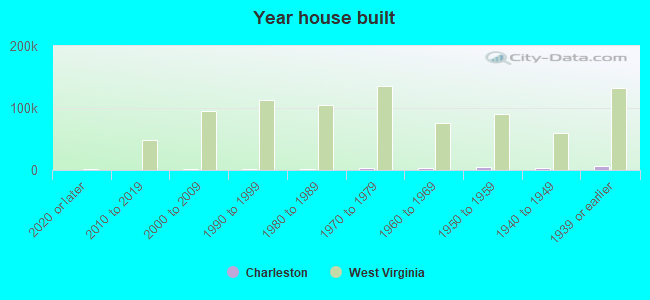
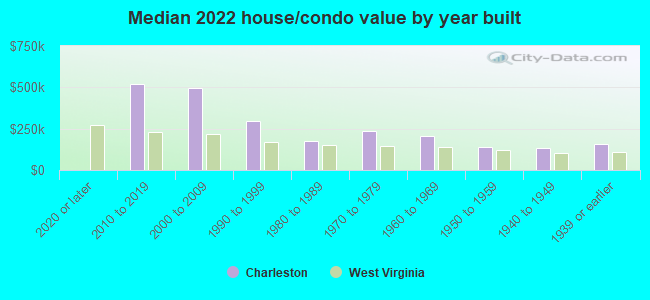
Year house built - Built 2010 or later (%)
Year house built - Built 2000 to 2009 (%)
Year house built - Built 1990 to 1999 (%)
Year house built - Built 1980 to 1989 (%)
Year house built - Built 1970 to 1979 (%)
Year house built - Built 1960 to 1969 (%)
Year house built - Built 1950 to 1959 (%)
Year house built - Built 1940 to 1949 (%)
Year house built - Built 1939 or earlier (%)
Median number of rooms in houses and condos
Median number of rooms in apartments
Median number of bedrooms in owner occupied houses
Mean number of bedrooms in owner occupied houses
Median number of bedrooms in renter occupied houses
Mean number of bedrooms in renter occupied houses
Median number of vehichles in owner occupied houses
Mean number of vehichles in owner occupied houses
Median number of vehichles in renter occupied houses
Mean number of vehichles in renter occupied houses
Rooms in owner-occupied houses - 1 room (%)
Rooms in owner-occupied houses - 2 rooms (%)
Rooms in owner-occupied houses - 3 rooms (%)
Rooms in owner-occupied houses - 4 rooms (%)
Rooms in owner-occupied houses - 5 rooms (%)
Rooms in owner-occupied houses - 6 rooms (%)
Rooms in owner-occupied houses - 7 rooms (%)
Rooms in owner-occupied houses - 8 rooms (%)
Rooms in owner-occupied houses - 9+ rooms (%)
Rooms in renter-occupied houses - 1 room (%)
Rooms in renter-occupied houses - 2 rooms (%)
Rooms in renter-occupied houses - 3 rooms (%)
Rooms in renter-occupied houses - 4 rooms (%)
Rooms in renter-occupied houses - 5 rooms (%)
Rooms in renter-occupied houses - 6 rooms (%)
Rooms in renter-occupied houses - 7 rooms (%)
Rooms in renter-occupied houses - 8 rooms (%)
Rooms in renter-occupied houses - 9+ rooms (%)
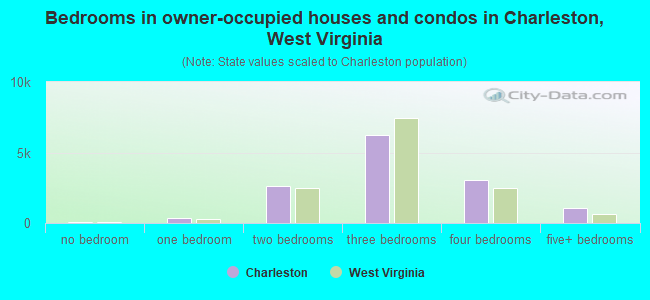
Bedrooms in owner-occupied houses - no bedrooms (%)
Bedrooms in owner-occupied houses - 1 bedroom (%)
Bedrooms in owner-occupied houses - 2 bedrooms (%)
Bedrooms in owner-occupied houses - 3 bedrooms (%)
Bedrooms in owner-occupied houses - 4 bedrooms (%)
Bedrooms in owner-occupied houses - 5+ bedrooms (%)
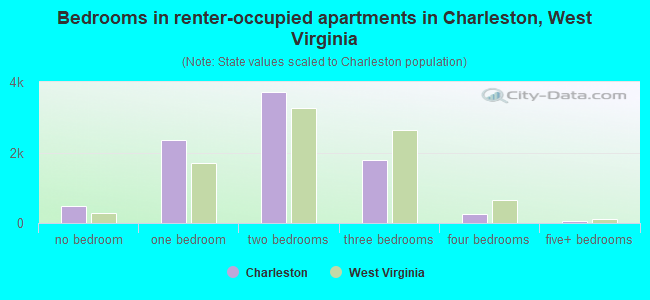
Bedrooms in renter-occupied houses - no bedrooms (%)
Bedrooms in renter-occupied houses - 1 bedroom (%)
Bedrooms in renter-occupied houses - 2 bedrooms (%)
Bedrooms in renter-occupied houses - 3 bedrooms (%)
Bedrooms in renter-occupied houses - 4 bedrooms (%)
Bedrooms in renter-occupied houses - 5+ bedrooms (%)
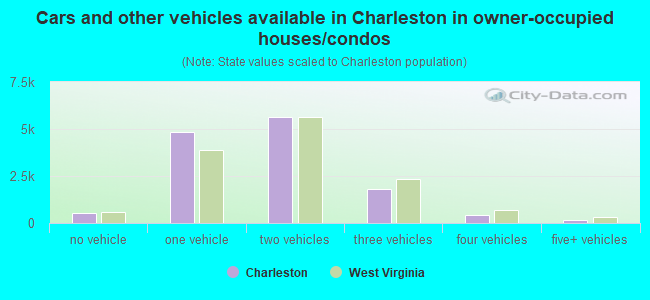
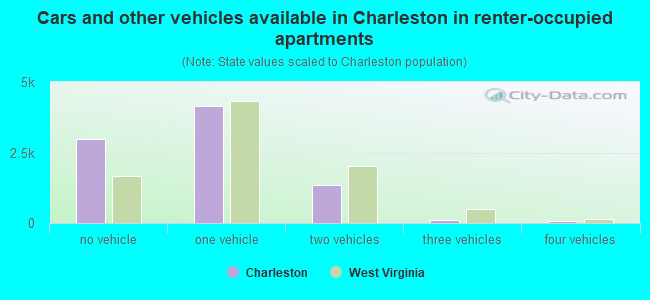
Vehicles available in owner-occupied houses - no vehicle available (%)
Vehicles available in owner-occupied houses - 1 vehicle available(%)
Vehicles available in owner-occupied houses - 2 Vehicles available (%)
Vehicles available in owner-occupied houses - 3 Vehicles available (%)
Vehicles available in owner-occupied houses - 4 Vehicles available (%)
Vehicles available in owner-occupied houses - 5+ Vehicles available (%)
Vehicles available in renter-occupied houses - no vehicle available (%)
Vehicles available in renter-occupied houses - 1 vehicle available (%)
Vehicles available in renter-occupied houses - 2 Vehicles available (%)
Vehicles available in renter-occupied houses - 3 Vehicles available (%)
Vehicles available in renter-occupied houses - 4 Vehicles available (%)
Vehicles available in renter-occupied houses - 5+ Vehicles available (%)
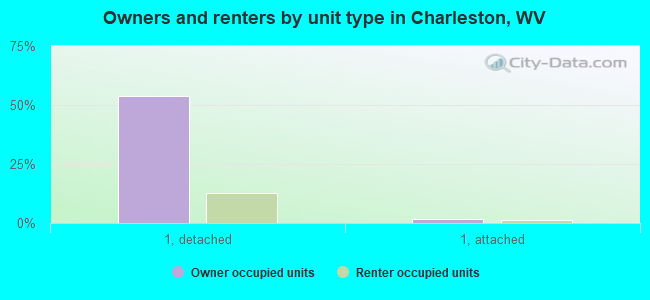
Housing units in structures - 1, detached (%)
Housing units in structures - 1, attached (%)
Housing units in structures - 2 (%)
Housing units in structures - 3 or 4 (%)
Housing units in structures - 5 to 9 (%)
Housing units in structures - 10 to 19 (%)
Housing units in structures - 20 to 49 (%)
Housing units in structures - 50 or more (%)
Housing units in structures - Mobile home (%)
Housing units in structures - Boat, RV, van, etc. (%)
Housing units in structures - Owners - 1, detached (%)
Housing units in structures - Owners - 1, attached (%)
Housing units in structures - Owners - 2 (%)
Housing units in structures - Owners - 3 or 4 (%)
Housing units in structures - Owners - 5 to 9 (%)
Housing units in structures - Owners - 10 to 19 (%)
Housing units in structures - Owners - 20 to 49 (%)
Housing units in structures - Owners - 50 or more (%)
Housing units in structures - Owners - Mobile home (%)
Housing units in structures - Owners - Boat, RV, van, etc. (%)
Housing units in structures - Renters - 1, detached (%)
Housing units in structures - Renters - 1, attached (%)
Housing units in structures - Renters - 2 (%)
Housing units in structures - Renters - 3 or 4 (%)
Housing units in structures - Renters - 5 to 9 (%)
Housing units in structures - Renters - 10 to 19 (%)
Housing units in structures - Renters - 20 to 49 (%)
Housing units in structures - Renters - 50 or more (%)
Housing units in structures - Renters - Mobile home (%)
Housing units in structures - Renters - Boat, RV, van, etc. (%)
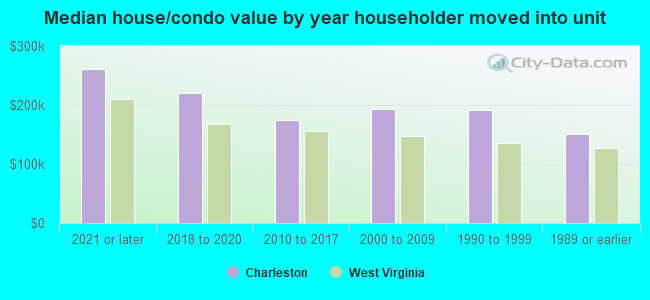
House/condo owner moved in on average (years ago)
Renter moved in on average (years ago)
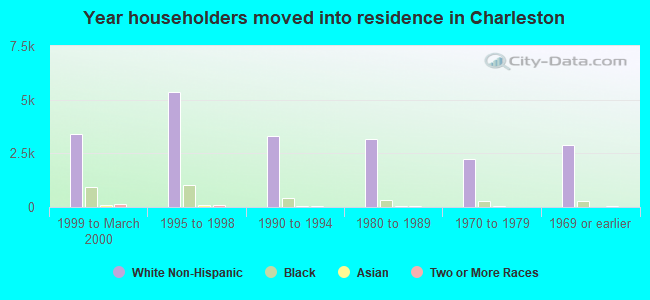
Year householder moved into unit - Moved in 1999 to March 2000 (%)
Year householder moved into unit - Moved in 1999 to March 2000 (%) - White
Year householder moved into unit - Moved in 1999 to March 2000 (%) - Black or African American
Year householder moved into unit - Moved in 1999 to March 2000 (%) - Asian
Year householder moved into unit - Moved in 1999 to March 2000 (%) - Hispanic or Latino
Year householder moved into unit - Moved in 1999 to March 2000 (%) - American Indian and Alaska Native
Year householder moved into unit - Moved in 1999 to March 2000 (%) - Multirace
Year householder moved into unit - Moved in 1999 to March 2000 (%) - Other Race
Year householder moved into unit - Moved in 1995 to 1998 (%)
Year householder moved into unit - Moved in 1995 to 1998 (%) - White
Year householder moved into unit - Moved in 1995 to 1998 (%) - Black or African American
Year householder moved into unit - Moved in 1995 to 1998 (%) - Asian
Year householder moved into unit - Moved in 1995 to 1998 (%) - Hispanic or Latino
Year householder moved into unit - Moved in 1995 to 1998 (%) - American Indian and Alaska Native
Year householder moved into unit - Moved in 1995 to 1998 (%) - Multirace
Year householder moved into unit - Moved in 1995 to 1998 (%) - Other Race
Year householder moved into unit - Moved in 1990 to 1994 (%)
Year householder moved into unit - Moved in 1990 to 1994 (%) - White
Year householder moved into unit - Moved in 1990 to 1994 (%) - Black or African American
Year householder moved into unit - Moved in 1990 to 1994 (%) - Asian
Year householder moved into unit - Moved in 1990 to 1994 (%) - Hispanic or Latino
Year householder moved into unit - Moved in 1990 to 1994 (%) - American Indian and Alaska Native
Year householder moved into unit - Moved in 1990 to 1994 (%) - Multirace
Year householder moved into unit - Moved in 1990 to 1994 (%) - Other Race
Year householder moved into unit - Moved in 1980 to 1989 (%)
Year householder moved into unit - Moved in 1980 to 1989 (%) - White
Year householder moved into unit - Moved in 1980 to 1989 (%) - Black or African American
Year householder moved into unit - Moved in 1980 to 1989 (%) - Asian
Year householder moved into unit - Moved in 1980 to 1989 (%) - Hispanic or Latino
Year householder moved into unit - Moved in 1980 to 1989 (%) - American Indian and Alaska Native
Year householder moved into unit - Moved in 1980 to 1989 (%) - Multirace
Year householder moved into unit - Moved in 1980 to 1989 (%) - Other Race
Year householder moved into unit - Moved in 1970 to 1979 (%)
Year householder moved into unit - Moved in 1970 to 1979 (%) - White
Year householder moved into unit - Moved in 1970 to 1979 (%) - Black or African American
Year householder moved into unit - Moved in 1970 to 1979 (%) - Asian
Year householder moved into unit - Moved in 1970 to 1979 (%) - Hispanic or Latino
Year householder moved into unit - Moved in 1970 to 1979 (%) - American Indian and Alaska Native
Year householder moved into unit - Moved in 1970 to 1979 (%) - Multirace
Year householder moved into unit - Moved in 1970 to 1979 (%) - Other Race
Year householder moved into unit - Moved in 1969 or earlier (%)
Year householder moved into unit - Moved in 1969 or earlier (%) - White
Year householder moved into unit - Moved in 1969 or earlier (%) - Black or African American
Year householder moved into unit - Moved in 1969 or earlier (%) - Asian
Year householder moved into unit - Moved in 1969 or earlier (%) - Hispanic or Latino
Year householder moved into unit - Moved in 1969 or earlier (%) - American Indian and Alaska Native
Year householder moved into unit - Moved in 1969 or earlier (%) - Multirace
Year householder moved into unit - Moved in 1969 or earlier (%) - Other Race
Housing units lacking complete plumbing facilities (%)
Housing units lacking complete kitchen facilities (%)
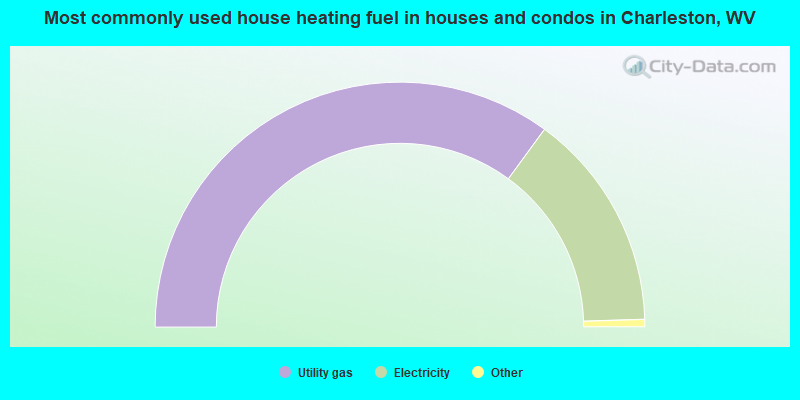
House heating fuel used in houses and condos - Utility gas (%)
House heating fuel used in houses and condos - Bottled, tank, or LP gas (%)
House heating fuel used in houses and condos - Electricity (%)
House heating fuel used in houses and condos - Fuel oil, kerosene, etc. (%)
House heating fuel used in houses and condos - Coal or coke (%)
House heating fuel used in houses and condos - Wood (%)
House heating fuel used in houses and condos - Solar energy (%)
House heating fuel used in houses and condos - Other fuel (%)
House heating fuel used in houses and condos - No fuel used (%)
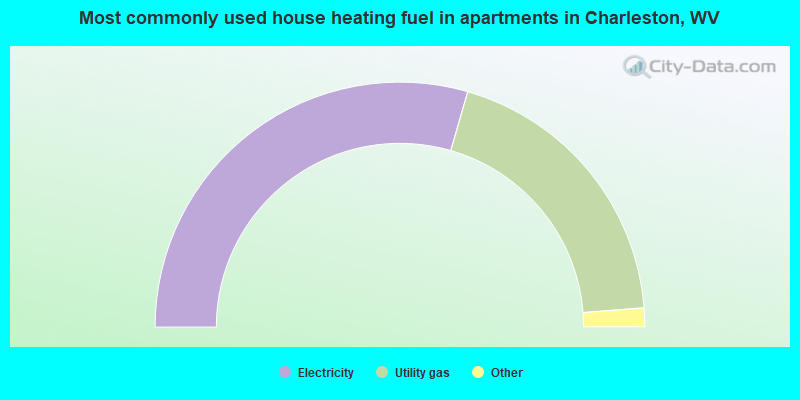
House heating fuel used in apartments - Utility gas (%)
House heating fuel used in apartments - Bottled, tank, or LP gas (%)
House heating fuel used in apartments - Electricity (%)
House heating fuel used in apartments - Fuel oil, kerosene, etc. (%)
House heating fuel used in apartments - Coal or coke (%)
House heating fuel used in apartments - Wood (%)
House heating fuel used in apartments - Solar energy (%)
House heating fuel used in apartments - Other fuel (%)
House heating fuel used in apartments - No fuel used (%)
Latest news about housing in Charleston, WV collected exclusively by city-data.com from local newspapers, TV, and radio stations
Median year house/condo built: 1956Median year apartment built: 1957Household type by relationship:
Households: 47,236
Male householders: 10,169 (4,167 living alone ), Female householders: 11,047 (4,449 living alone )8,114 spouses (8,052 opposite-sex spouses ), 1,527 unmarried partners , (1,420 opposite-sex unmarried partners ), 11,147 children (9,858 natural , 260 adopted , 1,028 stepchildren ), 750 grandchildren , 407 brothers or sisters , 371 parents , 50 foster children , 555 other relatives , 932 non-relatives In group quarters: 2,161
Size of family households: 6,530 2-persons , 2,884 3-persons , 1,418 4-persons , 386 5-persons , 161 6-persons , 98 7-or-more-persons .
Size of nonfamily households: 9,165 1-person , 1,365 2-persons , 11 3-persons , 45 4-persons .
4,344 married couples with children. single-parent households (412 men , 3,292 women ).
95.1% of residents of Charleston speak English at home. of residents speak Spanish at home (56% speak English very well , 30% speak English well , 4% speak English not well , 10% don't speak English at all ).of residents speak other Indo-European language at home (68% speak English very well , 24% speak English well , 9% speak English not well ).of residents speak Asian or Pacific Island language at home (69% speak English very well , 21% speak English well , 6% speak English not well , 4% don't speak English at all ).of residents speak other language at home (66% speak English very well , 16% speak English well , 18% speak English not well ).
Foreign born population: 2,121 (4.5%)of them are naturalized citizens )
Median number of rooms in houses and condos:
Median number of rooms in apartments
Owner-occupied Renter-occupied
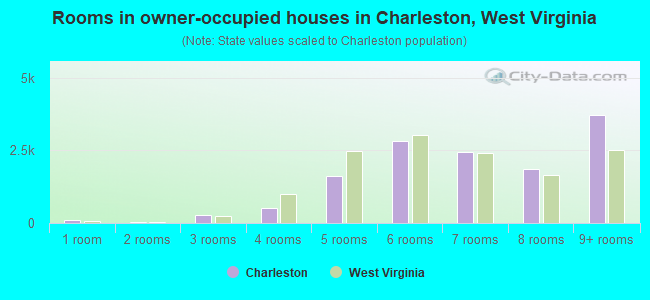
Rooms in owner-occupied houses in Charleston, West Virginia
106 1 room 25 2 rooms 274 3 rooms 526 4 rooms 1,629 5 rooms 2,808 6 rooms 2,444 7 rooms 1,863 8 rooms 3,712 9+ rooms
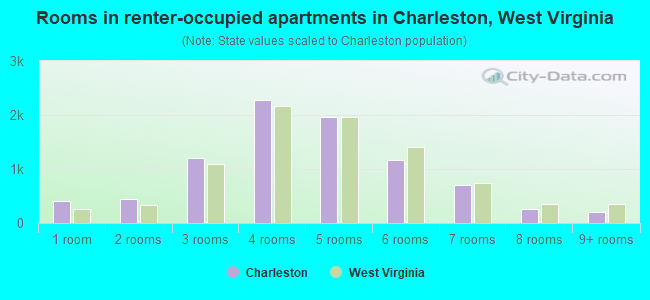
Rooms in renter-occupied apartments in Charleston, West Virginia
400 1 room 448 2 rooms 1,207 3 rooms 2,283 4 rooms 1,971 5 rooms 1,166 6 rooms 699 7 rooms 267 8 rooms 198 9+ rooms
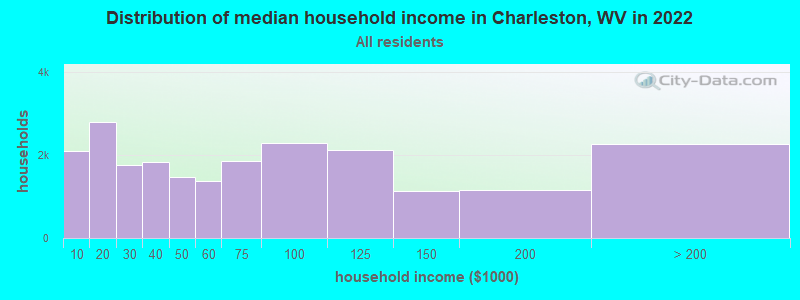
Charleston, WV household income distribution 2,099 Less than $10,0002,793 $10,000 to $19,9991,756 $20,000 to $29,9991,822 $30,000 to $39,9991,457 $40,000 to $49,9991,382 $50,000 to $59,9991,860 $60,000 to $74,9992,294 $75,000 to $99,9992,115 $100,000 to $124,9991,129 $125,000 to $149,9991,160 $150,000 to $199,9992,258 $200,000 or more
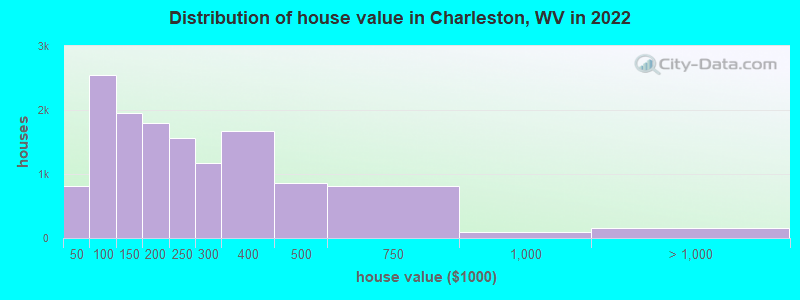
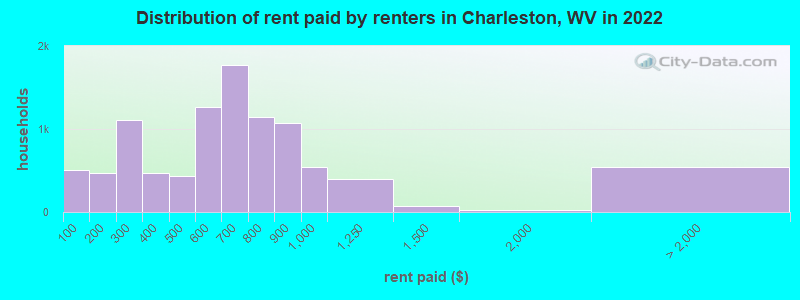
Home value of owner - occupied houses in 2022 in Charleston, WV 95 Less than $10,00055 $10,000 to $14,99966 $15,000 to $19,99954 $20,000 to $24,999118 $25,000 to $29,999186 $30,000 to $34,99958 $35,000 to $39,999174 $40,000 to $49,999365 $50,000 to $59,999532 $60,000 to $69,999540 $70,000 to $79,999440 $80,000 to $89,999496 $90,000 to $99,999909 $100,000 to $124,9991,048 $125,000 to $149,999970 $150,000 to $174,999825 $175,000 to $199,9991,565 $200,000 to $249,9991,172 $250,000 to $299,9991,675 $300,000 to $399,999863 $400,000 to $499,999805 $500,000 to $749,99992 $750,000 to $999,99996 $1,000,000 to $1,499,99947 $1,500,000 to $1,999,99916 $2,000,000 or moreRent paid by renters in 2022 in Charleston, WV 511 Less than $100128 $100 to $149344 $150 to $199479 $200 to $249634 $250 to $299220 $300 to $349245 $350 to $399149 $400 to $449280 $450 to $499652 $500 to $549610 $550 to $5991,214 $600 to $649560 $650 to $699376 $700 to $749763 $750 to $7991,073 $800 to $899538 $900 to $999397 $1,000 to $1,24977 $1,250 to $1,49923 $1,500 to $1,99984 $2,000 to $2,49950 $3,500 or more411 No cash rent
Percentage of workers working in this county: 92.7%Number of people working at home: 2,368 (10.9% of all workers )
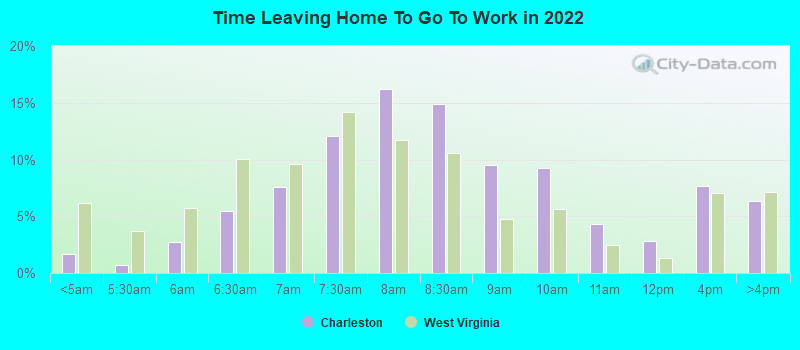
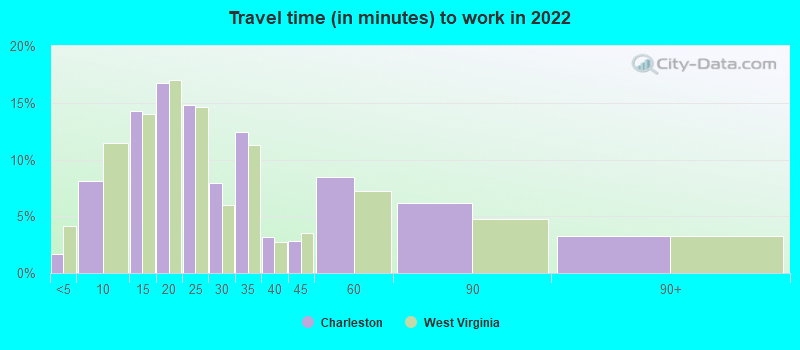
Travel time to work (commute)
Less than 5 minutes: 6645 to 9 minutes: 3,18010 to 14 minutes: 5,43615 to 19 minutes: 3,84320 to 24 minutes: 2,18325 to 29 minutes: 38830 to 34 minutes: 1,17135 to 39 minutes: 15240 to 44 minutes: 36045 to 59 minutes: 39460 to 89 minutes: 59690 or more minutes: 353
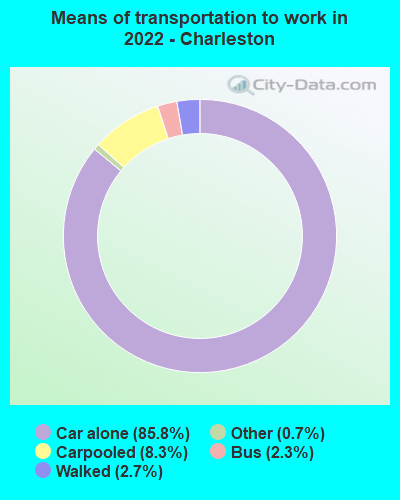
Means of transportation to work:
Drove a car alone: 41,309 (82.1%)Carpooled: 3,492 (6.9%)Bus : 613 (1.2%)Ferryboat: 32 (0.1%)Taxi: 457 (0.9%)Bicycle: 9 (0.0%)Walked: 1,094 (2.2%)Worked at home: 2,570 (5.1%)
Unemployment by race in 2022
Unemployment rate for White non-Hispanic residents 4.3% Males5.1% FemalesUnemployment rate for Black residents 8.8% Males6.5% FemalesUnemployment rate for American Indian and Alaska Native residents 35.0% MalesUnemployment rate for two or more race residents 6.5% Males13.2% FemalesUnemployment rate for Hispanic or Latino residents 4.4% Males16.3% Females
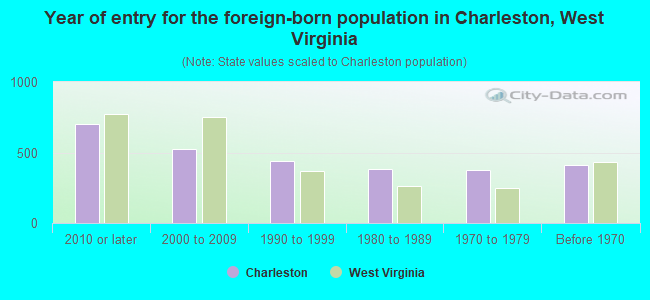
Year of entry for the foreign-born population in Charleston, West Virginia
699 2010 or later 524 2000 to 2009 442 1990 to 1999 380 1980 to 1989 379 1970 to 1979 414 Before 1970
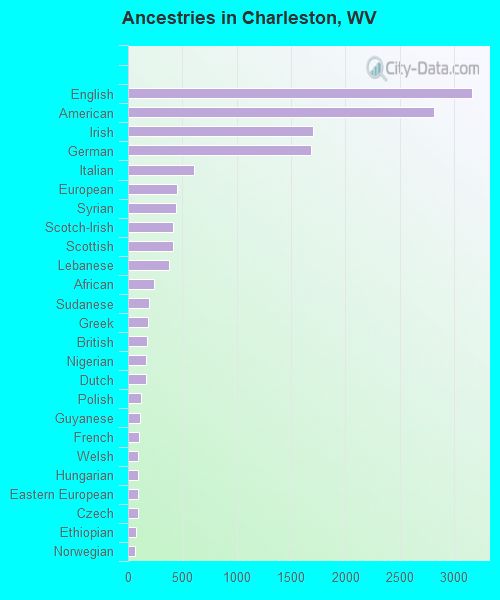
First ancestries reported:
English: 3,164 (14.7%)
American: 2,818 (13.1%)
Irish: 1,704 (7.9%)
German: 1,682 (7.8%)
Italian: 611 (2.8%)
European: 448 (2.1%)
Syrian: 438 (2.0%)
Scotch-Irish: 414 (1.9%)
Scottish: 410 (1.9%)
Lebanese: 381 (1.8%)
African: 242 (1.1%)
Sudanese: 189 (0.9%)
Greek: 181 (0.8%)
British: 175 (0.8%)
Nigerian: 167 (0.8%)
Dutch: 165 (0.8%)
Polish: 120 (0.6%)
Guyanese: 113 (0.5%)
French: 103 (0.5%)
Welsh: 95 (0.4%)
Hungarian: 94 (0.4%)
Eastern European: 94 (0.4%)
Czech: 88 (0.4%)
Ethiopian: 77 (0.4%)
Norwegian: 69 (0.3%)
Scandinavian: 62 (0.3%)
Northern European: 43 (0.2%)
Iranian: 38 (0.2%)
Romanian: 38 (0.2%)
French Canadian: 36 (0.2%)
Cypriot: 33 (0.2%)
Portuguese: 31 (0.1%)
Jordanian: 26 (0.1%)
Brazilian: 23 (0.1%)
Egyptian: 19 (0.09%)
Swiss: 18 (0.08%)
Armenian: 17 (0.08%)
Jamaican: 17 (0.08%)
Russian: 15 (0.07%)
Estonian: 15 (0.07%)
Ghanaian: 13 (0.06%)
Canadian: 12 (0.06%)
Haitian: 12 (0.06%)
Swedish: 11 (0.05%)
Ukrainian: 11 (0.05%)
Cajun: 9 (0.04%)
Pennsylvania German: 9 (0.04%)
Bulgarian: 6 (0.03%)
Most common places of birth for foreign-born residents (%): India Charleston:
21.3% (460)West Virginia:
7.2% (2,098)
Canada Charleston:
8.3% (180)West Virginia:
4.3% (1,233)
Syria Charleston:
6.4% (138)West Virginia:
1.3% (368)
England Charleston:
6.2% (133)West Virginia:
2.3% (665)
Belarus Charleston:
4.9% (106)West Virginia:
0.4% (106)
Nigeria Charleston:
4.6% (100)West Virginia:
2.4% (705)
Philippines Charleston:
4.5% (97)West Virginia:
6.2% (1,798)
Germany Charleston:
4.4% (95)West Virginia:
5.5% (1,585)
Sudan Charleston:
4.0% (87)West Virginia:
0.3% (86)
Guatemala Charleston:
2.9% (62)West Virginia:
2.6% (758)
Bangladesh Charleston:
2.3% (49)West Virginia:
0.6% (183)
Sri Lanka Charleston:
1.9% (40)West Virginia:
0.4% (124)
Mexico Charleston:
1.8% (39)West Virginia:
7.4% (2,143)
Ethiopia Charleston:
1.8% (38)West Virginia:
0.6% (178)
Netherlands Charleston:
1.7% (36)West Virginia:
0.5% (133)
Japan Charleston:
1.6% (34)West Virginia:
2.2% (642)
Iran Charleston:
1.5% (33)West Virginia:
0.7% (196)
Place of birth for U.S.-born residents:
This state: 33,290Other state: 11,686Northeast: 2,451Midwest: 2,791South: 5,528West: 926 86.9% of Charleston residents lived in the same house 1 years ago.
Out of people who lived in different houses, 37.5% lived in this county.
Out of people who lived in different counties, 47.1% lived in West Virginia.
Charleston:
86.9%State average:
89.6%
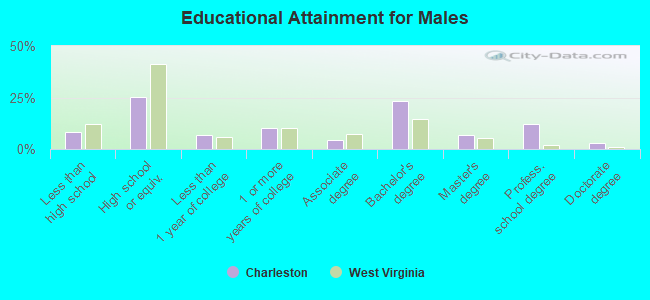
Education attainment for males 25 years and older:
No schooling: 170Nursery to 4th grade: 175th and 6th grade: 467th and 8th grade: 1759th grade: 20710th grade: 20911th grade: 32912th grade, no diploma: 244High school graduate (or equivalency): 4,263Less than 1 year of college: 1,141Some college more than 1 year, no degree: 1,707Associate degree: 776Bachelor's degree: 3,928Master's degree: 1,162Professional school degree: 2,025Doctorate degree: 466
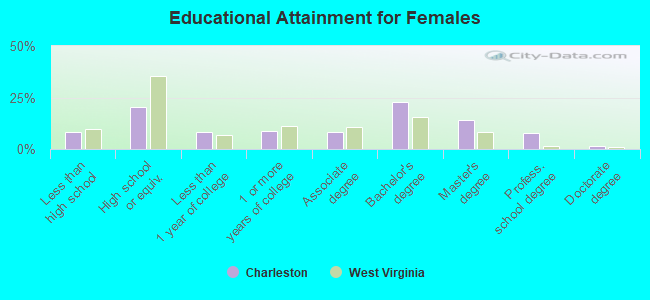
Education attainment for females 25 years and older:
No schooling: 314Nursery to 4th grade: 295th and 6th grade: 197th and 8th grade: 1909th grade: 37410th grade: 17311th grade: 32012th grade, no diploma: 118High school graduate (or equivalency): 3,768Less than 1 year of college: 1,511Some college more than 1 year, no degree: 1,611Associate degree: 1,500Bachelor's degree: 4,215Master's degree: 2,632Professional school degree: 1,467Doctorate degree: 289
Housing units in structures:
One, detached: 17,005One, attached: 809Two: 8443 or 4: 2,7055 to 9: 93610 to 19: 50820 to 49: 71750 or more: 1,972Mobile homes: 209Boats, RVs, vans, etc.: 21Housing units lacking complete plumbing facilities in 2022: 5.9%Housing units lacking complete kitchen facilities in 2022: 6.2%House/condo owner moved in on average 12 years ago
Renter moved in on average 2 years ago
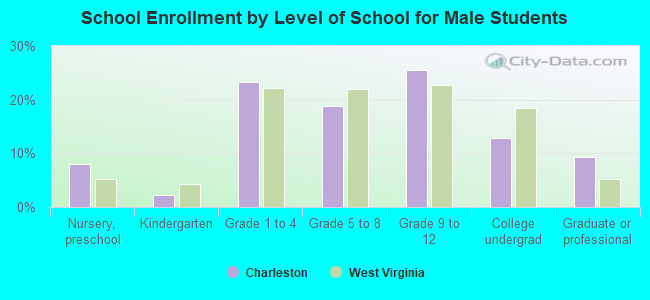
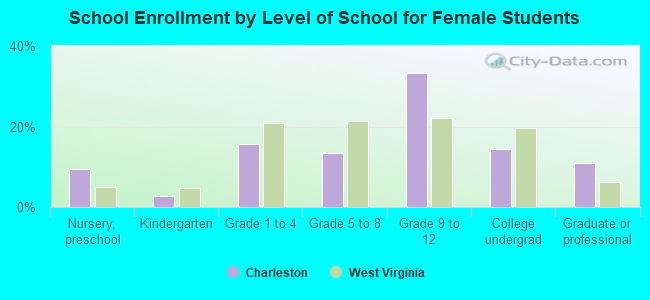
Private vs. public school enrollment:
Students in private schools in grades 1 to 8 (elementary and middle school): 664 Here:
18.5%West Virginia:
12.2%
Students in private schools in grades 9 to 12 (high school): 130 Here:
4.4%West Virginia:
8.8%
Students in private undergraduate colleges: 809 Here:
54.4%West Virginia:
17.3%