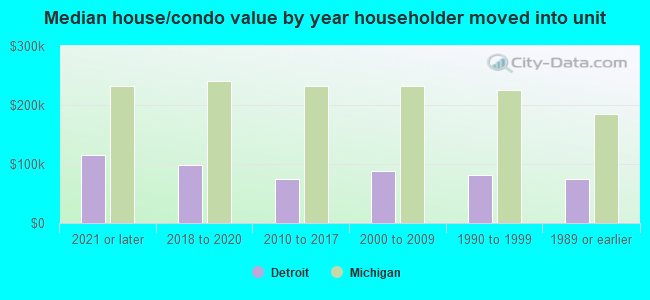
Detroit, MI (Michigan) Houses and Residents
| Detroit: | $83,600 |
| Michigan: | $224,400 |
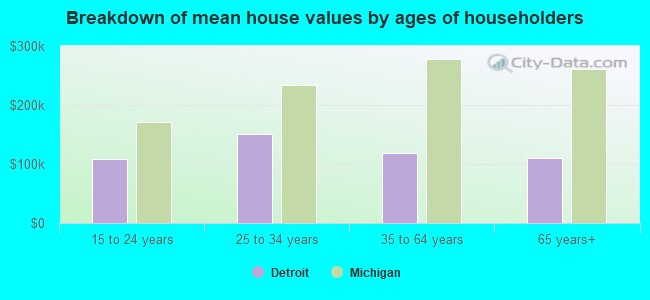
Mean price in 2022:
Detached houses: $113,289
Here: $113,289 State: $280,038 Townhouses or other attached units: $167,441
Here: $167,441 State: $239,520 In 2-unit structures: $91,488
Here: $91,488 State: $219,481 In 3-to-4-unit structures: $135,167
Here: $135,167 State: $207,067 In 5-or-more-unit structures: $233,646
Here: $233,646 State: $192,733 Mobile homes: $46,622
Here: $46,622 State: $72,868
Total population: 680,250 (All urban)
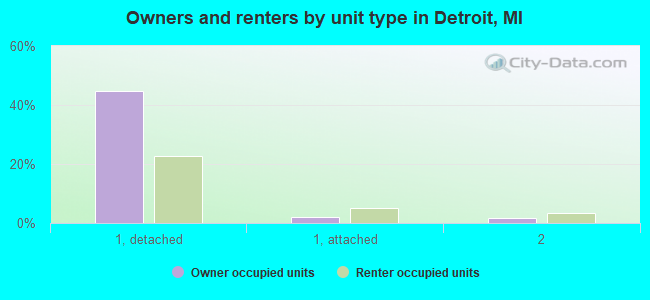
Houses: 311,291 (243,243 occupied: 121,020 owner occupied, 122,223 renter occupied)
| % of renters here: | 50% |
| State: | 27% |
Housing density: 2,243 houses/condos per square mile
Median price asked for vacant for-sale houses and condos in 2022: $72,728.
Median contract rent in 2022: $735 (lower quartile is $548, upper quartile is $924)
Median rent asked for vacant for-rent units in 2022: $877
Median gross rent in Detroit, MI in 2022: $990
Housing units in Detroit with a mortgage: 41,338 (3,727 second mortgage, 100 home equity loan, 2,678 both second mortgage and home equity loan)
Houses without a mortgage: 1,928
Median household income for houses/condos with a mortgage: $61,225
Median household income for apartments without a mortgage: $41,771
Median monthly housing costs: $832
Compare current foreclosures in Detroit, MI:
| Photo | Address | Area | Beds / Baths | Price | Details |
|---|---|---|---|---|---|

|
#1
Desoto St
Detroit, MI 48238
|
1,500 sq. feet
|
1 baths 3 beds |
$71,250
|
show details |

|
#2
Somerset Ave
Detroit, MI 48224
|
1,171 sq. feet
|
1 baths 3 beds |
$14,900
|
show details |

|
#3
W Buena Vista St
Detroit, MI 48238
|
2,852 sq. feet
|
3 baths 4 beds |
$40,000
|
show details |

|
#4
N Kane St
Detroit, MI 48223
|
954 sq. feet
|
1 baths 3 beds |
$125,000
|
show details |

|
#5
Roselawn St
Detroit, MI 48204
|
1,368 sq. feet
|
2 baths 4 beds |
$54,900
|
show details |

|
#6
Bedford St
Detroit, MI 48224
|
1,081 sq. feet
|
1 baths 3 beds |
$52,500
|
show details |

|
#7
Greensboro St
Detroit, MI 48224
|
1,038 sq. feet
|
1 baths 2 beds |
$84,900
|
show details |

|
#8
Montrose St
Detroit, MI 48227
|
1,310 sq. feet
|
1 baths 3 beds |
$95,500
|
show details |

|
#9
Kentfield St
Detroit, MI 48219
|
1,913 sq. feet
|
2 baths 5 beds |
$83,600
|
show details |

|
#10
Winder St Apt 206
Detroit, MI 48201
|
770 sq. feet
|
1 baths 1 beds |
$309,900
|
show details |
| Photo | Address | Area | Beds / Baths | Price | Details |
|---|---|---|---|---|---|

|
#11
Mcclellan St
Detroit, MI 48214
|
- sq. feet
|
2 baths 4 beds |
$35,000
|
show details |

|
#12
Orleans St # 49
Detroit, MI 48207
|
- sq. feet
|
2 baths 3 beds |
$99,900
|
show details |

|
#13
Greenview Ave
Detroit, MI 48228
|
- sq. feet
|
1 baths 1 beds |
$16,600
|
show details |

|
#14
Springfield St
Detroit, MI 48213
|
876 sq. feet
|
1 baths - beds |
$13,900
|
show details |

|
#15
Collingwood St
Detroit, MI 48206
|
1,424 sq. feet
|
1 baths - beds |
$19,900
|
show details |

|
#16
Winthrop St
Detroit, MI 48228
|
759 sq. feet
|
1 baths 2 beds |
show details | |

|
#17
Stratford Rd
Detroit, MI 48221
|
4,057 sq. feet
|
5 baths 3 beds |
show details | |

|
#18
Holbrook St
Detroit, MI 48202
|
2,000 sq. feet
|
2 baths 4 beds |
show details | |

|
#19
Muirland St
Detroit, MI 48221
|
- sq. feet
|
3 baths 6 beds |
show details | |

|
#20
Westbrook St
Detroit, MI 48219
|
955 sq. feet
|
1 baths 3 beds |
show details |
| Photo | Address | Area | Beds / Baths | Price | Details |
|---|---|---|---|---|---|

|
#21
Sunderland Rd
Detroit, MI 48219
|
2,553 sq. feet
|
2 baths 3 beds |
show details | |

|
#22
Balfour Rd
Detroit, MI 48224
|
1,144 sq. feet
|
1 baths 3 beds |
show details | |

|
#23
Orleans St
Detroit, MI 48207
|
1,478 sq. feet
|
2 baths 3 beds |
show details | |

|
#24
Wildemere St
Detroit, MI 48238
|
900 sq. feet
|
1 baths 3 beds |
show details | |

|
#25
Balfour Rd
Detroit, MI 48224
|
861 sq. feet
|
1 baths 3 beds |
show details | |

|
#26
E Jefferson Ave
Detroit, MI 48207
|
783 sq. feet
|
1 baths 1 beds |
show details | |

|
#27
Rutherford St
Detroit, MI 48227
|
1,186 sq. feet
|
1 baths 3 beds |
show details | |

|
#28
W Euclid St
Detroit, MI 48204
|
2,416 sq. feet
|
2 baths 6 beds |
show details | |

|
#29
Glastonbury Ave
Detroit, MI 48223
|
1,884 sq. feet
|
1 baths 3 beds |
show details | |

|
#30
Harned St
Detroit, MI 48234
|
928 sq. feet
|
1 baths 3 beds |
show details |
| Photo | Address | Area | Beds / Baths | Price | Details |
|---|---|---|---|---|---|

|
#31
Fairport St
Detroit, MI 48205
|
1,266 sq. feet
|
1 baths 3 beds |
show details | |

|
#32
Bringard Dr
Detroit, MI 48205
|
1,431 sq. feet
|
1 baths 3 beds |
show details | |

|
#33
Lakepointe St
Detroit, MI 48224
|
924 sq. feet
|
1 baths 3 beds |
show details | |

|
#34
Somerset Ave
Detroit, MI 48224
|
1,277 sq. feet
|
1 baths 3 beds |
show details | |

|
#35
Auburn St
Detroit, MI 48228
|
1,006 sq. feet
|
1 baths 3 beds |
show details | |

|
#36
Sunnyside St
Detroit, MI 48223
|
922 sq. feet
|
1 baths 3 beds |
show details | |

|
#37
Steel St
Detroit, MI 48227
|
2,783 sq. feet
|
1 baths 4 beds |
show details | |

|
#38
Evergreen Rd
Detroit, MI 48219
|
1,105 sq. feet
|
1 baths 3 beds |
show details | |

|
#39
Artesian St
Detroit, MI 48223
|
1,321 sq. feet
|
1 baths 3 beds |
show details | |

|
#40
Huntington Rd
Detroit, MI 48219
|
1,908 sq. feet
|
1 baths 3 beds |
show details |
| Photo | Address | Area | Beds / Baths | Price | Details |
|---|---|---|---|---|---|

|
#41
Kensington Ave
Detroit, MI 48224
|
- sq. feet
|
2 baths 4 beds |
show details | |

|
#42
Cortland St
Detroit, MI 48206
|
1,983 sq. feet
|
2 baths 4 beds |
show details | |

|
#43
Edinborough Rd
Detroit, MI 48219
|
950 sq. feet
|
1 baths 3 beds |
show details | |

|
#44
Dequindre St
Detroit, MI 48234
|
993 sq. feet
|
1 baths 3 beds |
show details | |

|
#45
Oxley St
Detroit, MI 48235
|
1,250 sq. feet
|
2 baths 2 beds |
show details | |

|
#46
Woodmont Ave
Detroit, MI 48227
|
3,235 sq. feet
|
2 baths 4 beds |
show details | |

|
#47
Pennington Dr
Detroit, MI 48221
|
1,038 sq. feet
|
1 baths 3 beds |
show details | |

|
#48
Auburn St
Detroit, MI 48228
|
1,012 sq. feet
|
1 baths 3 beds |
show details | |

|
#49
Chicago Blvd
Detroit, MI 48206
|
3,872 sq. feet
|
3 baths 5 beds |
show details | |

|
Check over 1 million property listings on Foreclosure.com!
|
browse all offers | |||

Latest news about housing in Detroit, MI collected exclusively by city-data.com from local newspapers, TV, and radio stations

 | Detroit: Home of $250 houses and $549,000 condos? (10 replies) |
| Riverfront Towers apartments (& condos), downtown Detroit (4 replies) |
| Suburban Detroit Apartment/Condos (1 reply) |
| Renting a house vs. apartment in Downriver area (8 replies) |
| Detroit putting homes up for auction (40 replies) |
| Detroit spends $9 million on 30 homes. (10 replies) |
Median year apartment built: 1952
Household type by relationship:
Households: 620,410- Male householders: 94,830 (49,328 living alone), Female householders: 148,413 (51,618 living alone)
42,939 spouses (42,207 opposite-sex spouses), 16,605 unmarried partners, (15,928 opposite-sex unmarried partners), 211,388 children (204,111 natural, 2,995 adopted, 4,282 stepchildren), 32,808 grandchildren, 14,581 brothers or sisters, 8,154 parents, 1,044 foster children, 19,535 other relatives, 18,414 non-relatives
- In group quarters: 11,699
Size of family households: 49,217 2-persons, 31,836 3-persons, 22,441 4-persons, 11,866 5-persons, 7,391 6-persons, 5,125 7-or-more-persons.
Size of nonfamily households: 100,946 1-person, 12,932 2-persons, 768 3-persons, 334 4-persons, 357 5-persons, 30 6-persons.
40,141 married couples with children.
81,390 single-parent households (10,961 men, 70,429 women).
88.7% of residents of Detroit speak English at home.
5.8% of residents speak Spanish at home (58% speak English very well, 21% speak English well, 17% speak English not well, 5% don't speak English at all).
1.8% of residents speak other Indo-European language at home (47% speak English very well, 31% speak English well, 19% speak English not well, 4% don't speak English at all).
0.4% of residents speak Asian or Pacific Island language at home (59% speak English very well, 38% speak English well, 3% speak English not well).
3.3% of residents speak other language at home (42% speak English very well, 26% speak English well, 18% speak English not well, 15% don't speak English at all).
Foreign born population: 37,968 (6.1%)
(44.3% of them are naturalized citizens)
| Here: | 6.3 |
| State: | 6.5 |
| Here: | 5.0 |
| State: | 4.3 |
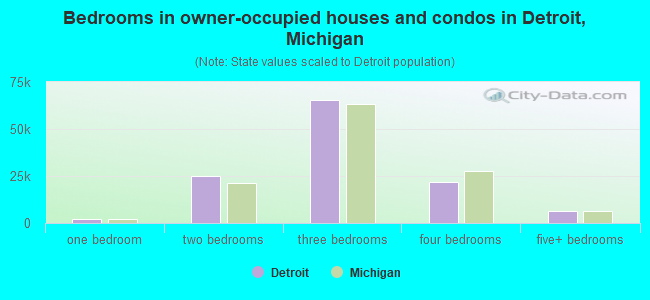
- Bedrooms in owner-occupied houses and condos in Detroit, Michigan
- 381no bedroom
- 1,9891 bedroom
- 24,9062 bedrooms
- 65,5353 bedrooms
- 21,5744 bedrooms
- 6,6355+ bedrooms
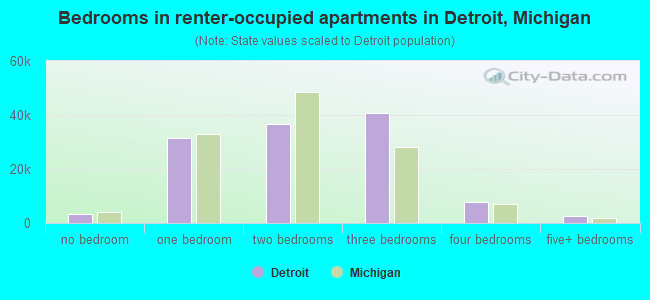
- Bedrooms in renter-occupied apartments in Detroit, Michigan
- 3,243no bedroom
- 31,6311 bedroom
- 36,6422 bedrooms
- 40,5573 bedrooms
- 7,5934 bedrooms
- 2,5575+ bedrooms
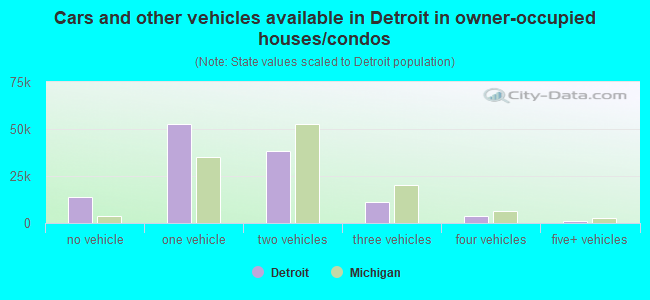
- Cars and other vehicles available in Detroit in owner-occupied houses/condos
- 13,882no vehicle
- 52,8381 vehicle
- 38,1682 vehicles
- 11,4093 vehicles
- 3,6704 vehicles
- 1,0535+ vehicles
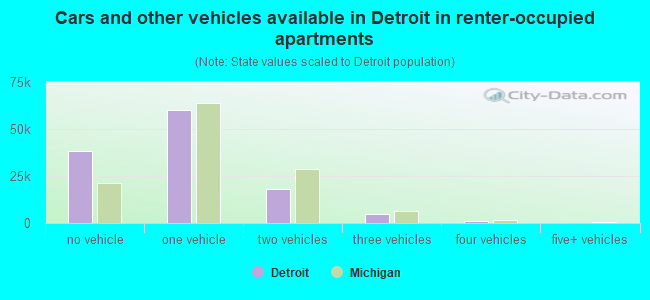
- Cars and other vehicles available in Detroit in renter-occupied apartments
- 38,340no vehicle
- 60,0021 vehicle
- 18,1032 vehicles
- 4,8833 vehicles
- 8954 vehicles
- 05+ vehicles
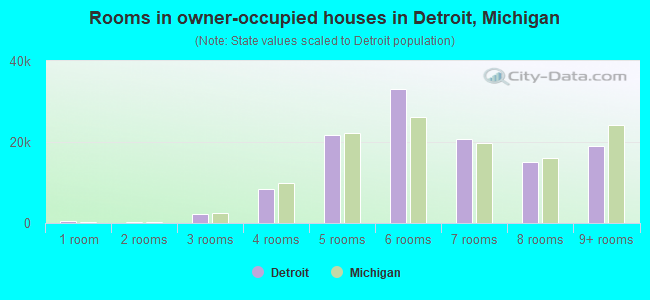
- Rooms in owner-occupied houses in Detroit, Michigan
- 3811 room
- 3192 rooms
- 2,2643 rooms
- 8,4114 rooms
- 21,8385 rooms
- 33,1676 rooms
- 20,6707 rooms
- 15,0228 rooms
- 18,9489+ rooms
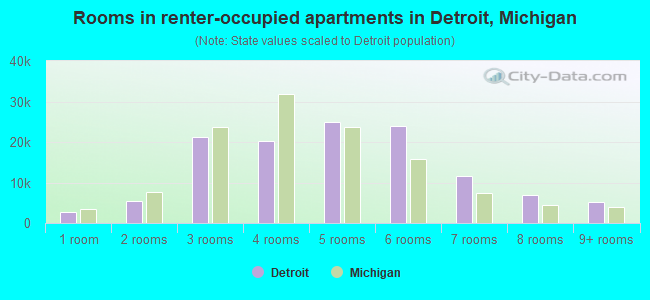
- Rooms in renter-occupied apartments in Detroit, Michigan
- 2,6541 room
- 5,4852 rooms
- 21,3403 rooms
- 20,1894 rooms
- 24,9885 rooms
- 24,0466 rooms
- 11,6267 rooms
- 6,8038 rooms
- 5,0929+ rooms
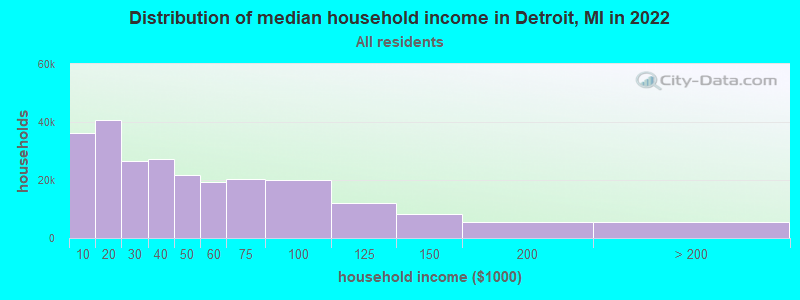
Detroit, MI household income distribution

- 36,317Less than $10,000
- 40,706$10,000 to $19,999
- 26,450$20,000 to $29,999
- 27,346$30,000 to $39,999
- 21,768$40,000 to $49,999
- 19,316$50,000 to $59,999
- 20,243$60,000 to $74,999
- 19,983$75,000 to $99,999
- 11,908$100,000 to $124,999
- 8,366$125,000 to $149,999
- 5,418$150,000 to $199,999
- 5,422$200,000 or more
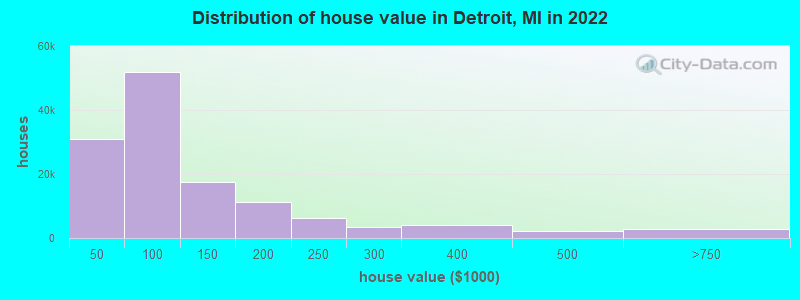
Home value of owner - occupied houses in 2022 in Detroit, MI
-
- 3,442Less than $10,000
- 3,172$10,000 to $14,999
- 2,260$15,000 to $19,999
- 2,333$20,000 to $24,999
- 1,861$25,000 to $29,999
- 5,179$30,000 to $34,999
- 3,535$35,000 to $39,999
- 9,171$40,000 to $49,999
- 8,208$50,000 to $59,999
- 9,388$60,000 to $69,999
- 8,559$70,000 to $79,999
- 9,521$80,000 to $89,999
- 6,974$90,000 to $99,999
- 12,830$100,000 to $124,999
- 4,806$125,000 to $149,999
- 8,093$150,000 to $174,999
- 3,113$175,000 to $199,999
- 6,260$200,000 to $249,999
- 3,492$250,000 to $299,999
- 4,014$300,000 to $399,999
- 2,083$400,000 to $499,999
- 1,950$500,000 to $749,999
- 280$750,000 to $999,999
- 307$1,000,000 to $1,499,999
- 157$1,500,000 to $1,999,999
- 32$2,000,000 or more
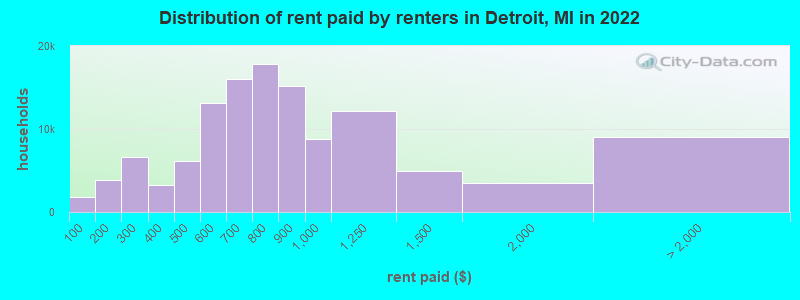
Rent paid by renters in 2022 in Detroit, MI
-
- 1,817Less than $100
- 1,106$100 to $149
- 2,765$150 to $199
- 4,116$200 to $249
- 2,547$250 to $299
- 2,123$300 to $349
- 1,115$350 to $399
- 3,767$400 to $449
- 2,381$450 to $499
- 7,142$500 to $549
- 5,941$550 to $599
- 7,333$600 to $649
- 8,751$650 to $699
- 9,155$700 to $749
- 8,637$750 to $799
- 15,146$800 to $899
- 8,787$900 to $999
- 12,150$1,000 to $1,249
- 4,908$1,250 to $1,499
- 3,474$1,500 to $1,999
- 1,089$2,000 to $2,499
- 207$2,500 to $2,999
- 137$3,000 to $3,499
- 7,629No cash rent

Percentage of workers working in this county: 75.2%
Number of people working at home: 25,103 (11.5% of all workers)

Travel time to work (commute)
- Less than 5 minutes: 4,116
- 5 to 9 minutes: 14,173
- 10 to 14 minutes: 24,655
- 15 to 19 minutes: 32,621
- 20 to 24 minutes: 39,820
- 25 to 29 minutes: 16,244
- 30 to 34 minutes: 32,116
- 35 to 39 minutes: 4,158
- 40 to 44 minutes: 3,203
- 45 to 59 minutes: 8,872
- 60 to 89 minutes: 8,097
- 90 or more minutes: 5,229

Means of transportation to work:
- Drove a car alone: 195,902 (74.3%)
- Carpooled: 21,979 (8.3%)
- Bus: 7,328 (2.8%)
- Subway or elevated rail: 51 (0.0%)
- Long-distance train or commuter rail: 26 (0.0%)
- Light rail, streetcar or trolley: 97 (0.0%)
- Ferryboat: 88 (0.0%)
- Taxi: 5,672 (2.2%)
- Bicycle: 975 (0.4%)
- Walked: 6,379 (2.4%)
- Worked at home: 25,103 (9.5%)
- Unemployment by race in 2022
- Unemployment rate for White non-Hispanic residents
- 9.9%Males
- 5.7%Females
- Unemployment rate for Black residents
- 15.5%Males
- 11.6%Females
- Unemployment rate for American Indian and Alaska Native residents
- 9.8%Males
- 6.0%Females
- Unemployment rate for Asian residents
- 5.4%Males
- 2.5%Females
- Unemployment rate for other race residents
- 5.9%Males
- 16.9%Females
- Unemployment rate for two or more race residents
- 20.5%Males
- 11.4%Females
- Unemployment rate for Hispanic or Latino residents
- 6.8%Males
- 16.3%Females
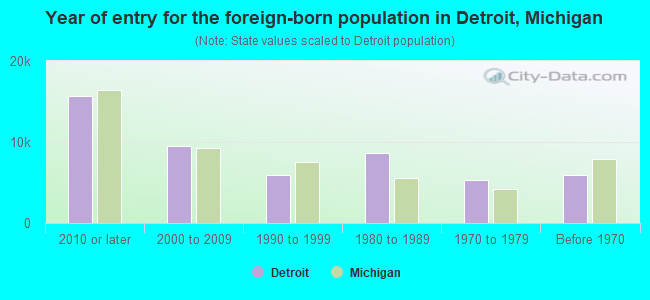
- Year of entry for the foreign-born population in Detroit, Michigan
- 15,6602010 or later
- 9,4942000 to 2009
- 5,8661990 to 1999
- 8,6171980 to 1989
- 5,3201970 to 1979
- 5,884Before 1970
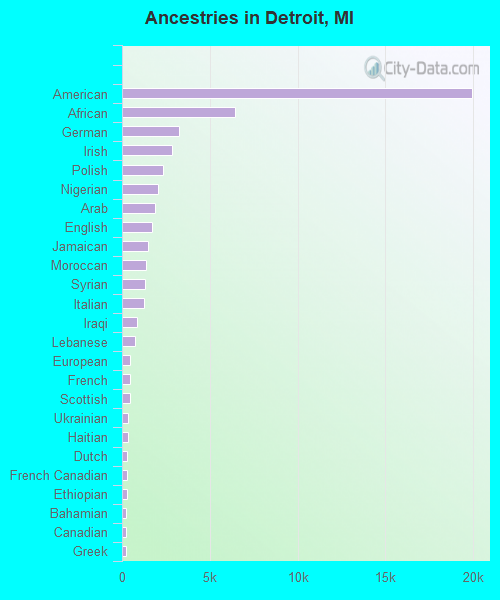
First ancestries reported:
- American: 19,904 (4.4%)
- African: 6,463 (1.4%)
- German: 3,241 (0.7%)
- Irish: 2,838 (0.6%)
- Polish: 2,309 (0.5%)
- Nigerian: 2,033 (0.4%)
- Arab: 1,891 (0.4%)
- English: 1,685 (0.4%)
- Jamaican: 1,509 (0.3%)
- Moroccan: 1,391 (0.3%)
- Syrian: 1,318 (0.3%)
- Italian: 1,248 (0.3%)
- Iraqi: 849 (0.2%)
- Lebanese: 712 (0.2%)
- European: 475 (0.1%)
- French: 446 (0.10%)
- Scottish: 430 (0.09%)
- Ukrainian: 339 (0.07%)
- Haitian: 323 (0.07%)
- Dutch: 298 (0.07%)
- French Canadian: 289 (0.06%)
- Ethiopian: 265 (0.06%)
- Bahamian: 241 (0.05%)
- Canadian: 227 (0.05%)
- Greek: 217 (0.05%)
- Swedish: 213 (0.05%)
- Scotch-Irish: 210 (0.05%)
- Finnish: 120 (0.03%)
- Czech: 114 (0.03%)
- Norwegian: 113 (0.02%)
- Romanian: 110 (0.02%)
- British: 107 (0.02%)
- Iranian: 106 (0.02%)
- Hungarian: 104 (0.02%)
- Slovene: 101 (0.02%)
- Serbian: 99 (0.02%)
- Guyanese: 98 (0.02%)
- Senegalese: 91 (0.02%)
- Scandinavian: 91 (0.02%)
- Sudanese: 86 (0.02%)
- Albanian: 85 (0.02%)
- Somali: 83 (0.02%)
- Palestinian: 79 (0.02%)
- Eastern European: 79 (0.02%)
- Liberian: 77 (0.02%)
- South African: 76 (0.02%)
- Trinidadian and Tobagonian: 76 (0.02%)
- Ghanaian: 58 (0.01%)
- Maltese: 55 (0.01%)
- Kenyan: 45 (0.01%)
- Turkish: 44 (0.01%)
- Belizean: 44 (0.01%)
- Brazilian: 43 (0.01%)
- Danish: 40 (0.01%)
- Egyptian: 39 (0.01%)
- Lithuanian: 39 (0.01%)
- Assyrian: 35 (0.01%)
- Yugoslavian: 35 (0.01%)
- Israeli: 34 (0.01%)
- Russian: 32 (0.01%)
- Welsh: 26 (0.01%)
- Northern European: 24 (0.01%)
Most common places of birth for foreign-born residents (%):
| Detroit: | 30.0% (10,773) |
| Michigan: | 10.9% (75,965) |
| Detroit: | 17.0% (6,110) |
| Michigan: | 3.1% (21,538) |
| Detroit: | 15.7% (5,642) |
| Michigan: | 2.6% (18,065) |
| Detroit: | 3.7% (1,343) |
| Michigan: | 0.5% (3,798) |
| Detroit: | 3.4% (1,220) |
| Michigan: | 8.1% (55,954) |
| Detroit: | 3.0% (1,076) |
| Michigan: | 11.1% (77,240) |
| Detroit: | 3.0% (1,065) |
| Michigan: | 5.0% (35,052) |
| Detroit: | 2.7% (976) |
| Michigan: | 0.9% (5,978) |
| Detroit: | 2.7% (963) |
| Michigan: | 1.0% (7,097) |
| Detroit: | 2.4% (849) |
| Michigan: | 0.7% (4,645) |
| Detroit: | 2.3% (833) |
| Michigan: | 0.9% (5,964) |
Place of birth for U.S.-born residents:
- This state: 483,338
- Other state: 93,140
- Northeast: 6,822
- Midwest: 16,808
- South: 60,378
- West: 9,132
88.2% of Detroit residents lived in the same house 1 years ago.
Out of people who lived in different houses, 41.4% lived in this county.
Out of people who lived in different counties, 60.5% lived in Michigan.
| Detroit: | 88.2% |
| State average: | 88.4% |
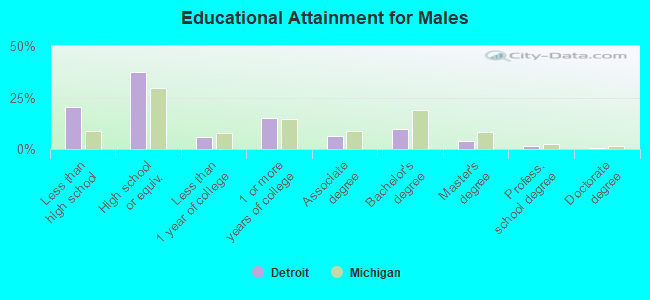
Education attainment for males 25 years and older:
- No schooling: 3,428
- Nursery to 4th grade: 1,288
- 5th and 6th grade: 1,493
- 7th and 8th grade: 1,919
- 9th grade: 5,457
- 10th grade: 7,730
- 11th grade: 8,943
- 12th grade, no diploma: 7,407
- High school graduate (or equivalency): 69,500
- Less than 1 year of college: 10,994
- Some college more than 1 year, no degree: 27,801
- Associate degree: 12,043
- Bachelor's degree: 18,067
- Master's degree: 6,944
- Professional school degree: 2,454
- Doctorate degree: 820
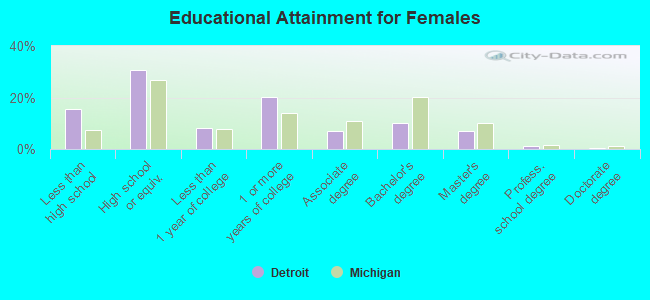
Education attainment for females 25 years and older:
- No schooling: 4,262
- Nursery to 4th grade: 1,120
- 5th and 6th grade: 2,325
- 7th and 8th grade: 2,139
- 9th grade: 3,947
- 10th grade: 4,385
- 11th grade: 11,124
- 12th grade, no diploma: 5,458
- High school graduate (or equivalency): 67,909
- Less than 1 year of college: 18,011
- Some college more than 1 year, no degree: 44,766
- Associate degree: 15,611
- Bachelor's degree: 22,350
- Master's degree: 15,445
- Professional school degree: 2,478
- Doctorate degree: 1,129
Housing units in structures:
- One, detached: 201,124
- One, attached: 20,893
- Two: 21,844
- 3 or 4: 7,891
- 5 to 9: 6,567
- 10 to 19: 10,160
- 20 to 49: 13,651
- 50 or more: 28,155
- Mobile homes: 805
- Boats, RVs, vans, etc.: 201
Median worth of mobile homes: $50,300
Housing units lacking complete kitchen facilities in 2022: 15.6%
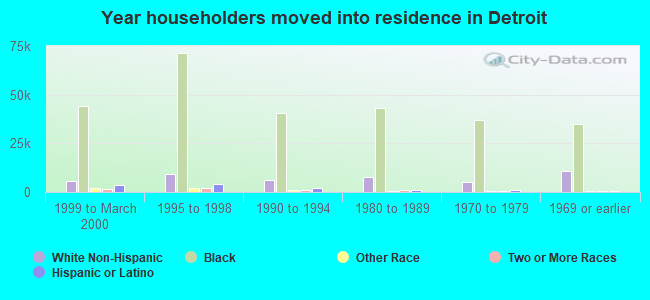
House/condo owner moved in on average 17 years ago
Renter moved in on average 3 years ago
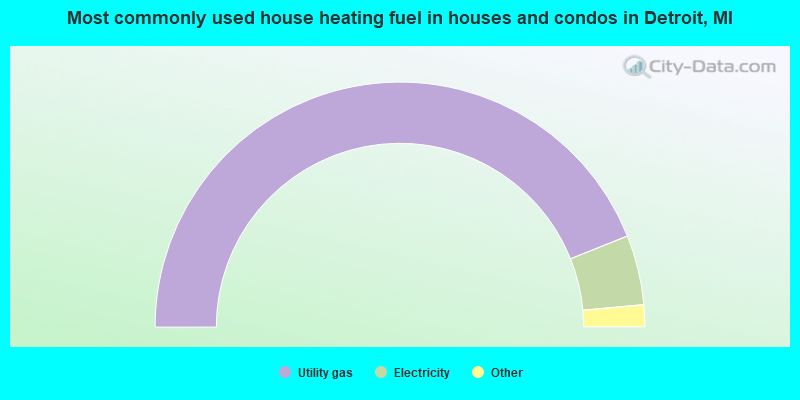
- 87.9%Utility gas
- 9.2%Electricity
- 1.5%Bottled, tank, or LP gas
- 0.8%Other fuel
- 0.5%No fuel used
- 0.1%Wood
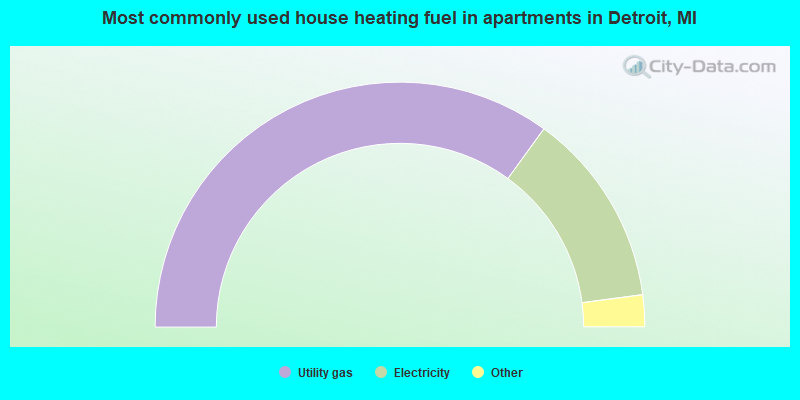
- 70.0%Utility gas
- 25.8%Electricity
- 2.1%No fuel used
- 1.3%Bottled, tank, or LP gas
- 0.6%Other fuel
- 0.1%Fuel oil, kerosene, etc.
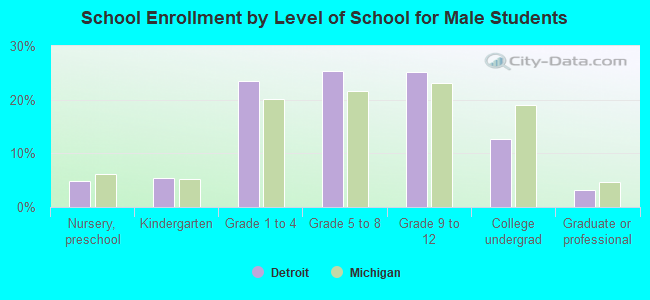
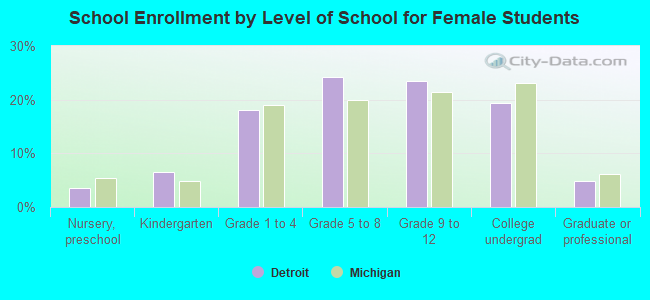
Private vs. public school enrollment:
| Here: | 8.0% |
| Michigan: | 12.4% |
| Here: | 8.3% |
| Michigan: | 9.8% |
| Here: | 16.9% |
| Michigan: | 14.9% |