East Lansing, MI (Michigan) Houses and Residents
Estimated median house or condo value in 2022: $258,277 (it was $144,100 in 2000 )
East Lansing:
$258,277Michigan:
$224,400
Lower value quartile - upper value quartile: $193,296 - $358,349Mean price in 2022: Detached houses: $318,818 Here:
$318,818State:
$280,038
Townhouses or other attached units: $244,543 Here:
$244,543State:
$239,520
In 2-unit structures: $251,944 Here:
$251,944State:
$219,481
In 3-to-4-unit structures: $168,751 Here:
$168,751State:
$207,067
In 5-or-more-unit structures: $194,945 Here:
$194,945State:
$192,733
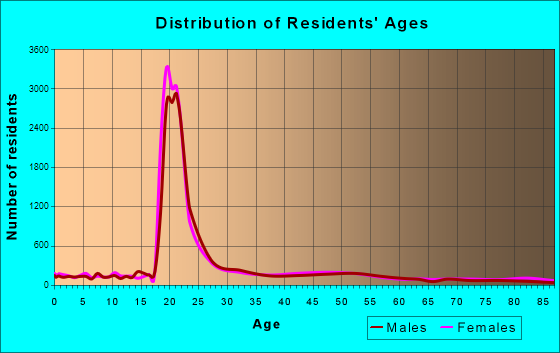
Total population: 48,648 (Urban population: 46,667, Rural population: 37 (all nonfarm) )
Houses: 15,854 (13,961 occupied: 5,642 owner occupied, 8,563 renter occupied )
% of renters here:
60%State:
27%
Housing density: 1,410 houses/condos per square mile
Median price asked for vacant for-sale houses and condos in 2022: $136,934.
Median contract rent in 2022: $905 (lower quartile is $742, upper quartile is $1,170)
Median rent asked for vacant for-rent units in 2022: $1,328
Median gross rent in East Lansing, MI in 2022: $1,009
Housing units in East Lansing with a mortgage: 3,717 (373 second mortgage, 0 home equity loan, 334 both second mortgage and home equity loan )Houses without a mortgage: 160
Median household income for houses/condos with a mortgage: $127,141
Median household income for apartments without a mortgage: $100,466
Median monthly housing costs: $1,100
Data:
Median house or condo value ($)
Median house or condo value ($ change since 2000)
Median house or condo value ($) - White
Median house or condo value ($) - Black or African American
Median house or condo value ($) - Asian
Median house or condo value ($) - Hispanic or Latino
Median house or condo value ($) - American Indian and Alaska Native
Median house or condo value ($) - Multirace
Median house or condo value ($) - Other Race
Median price asked for mobile homes ($)
Household density (households per square mile)
Mean house or condo value by units in structure - 1, detached ($)
Mean house or condo value by units in structure - 1, attached ($)
Mean house or condo value by units in structure - 2 ($)
Mean house or condo value by units in structure by units in structure - 3 or 4 ($)
Mean house or condo value by units in structure - 5 or more ($)
Mean house or condo value by units in structure - Boat, RV, van, etc. ($)
Mean house or condo value by units in structure - Mobile home ($)
Median contract rent ($)
Median contract rent - Lower quartile ($)
Median contract rent - Upper quartile ($)
Median gross rent ($)
Urban houses (%)
Rural houses (%)
Houses occupied (%)
Houses occupied (% change since 2000)
Houses owner occupied (%)
Houses owner occupied (% change since 2000)
Houses renter occupied (%)
Houses renter occupied (% change since 2000)
Vacant housing units - For rent (%)
Vacant housing units - For rent (% change since 2000)
Vacant housing units - For sale only (%)
Vacant housing units - For sale only (% change since 2000)
Vacant housing units - Rented or sold, not occupied (%)
Vacant housing units - Rented or sold, not occupied (% change since 2000)
Vacant housing units - For seasonal, recreational, or occasional use (%)
Vacant housing units - For seasonal, recreational, or occasional use (% change since 2000)
Vacant housing units - For migrant workers (%)
Vacant housing units - For migrant workers (% change since 2000)
Vacant housing units - Other vacant (%)
Vacant housing units - Other vacant (% change since 2000)
Median monthly housing costs ($)
Median household income for houses/condos with a mortgage ($)
Median household income for houses/condos without a mortgage ($)
Median household income ($)
Median household income ($) - White
Median household income ($) - Black or African American
Median household income ($) - Asian
Median household income ($) - Hispanic or Latino
Median household income ($) - American Indian and Alaska Native
Median household income ($) - Multirace
Median household income ($) - Other Race
Mortgage status - with mortgage (%)
Mortgage status - with second mortgage (%)
Mortgage status - with home equity loan (%)
Mortgage status - with both second mortgage and home equity loan (%)
Mortgage status - without a mortgage (%)
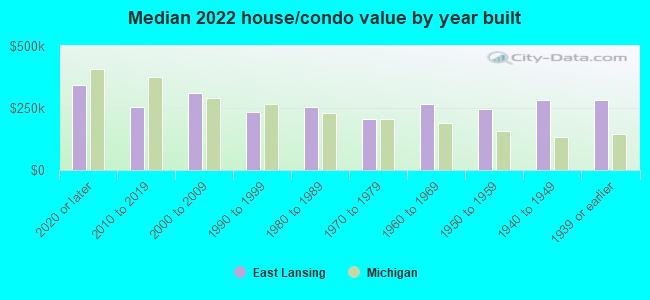
Median year house/condo built
Median year apartment built
Household type by relationship - Male householder living alone (%)
Household type by relationship - Male householder not living alone (%)
Household type by relationship - Female householder living alone (%)
Household type by relationship - Female householder not living alone (%)
Household type by relationship - Opposite-Sex spouse (%)
Household type by relationship - Same-Sex spouse (%)
Household type by relationship - Opposite-Sex unmarried partner (%)
Household type by relationship - Same-Sex unmarried partner (%)
Household type by relationship - In group quarters (%)
Size of family households - 2-person household (%)
Size of family households - 3-person household (%)
Size of family households - 4-person household (%)
Size of family households - 5-person household (%)
Size of family households - 6-person household (%)
Size of family households - 7-or-more-person household (%)
Size of nonfamily households - 1-person household (%)
Size of nonfamily households - 2-person household (%)
Size of nonfamily households - 3-person household (%)
Size of nonfamily households - 4-person household (%)
Size of nonfamily households - 5-person household (%)
Size of nonfamily households - 6-person household (%)
Size of nonfamily households - 7-or-moreperson household (%)
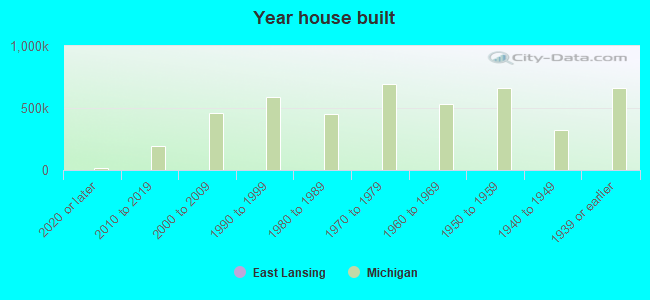
Year house built - Built 2010 or later (%)
Year house built - Built 2000 to 2009 (%)
Year house built - Built 1990 to 1999 (%)
Year house built - Built 1980 to 1989 (%)
Year house built - Built 1970 to 1979 (%)
Year house built - Built 1960 to 1969 (%)
Year house built - Built 1950 to 1959 (%)
Year house built - Built 1940 to 1949 (%)
Year house built - Built 1939 or earlier (%)
Median number of rooms in houses and condos
Median number of rooms in apartments
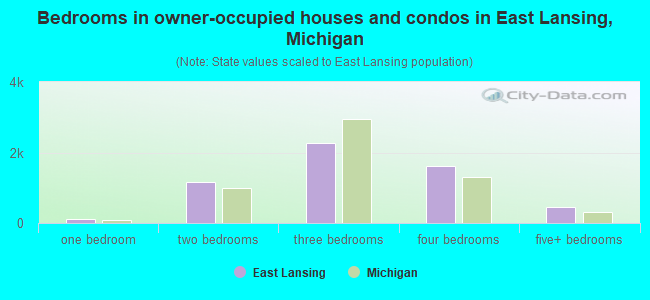
Median number of bedrooms in owner occupied houses
Mean number of bedrooms in owner occupied houses
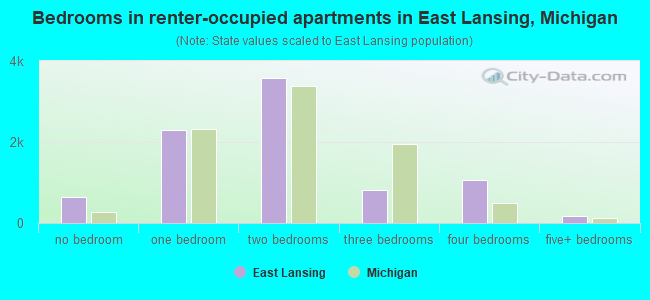
Median number of bedrooms in renter occupied houses
Mean number of bedrooms in renter occupied houses
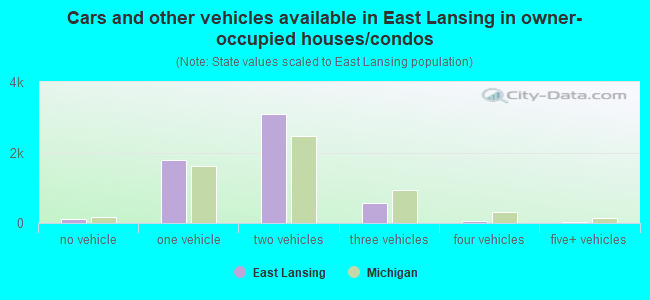
Median number of vehichles in owner occupied houses
Mean number of vehichles in owner occupied houses
Median number of vehichles in renter occupied houses
Mean number of vehichles in renter occupied houses
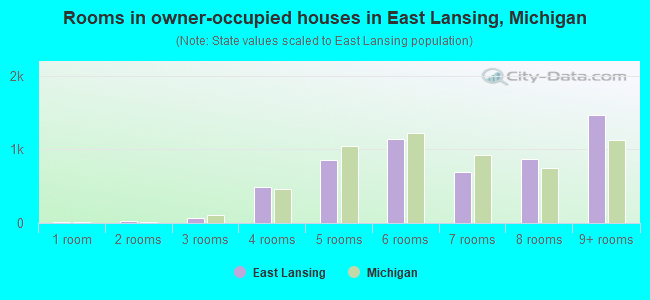
Rooms in owner-occupied houses - 1 room (%)
Rooms in owner-occupied houses - 2 rooms (%)
Rooms in owner-occupied houses - 3 rooms (%)
Rooms in owner-occupied houses - 4 rooms (%)
Rooms in owner-occupied houses - 5 rooms (%)
Rooms in owner-occupied houses - 6 rooms (%)
Rooms in owner-occupied houses - 7 rooms (%)
Rooms in owner-occupied houses - 8 rooms (%)
Rooms in owner-occupied houses - 9+ rooms (%)
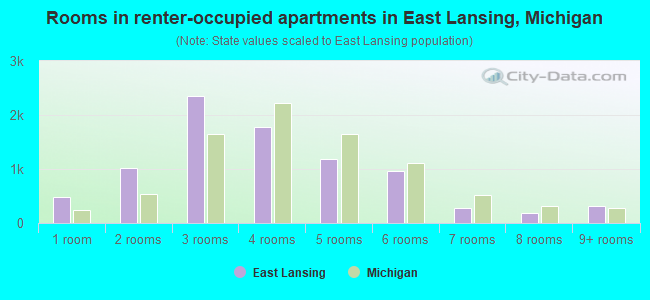
Rooms in renter-occupied houses - 1 room (%)
Rooms in renter-occupied houses - 2 rooms (%)
Rooms in renter-occupied houses - 3 rooms (%)
Rooms in renter-occupied houses - 4 rooms (%)
Rooms in renter-occupied houses - 5 rooms (%)
Rooms in renter-occupied houses - 6 rooms (%)
Rooms in renter-occupied houses - 7 rooms (%)
Rooms in renter-occupied houses - 8 rooms (%)
Rooms in renter-occupied houses - 9+ rooms (%)
Bedrooms in owner-occupied houses - no bedrooms (%)
Bedrooms in owner-occupied houses - 1 bedroom (%)
Bedrooms in owner-occupied houses - 2 bedrooms (%)
Bedrooms in owner-occupied houses - 3 bedrooms (%)
Bedrooms in owner-occupied houses - 4 bedrooms (%)
Bedrooms in owner-occupied houses - 5+ bedrooms (%)
Bedrooms in renter-occupied houses - no bedrooms (%)
Bedrooms in renter-occupied houses - 1 bedroom (%)
Bedrooms in renter-occupied houses - 2 bedrooms (%)
Bedrooms in renter-occupied houses - 3 bedrooms (%)
Bedrooms in renter-occupied houses - 4 bedrooms (%)
Bedrooms in renter-occupied houses - 5+ bedrooms (%)
Vehicles available in owner-occupied houses - no vehicle available (%)
Vehicles available in owner-occupied houses - 1 vehicle available(%)
Vehicles available in owner-occupied houses - 2 Vehicles available (%)
Vehicles available in owner-occupied houses - 3 Vehicles available (%)
Vehicles available in owner-occupied houses - 4 Vehicles available (%)
Vehicles available in owner-occupied houses - 5+ Vehicles available (%)
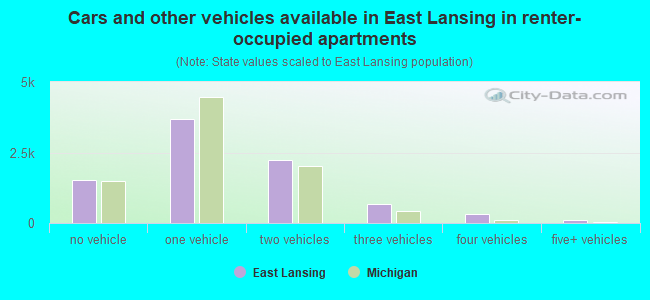
Vehicles available in renter-occupied houses - no vehicle available (%)
Vehicles available in renter-occupied houses - 1 vehicle available (%)
Vehicles available in renter-occupied houses - 2 Vehicles available (%)
Vehicles available in renter-occupied houses - 3 Vehicles available (%)
Vehicles available in renter-occupied houses - 4 Vehicles available (%)
Vehicles available in renter-occupied houses - 5+ Vehicles available (%)
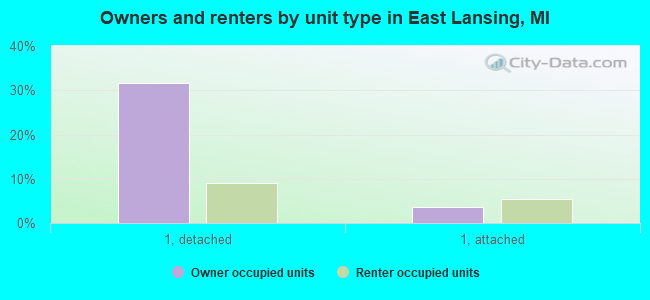
Housing units in structures - 1, detached (%)
Housing units in structures - 1, attached (%)
Housing units in structures - 2 (%)
Housing units in structures - 3 or 4 (%)
Housing units in structures - 5 to 9 (%)
Housing units in structures - 10 to 19 (%)
Housing units in structures - 20 to 49 (%)
Housing units in structures - 50 or more (%)
Housing units in structures - Mobile home (%)
Housing units in structures - Boat, RV, van, etc. (%)
Housing units in structures - Owners - 1, detached (%)
Housing units in structures - Owners - 1, attached (%)
Housing units in structures - Owners - 2 (%)
Housing units in structures - Owners - 3 or 4 (%)
Housing units in structures - Owners - 5 to 9 (%)
Housing units in structures - Owners - 10 to 19 (%)
Housing units in structures - Owners - 20 to 49 (%)
Housing units in structures - Owners - 50 or more (%)
Housing units in structures - Owners - Mobile home (%)
Housing units in structures - Owners - Boat, RV, van, etc. (%)
Housing units in structures - Renters - 1, detached (%)
Housing units in structures - Renters - 1, attached (%)
Housing units in structures - Renters - 2 (%)
Housing units in structures - Renters - 3 or 4 (%)
Housing units in structures - Renters - 5 to 9 (%)
Housing units in structures - Renters - 10 to 19 (%)
Housing units in structures - Renters - 20 to 49 (%)
Housing units in structures - Renters - 50 or more (%)
Housing units in structures - Renters - Mobile home (%)
Housing units in structures - Renters - Boat, RV, van, etc. (%)
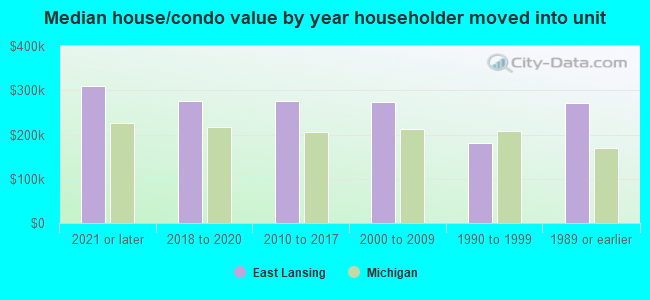
House/condo owner moved in on average (years ago)
Renter moved in on average (years ago)
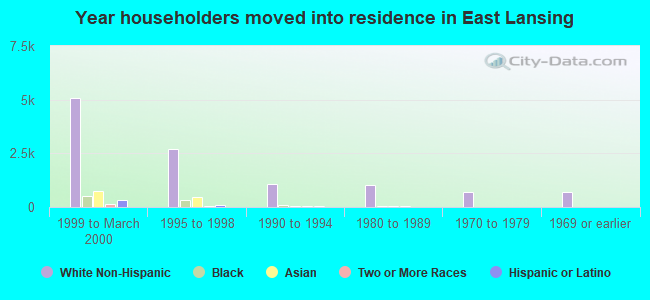
Year householder moved into unit - Moved in 1999 to March 2000 (%)
Year householder moved into unit - Moved in 1999 to March 2000 (%) - White
Year householder moved into unit - Moved in 1999 to March 2000 (%) - Black or African American
Year householder moved into unit - Moved in 1999 to March 2000 (%) - Asian
Year householder moved into unit - Moved in 1999 to March 2000 (%) - Hispanic or Latino
Year householder moved into unit - Moved in 1999 to March 2000 (%) - American Indian and Alaska Native
Year householder moved into unit - Moved in 1999 to March 2000 (%) - Multirace
Year householder moved into unit - Moved in 1999 to March 2000 (%) - Other Race
Year householder moved into unit - Moved in 1995 to 1998 (%)
Year householder moved into unit - Moved in 1995 to 1998 (%) - White
Year householder moved into unit - Moved in 1995 to 1998 (%) - Black or African American
Year householder moved into unit - Moved in 1995 to 1998 (%) - Asian
Year householder moved into unit - Moved in 1995 to 1998 (%) - Hispanic or Latino
Year householder moved into unit - Moved in 1995 to 1998 (%) - American Indian and Alaska Native
Year householder moved into unit - Moved in 1995 to 1998 (%) - Multirace
Year householder moved into unit - Moved in 1995 to 1998 (%) - Other Race
Year householder moved into unit - Moved in 1990 to 1994 (%)
Year householder moved into unit - Moved in 1990 to 1994 (%) - White
Year householder moved into unit - Moved in 1990 to 1994 (%) - Black or African American
Year householder moved into unit - Moved in 1990 to 1994 (%) - Asian
Year householder moved into unit - Moved in 1990 to 1994 (%) - Hispanic or Latino
Year householder moved into unit - Moved in 1990 to 1994 (%) - American Indian and Alaska Native
Year householder moved into unit - Moved in 1990 to 1994 (%) - Multirace
Year householder moved into unit - Moved in 1990 to 1994 (%) - Other Race
Year householder moved into unit - Moved in 1980 to 1989 (%)
Year householder moved into unit - Moved in 1980 to 1989 (%) - White
Year householder moved into unit - Moved in 1980 to 1989 (%) - Black or African American
Year householder moved into unit - Moved in 1980 to 1989 (%) - Asian
Year householder moved into unit - Moved in 1980 to 1989 (%) - Hispanic or Latino
Year householder moved into unit - Moved in 1980 to 1989 (%) - American Indian and Alaska Native
Year householder moved into unit - Moved in 1980 to 1989 (%) - Multirace
Year householder moved into unit - Moved in 1980 to 1989 (%) - Other Race
Year householder moved into unit - Moved in 1970 to 1979 (%)
Year householder moved into unit - Moved in 1970 to 1979 (%) - White
Year householder moved into unit - Moved in 1970 to 1979 (%) - Black or African American
Year householder moved into unit - Moved in 1970 to 1979 (%) - Asian
Year householder moved into unit - Moved in 1970 to 1979 (%) - Hispanic or Latino
Year householder moved into unit - Moved in 1970 to 1979 (%) - American Indian and Alaska Native
Year householder moved into unit - Moved in 1970 to 1979 (%) - Multirace
Year householder moved into unit - Moved in 1970 to 1979 (%) - Other Race
Year householder moved into unit - Moved in 1969 or earlier (%)
Year householder moved into unit - Moved in 1969 or earlier (%) - White
Year householder moved into unit - Moved in 1969 or earlier (%) - Black or African American
Year householder moved into unit - Moved in 1969 or earlier (%) - Asian
Year householder moved into unit - Moved in 1969 or earlier (%) - Hispanic or Latino
Year householder moved into unit - Moved in 1969 or earlier (%) - American Indian and Alaska Native
Year householder moved into unit - Moved in 1969 or earlier (%) - Multirace
Year householder moved into unit - Moved in 1969 or earlier (%) - Other Race
Housing units lacking complete plumbing facilities (%)
Housing units lacking complete kitchen facilities (%)
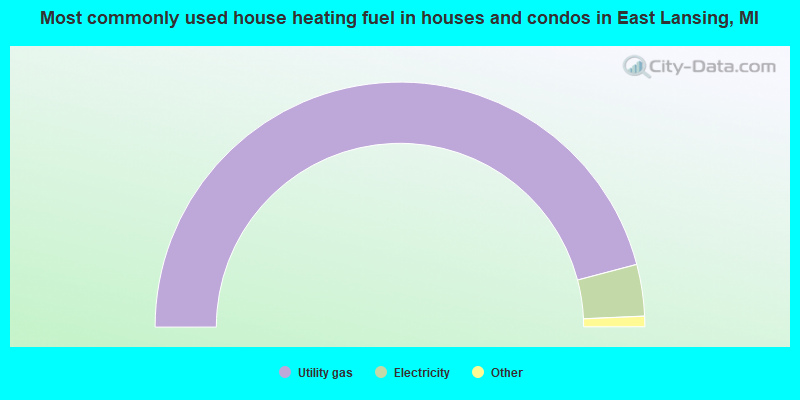
House heating fuel used in houses and condos - Utility gas (%)
House heating fuel used in houses and condos - Bottled, tank, or LP gas (%)
House heating fuel used in houses and condos - Electricity (%)
House heating fuel used in houses and condos - Fuel oil, kerosene, etc. (%)
House heating fuel used in houses and condos - Coal or coke (%)
House heating fuel used in houses and condos - Wood (%)
House heating fuel used in houses and condos - Solar energy (%)
House heating fuel used in houses and condos - Other fuel (%)
House heating fuel used in houses and condos - No fuel used (%)
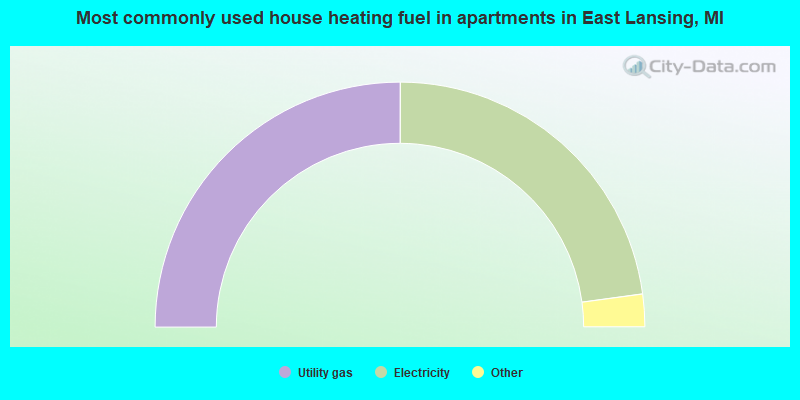
House heating fuel used in apartments - Utility gas (%)
House heating fuel used in apartments - Bottled, tank, or LP gas (%)
House heating fuel used in apartments - Electricity (%)
House heating fuel used in apartments - Fuel oil, kerosene, etc. (%)
House heating fuel used in apartments - Coal or coke (%)
House heating fuel used in apartments - Wood (%)
House heating fuel used in apartments - Solar energy (%)
House heating fuel used in apartments - Other fuel (%)
House heating fuel used in apartments - No fuel used (%)
Median year house/condo built: 1969Median year apartment built: 1980Household type by relationship:
Households: 45,654
Male householders: 7,441 (2,629 living alone ), Female householders: 6,500 (2,430 living alone )3,704 spouses (3,678 opposite-sex spouses ), 859 unmarried partners , (805 opposite-sex unmarried partners ), 4,483 children (3,953 natural , 376 adopted , 153 stepchildren ), 154 grandchildren , 292 brothers or sisters , 335 parents , 0 foster children , 134 other relatives , 6,846 non-relatives In group quarters: 14,900
Size of family households: 2,285 2-persons , 1,125 3-persons , 822 4-persons , 291 5-persons , 135 6-persons , 21 7-or-more-persons .
Size of nonfamily households: 5,447 1-person , 2,498 2-persons , 768 3-persons , 490 4-persons , 159 5-persons , 28 6-persons , 31 7-or-more-persons .
2,812 married couples with children. single-parent households (303 men , 380 women ).
83.5% of residents of East Lansing speak English at home. of residents speak Spanish at home (93% speak English very well , 5% speak English well , 2% speak English not well , 1% don't speak English at all ).of residents speak other Indo-European language at home (87% speak English very well , 7% speak English well , 6% speak English not well ).of residents speak Asian or Pacific Island language at home (58% speak English very well , 26% speak English well , 10% speak English not well , 5% don't speak English at all ).of residents speak other language at home (75% speak English very well , 23% speak English well , 2% speak English not well ).
Foreign born population: 4,923 (10.8%)of them are naturalized citizens )
Median number of rooms in houses and condos:
Median number of rooms in apartments
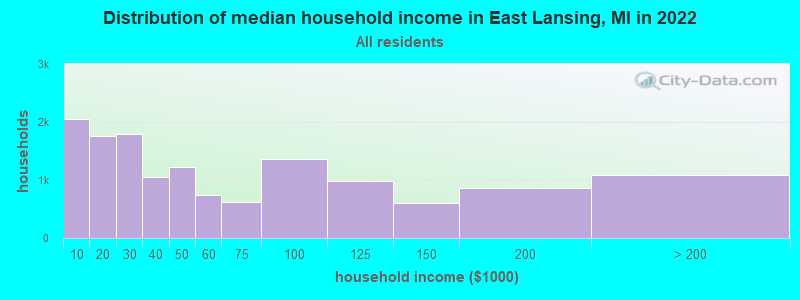
East Lansing, MI household income distribution 2,056 Less than $10,0001,766 $10,000 to $19,9991,788 $20,000 to $29,9991,047 $30,000 to $39,9991,225 $40,000 to $49,999733 $50,000 to $59,999629 $60,000 to $74,9991,356 $75,000 to $99,999989 $100,000 to $124,999599 $125,000 to $149,999868 $150,000 to $199,9991,087 $200,000 or more
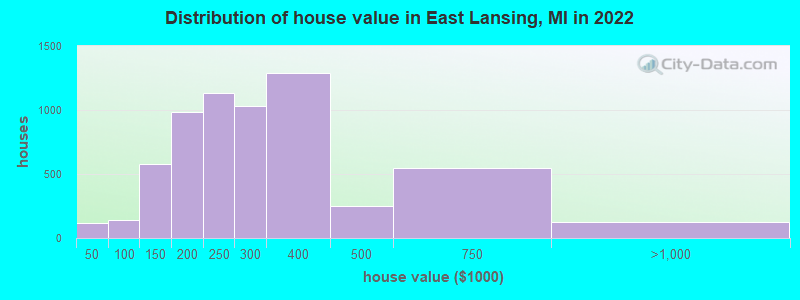
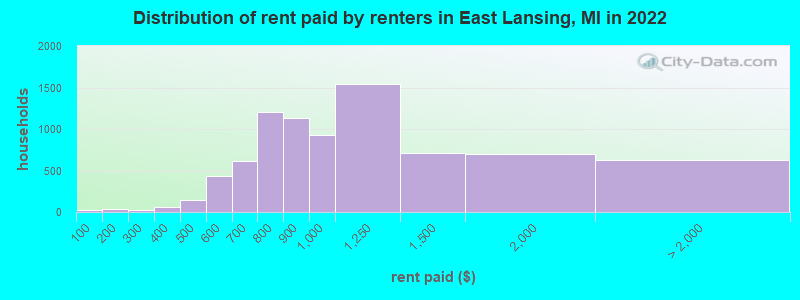
Home value of owner - occupied houses in 2022 in East Lansing, MI 35 Less than $10,00015 $15,000 to $19,99956 $20,000 to $24,99913 $40,000 to $49,99912 $50,000 to $59,99917 $60,000 to $69,99911 $70,000 to $79,99917 $80,000 to $89,99962 $90,000 to $99,999314 $100,000 to $124,999267 $125,000 to $149,999565 $150,000 to $174,999420 $175,000 to $199,9991,131 $200,000 to $249,9991,033 $250,000 to $299,9991,288 $300,000 to $399,999248 $400,000 to $499,999548 $500,000 to $749,999118 $750,000 to $999,9995 $1,000,000 to $1,499,999Rent paid by renters in 2022 in East Lansing, MI 21 Less than $1005 $100 to $14931 $150 to $1999 $200 to $24912 $250 to $29943 $300 to $34919 $350 to $39989 $400 to $44959 $450 to $499360 $500 to $54969 $550 to $599367 $600 to $649248 $650 to $699665 $700 to $749543 $750 to $7991,135 $800 to $899933 $900 to $9991,544 $1,000 to $1,249707 $1,250 to $1,499694 $1,500 to $1,999261 $2,000 to $2,49985 $2,500 to $2,999133 $3,500 or more149 No cash rent
Percentage of workers working in this county: 86.3%Number of people working at home: 4,490 (20.0% of all workers )
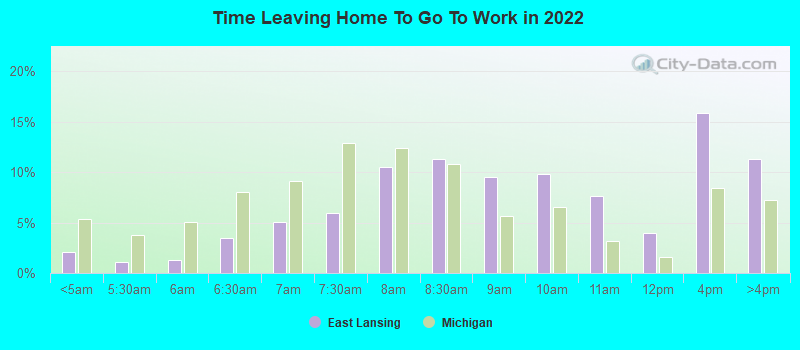
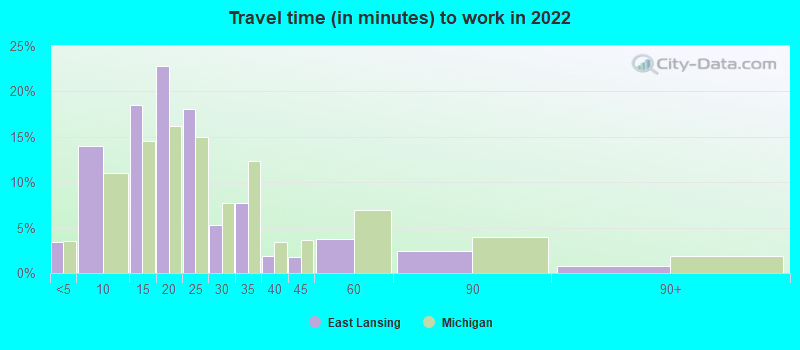
Travel time to work (commute)
Less than 5 minutes: 8475 to 9 minutes: 4,19610 to 14 minutes: 4,31615 to 19 minutes: 4,15320 to 24 minutes: 2,50725 to 29 minutes: 36130 to 34 minutes: 58235 to 39 minutes: 18840 to 44 minutes: 23145 to 59 minutes: 21260 to 89 minutes: 42990 or more minutes: 188
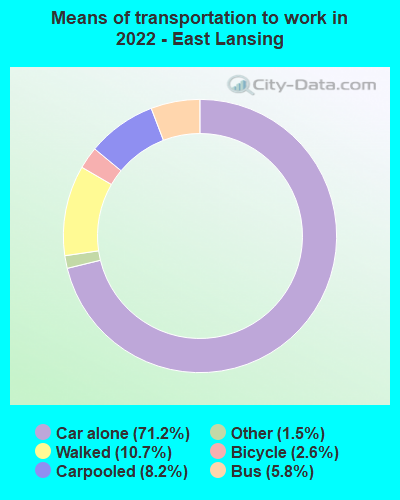
Means of transportation to work:
Drove a car alone: 24,204 (61.7%)Carpooled: 2,577 (6.6%)Bus : 1,633 (4.2%)Light rail, streetcar or trolley : 3 (0.0%)Taxi: 723 (1.8%)Bicycle: 1,757 (4.5%)Walked: 4,749 (12.1%)Worked at home: 4,490 (11.4%)
Unemployment by race in 2022
Unemployment rate for White non-Hispanic residents 5.2% Males4.5% FemalesUnemployment rate for Black residents 15.8% Males6.7% FemalesUnemployment rate for Asian residents 3.9% Males4.2% FemalesUnemployment rate for other race residents 11.6% FemalesUnemployment rate for two or more race residents 5.9% Males2.2% FemalesUnemployment rate for Hispanic or Latino residents 2.4% Males3.7% Females
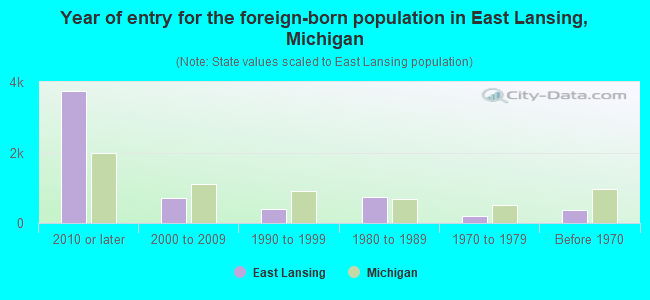
Year of entry for the foreign-born population in East Lansing, Michigan
3,744 2010 or later 697 2000 to 2009 408 1990 to 1999 742 1980 to 1989 205 1970 to 1979 356 Before 1970
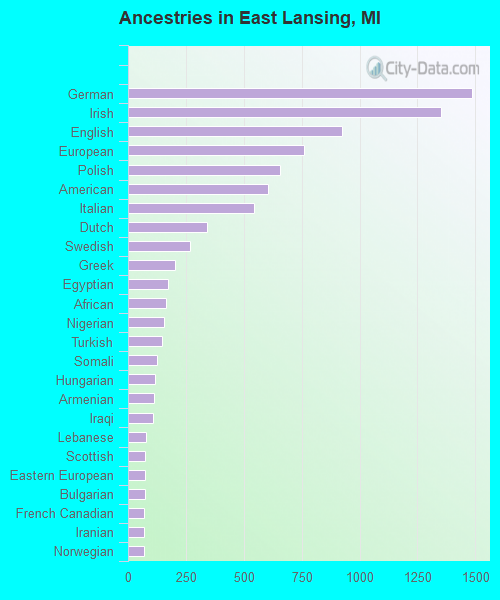
First ancestries reported:
German: 1,485 (9.2%)
Irish: 1,353 (8.4%)
English: 925 (5.7%)
European: 760 (4.7%)
Polish: 655 (4.1%)
American: 603 (3.7%)
Italian: 543 (3.4%)
Dutch: 341 (2.1%)
Swedish: 269 (1.7%)
Greek: 203 (1.3%)
Egyptian: 173 (1.1%)
African: 165 (1.0%)
Nigerian: 154 (1.0%)
Turkish: 146 (0.9%)
Somali: 125 (0.8%)
Hungarian: 115 (0.7%)
Armenian: 112 (0.7%)
Iraqi: 109 (0.7%)
Lebanese: 77 (0.5%)
Scottish: 75 (0.5%)
Eastern European: 75 (0.5%)
Bulgarian: 72 (0.4%)
French Canadian: 71 (0.4%)
Iranian: 70 (0.4%)
Norwegian: 68 (0.4%)
Ethiopian: 66 (0.4%)
Danish: 66 (0.4%)
British: 60 (0.4%)
French: 47 (0.3%)
Finnish: 46 (0.3%)
Serbian: 44 (0.3%)
Ukrainian: 44 (0.3%)
Russian: 40 (0.2%)
Scotch-Irish: 40 (0.2%)
Australian: 37 (0.2%)
Romanian: 34 (0.2%)
Jordanian: 34 (0.2%)
Ghanaian: 34 (0.2%)
Scandinavian: 31 (0.2%)
Assyrian: 29 (0.2%)
Palestinian: 26 (0.2%)
Canadian: 24 (0.1%)
Lithuanian: 21 (0.1%)
Brazilian: 19 (0.1%)
Swiss: 17 (0.1%)
Austrian: 14 (0.09%)
Yugoslavian: 14 (0.09%)
Czech: 12 (0.07%)
Albanian: 11 (0.07%)
Belgian: 10 (0.06%)
Portuguese: 10 (0.06%)
Latvian: 10 (0.06%)
Cypriot: 5 (0.03%)
Macedonian: 4 (0.02%)
Northern European: 4 (0.02%)
Most common places of birth for foreign-born residents (%): China, excluding Hong Kong and Taiwan East Lansing:
28.4% (1,439)Michigan:
4.9% (34,295)
India East Lansing:
7.3% (372)Michigan:
11.1% (77,240)
Korea East Lansing:
5.7% (288)Michigan:
3.0% (20,884)
Egypt East Lansing:
3.9% (197)Michigan:
0.6% (3,827)
United Arab Emirates East Lansing:
2.9% (149)Michigan:
0.1% (716)
Canada East Lansing:
2.6% (133)Michigan:
5.0% (35,052)
Ghana East Lansing:
2.3% (118)Michigan:
0.3% (1,811)
Japan East Lansing:
2.3% (116)Michigan:
1.5% (10,225)
Mexico East Lansing:
2.2% (114)Michigan:
10.9% (75,965)
Turkey East Lansing:
2.1% (108)Michigan:
0.2% (1,569)
Other Western Asia East Lansing:
2.1% (107)Michigan:
0.1% (791)
Germany East Lansing:
1.9% (94)Michigan:
2.3% (16,126)
Other Western Africa East Lansing:
1.8% (89)Michigan:
0.1% (672)
Somalia East Lansing:
1.6% (83)Michigan:
0.1% (1,042)
Argentina East Lansing:
1.6% (82)Michigan:
0.2% (1,346)
Place of birth for U.S.-born residents:
This state: 29,079Other state: 10,966Northeast: 2,195Midwest: 4,489South: 2,383West: 1,992 56.6% of East Lansing residents lived in the same house 1 years ago.
Out of people who lived in different houses, 27.5% lived in this county.
Out of people who lived in different counties, 76.6% lived in Michigan.
East Lansing:
56.6%State average:
88.4%
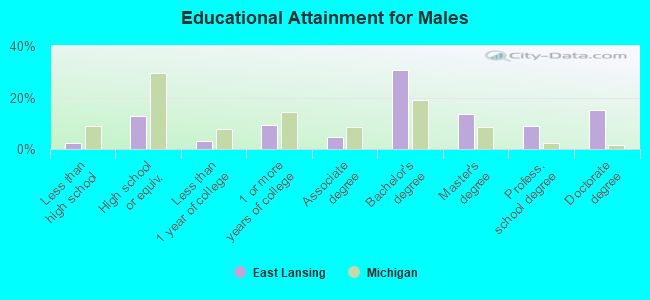
Education attainment for males 25 years and older:
No schooling: 35Nursery to 4th grade: 05th and 6th grade: 147th and 8th grade: 209th grade: 1610th grade: 4111th grade: 012th grade, no diploma: 41High school graduate (or equivalency): 922Less than 1 year of college: 215Some college more than 1 year, no degree: 660Associate degree: 349Bachelor's degree: 2,198Master's degree: 976Professional school degree: 632Doctorate degree: 1,087
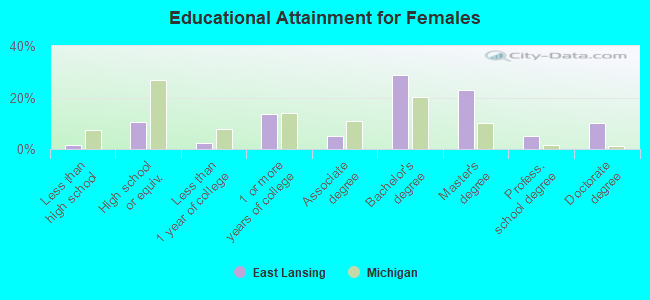
Education attainment for females 25 years and older:
No schooling: 4Nursery to 4th grade: 05th and 6th grade: 17th and 8th grade: 79th grade: 1210th grade: 5511th grade: 1412th grade, no diploma: 20High school graduate (or equivalency): 786Less than 1 year of college: 166Some college more than 1 year, no degree: 1,019Associate degree: 382Bachelor's degree: 2,152Master's degree: 1,729Professional school degree: 389Doctorate degree: 758
Housing units in structures:
One, detached: 5,763One, attached: 1,066Two: 3873 or 4: 6915 to 9: 1,83410 to 19: 2,56420 to 49: 2,05650 or more: 1,448Mobile homes: 41Housing units lacking complete plumbing facilities in 2022: 1.7%Housing units lacking complete kitchen facilities in 2022: 2.7%House/condo owner moved in on average 8 years ago
Renter moved in on average 0 years ago
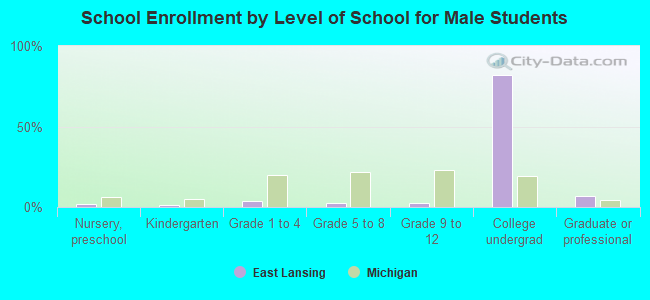
Private vs. public school enrollment:
Students in private schools in grades 1 to 8 (elementary and middle school): 299 Students in private schools in grades 9 to 12 (high school): 29 Students in private undergraduate colleges: 1,642