East Petersburg, PA (Pennsylvania) Houses and Residents
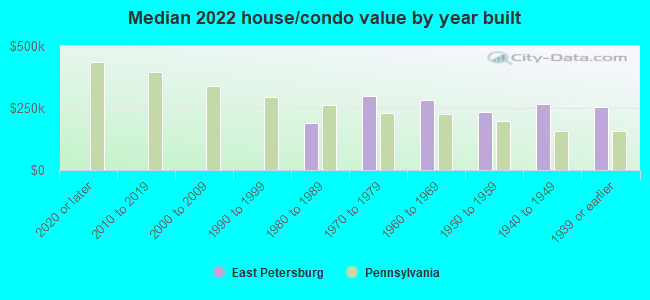
| East Petersburg: | $251,354 |
| Pennsylvania: | $245,500 |
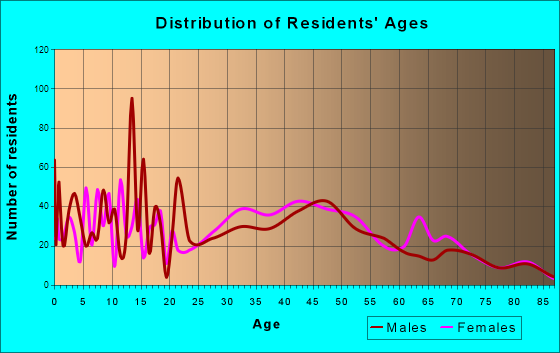
Total population: 4,518 (All urban)
Houses: 1,944 (1,944 occupied: 1,705 owner occupied, 245 renter occupied)
| % of renters here: | 13% |
| State: | 31% |
Housing density: 1,611 houses/condos per square mile
Median price asked for vacant for-sale houses and condos in 2022 in this county: $323,895.
Median contract rent in 2022: $1,110 (lower quartile is $959, upper quartile is $1,236)
Median rent asked for vacant for-rent units in 2022: $1,106
Median gross rent in East Petersburg, PA in 2022: $1,262
Housing units in East Petersburg with a mortgage: 1,125 (204 second mortgage, 0 home equity loan, 193 both second mortgage and home equity loan)
Houses without a mortgage: 161
Median household income for houses/condos with a mortgage: $92,093
Median household income for apartments without a mortgage: $81,321
Median monthly housing costs: $1,308
Compare current foreclosures near East Petersburg, PA:
| Photo | Address | Area | Beds / Baths | Price | Details |
|---|---|---|---|---|---|

|
#1
Parkside Ct
Mount Joy, PA 17552
|
1,540 sq. feet
|
2 baths 3 beds |
show details | |

|
#2
E High St
Elizabethtown, PA 17022
|
1,270 sq. feet
|
1 baths 3 beds |
show details | |

|
#3
Old Hershey Rd
Elizabethtown, PA 17022
|
1,200 sq. feet
|
1 baths 3 beds |
show details | |

|
#4
E Main St
Lititz, PA 17543
|
1,908 sq. feet
|
2 baths 3 beds |
show details | |

|
#5
Cedar Ter
Columbia, PA 17512
|
1,065 sq. feet
|
1 baths 4 beds |
show details | |

|
#6
Hartwell Ct
Lancaster, PA 17601
|
2,975 sq. feet
|
4 baths 4 beds |
show details | |

|
#7
Jackson St
Lancaster, PA 17603
|
960 sq. feet
|
1 baths 3 beds |
show details | |

|
#8
N King St
Denver, PA 17517
|
1,188 sq. feet
|
1 baths 3 beds |
show details | |

|
#9
Apache Ln
Wrightsville, PA 17368
|
4,267 sq. feet
|
2 baths 4 beds |
show details | |

|
#10
Beech St
Denver, PA 17517
|
1,482 sq. feet
|
3 baths 3 beds |
show details |
| Photo | Address | Area | Beds / Baths | Price | Details |
|---|---|---|---|---|---|

|
#11
E Ross St
Lancaster, PA 17602
|
1,530 sq. feet
|
1 baths 3 beds |
show details | |

|
#12
Crosswinds Dr
Lititz, PA 17543
|
1,296 sq. feet
|
1 baths 3 beds |
show details | |

|
#13
N 3rd St
Columbia, PA 17512
|
1,449 sq. feet
|
1 baths 3 beds |
show details | |

|
#14
Woodcrest Dr
Conestoga, PA 17516
|
1,624 sq. feet
|
1 baths 3 beds |
show details | |

|
#15
N Market St
Elizabethtown, PA 17022
|
1,656 sq. feet
|
1 baths 3 beds |
show details | |

|
#16
Tanger St
Marietta, PA 17547
|
1,352 sq. feet
|
1 baths 3 beds |
show details | |

|
#17
Penn St
Washington Boro, PA 17582
|
1,256 sq. feet
|
1 baths 3 beds |
show details | |

|
#18
Edgewood Dr
Lititz, PA 17543
|
1,944 sq. feet
|
1 baths 3 beds |
show details | |

|
#19
S Custer Ave
New Holland, PA 17557
|
3,503 sq. feet
|
2 baths 4 beds |
show details | |

|
#20
W Chestnut St
Lancaster, PA 17603
|
2,002 sq. feet
|
2 baths 4 beds |
show details |
| Photo | Address | Area | Beds / Baths | Price | Details |
|---|---|---|---|---|---|

|
#21
E Jackson St
New Holland, PA 17557
|
1,464 sq. feet
|
1 baths 4 beds |
show details | |

|
#22
Glenn Rd
Lancaster, PA 17601
|
1,924 sq. feet
|
1 baths 4 beds |
show details | |

|
#23
Rockridge Rd
Paradise, PA 17562
|
1,314 sq. feet
|
3 baths 3 beds |
show details | |

|
#24
Grandview Cir
Mount Joy, PA 17552
|
1,060 sq. feet
|
1 baths 2 beds |
show details | |

|
#25
School Ln
Landisville, PA 17538
|
1,560 sq. feet
|
2 baths 4 beds |
show details | |

|
#26
Manheim St
Mount Joy, PA 17552
|
1,100 sq. feet
|
1 baths 2 beds |
show details | |

|
#27
Mechanic St
Reinholds, PA 17569
|
1,636 sq. feet
|
1 baths 3 beds |
show details | |

|
#28
Groffdale Rd
Quarryville, PA 17566
|
1,292 sq. feet
|
1 baths 3 beds |
show details | |

|
#29
S 9th St
Lebanon, PA 17042
|
3,291 sq. feet
|
2 baths 6 beds |
show details | |

|
#30
W Brubaker Valley Rd
Lititz, PA 17543
|
2,820 sq. feet
|
2 baths 3 beds |
show details |
| Photo | Address | Area | Beds / Baths | Price | Details |
|---|---|---|---|---|---|

|
#31
Cloverton Dr
Columbia, PA 17512
|
922 sq. feet
|
1 baths 2 beds |
show details | |

|
#32
Knoll Dr
Mount Joy, PA 17552
|
1,240 sq. feet
|
1 baths 3 beds |
show details | |

|
#33
1/2 Coral St
Lancaster, PA 17603
|
1,206 sq. feet
|
1 baths 3 beds |
show details | |

|
#34
Asbury Ct
Mount Wolf, PA 17347
|
1,904 sq. feet
|
2 baths 3 beds |
show details | |

|
#35
Gregg Cir
Ephrata, PA 17522
|
1,100 sq. feet
|
1 baths 3 beds |
show details | |

|
#36
E River Dr
Wrightsville, PA 17368
|
1,836 sq. feet
|
2 baths 2 beds |
show details | |

|
#37
Morgan Dr
Leola, PA 17540
|
896 sq. feet
|
1 baths 2 beds |
show details | |

|
#38
Reagan Dr
Ephrata, PA 17522
|
2,157 sq. feet
|
2 baths 4 beds |
show details | |

|
#39
Marion Ter
Ephrata, PA 17522
|
1,217 sq. feet
|
1 baths 3 beds |
show details | |

|
#40
Lemon St # B
Wrightsville, PA 17368
|
1,440 sq. feet
|
1 baths 3 beds |
show details |
| Photo | Address | Area | Beds / Baths | Price | Details |
|---|---|---|---|---|---|

|
#41
E River Dr
Wrightsville, PA 17368
|
1,836 sq. feet
|
2 baths 2 beds |
show details | |

|
#42
Chestnut St
Wrightsville, PA 17368
|
1,760 sq. feet
|
1 baths 3 beds |
show details | |

|
#43
Elizabethtown Rd
Elizabethtown, PA 17022
|
2,556 sq. feet
|
2 baths 4 beds |
show details | |

|
#44
Fishermans Ln
Wrightsville, PA 17368
|
1,097 sq. feet
|
1 baths 3 beds |
show details | |

|
#45
River Corner Rd
Conestoga, PA 17516
|
1,248 sq. feet
|
2 baths 3 beds |
show details | |

|
#46
Westpointe Dr
Ephrata, PA 17522
|
1,488 sq. feet
|
1 baths 2 beds |
show details | |

|
#47
Woodcrest Dr
Conestoga, PA 17516
|
1,936 sq. feet
|
1 baths 3 beds |
show details | |

|
#48
Dogwood Ln
Willow Street, PA 17584
|
1,349 sq. feet
|
1 baths 3 beds |
show details | |

|
#49
E Walnut St
Ephrata, PA 17522
|
1,976 sq. feet
|
2 baths 3 beds |
show details | |

|
Check over 1 million property listings on Foreclosure.com!
|
browse all offers | |||


 | Traditions of America in Lancaster (1 reply) |
| Traditions of America (4 replies) |
| job in Manheim - need to relocate (5 replies) |
| Young Adult Moving to Lancaster Area (2 replies) |
| Are people from Lancaster County on here? (42 replies) |
| Lancaster Area-Park City Mall (3 replies) |
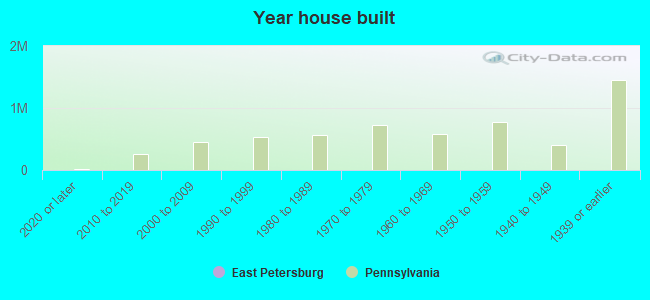
Median year apartment built: 1955
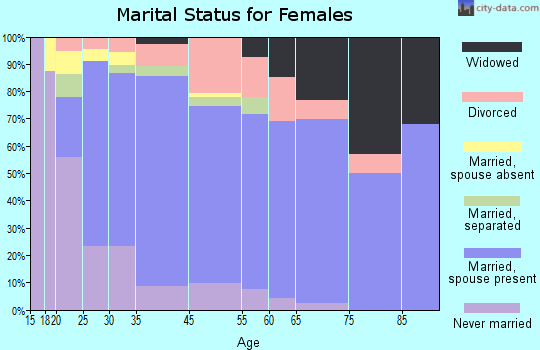
Household type by relationship:
Households: 4,616- Male householders: 912 (250 living alone), Female householders: 1,022 (221 living alone)
1,220 spouses (1,220 opposite-sex spouses), 66 unmarried partners, (66 opposite-sex unmarried partners), 1,089 children (1,089 natural, 0 adopted, 0 stepchildren), 114 grandchildren, 14 brothers or sisters, 0 parents, 0 foster children, 95 other relatives, 65 non-relatives
- In group quarters: 15
Size of family households: 671 2-persons, 252 3-persons, 311 4-persons, 100 5-persons, 51 6-persons.
Size of nonfamily households: 490 1-person, 58 2-persons.
741 married couples with children.
113 single-parent households (37 men, 76 women).
93.9% of residents of East Petersburg speak English at home.
4.1% of residents speak Spanish at home (100% speak English very well).
0.3% of residents speak other Indo-European language at home (100% speak English well).
1.7% of residents speak other language at home (100% speak English very well).
Foreign born population: 150 (3.2%)
(62.0% of them are naturalized citizens)
| Here: | 6.9 |
| State: | 6.8 |
| Here: | 4.9 |
| State: | 4.3 |
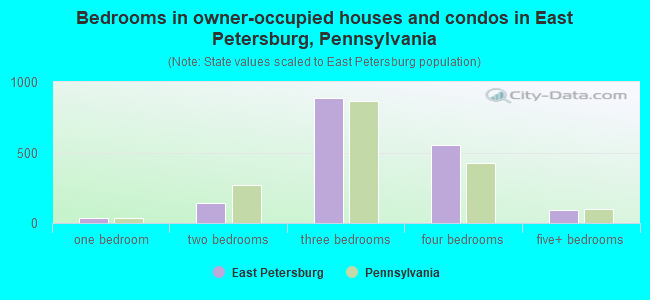
- Bedrooms in owner-occupied houses and condos in East Petersburg, Pennsylvania
- 0no bedroom
- 321 bedroom
- 1402 bedrooms
- 8893 bedrooms
- 5534 bedrooms
- 915+ bedrooms
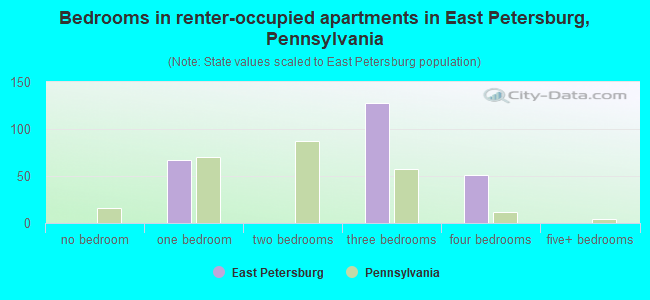
- Bedrooms in renter-occupied apartments in East Petersburg, Pennsylvania
- 0no bedroom
- 671 bedroom
- 02 bedrooms
- 1283 bedrooms
- 514 bedrooms
- 05+ bedrooms
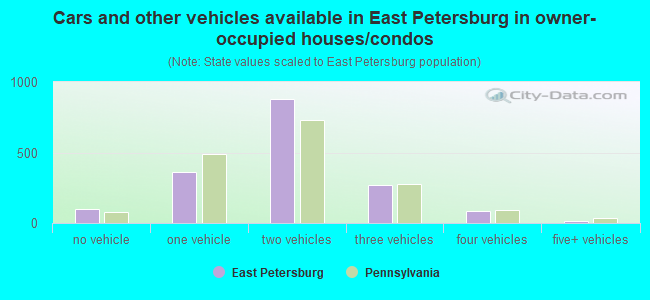
- Cars and other vehicles available in East Petersburg in owner-occupied houses/condos
- 98no vehicle
- 3611 vehicle
- 8792 vehicles
- 2703 vehicles
- 844 vehicles
- 135+ vehicles
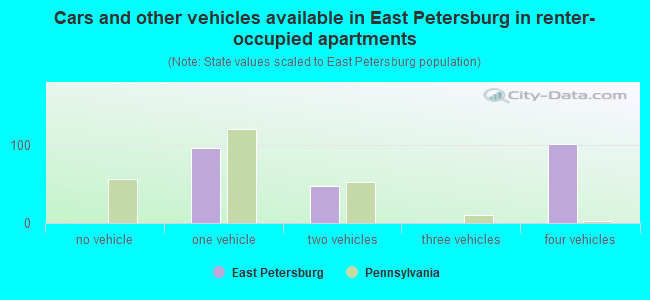
- Cars and other vehicles available in East Petersburg in renter-occupied apartments
- 0no vehicle
- 961 vehicle
- 472 vehicles
- 03 vehicles
- 1024 vehicles
- 05+ vehicles
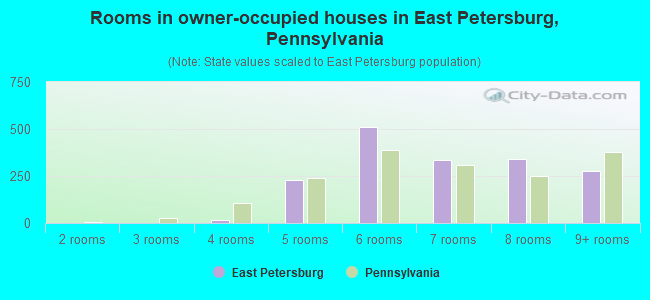
- Rooms in owner-occupied houses in East Petersburg, Pennsylvania
- 01 room
- 02 rooms
- 03 rooms
- 164 rooms
- 2275 rooms
- 5096 rooms
- 3347 rooms
- 3438 rooms
- 2769+ rooms
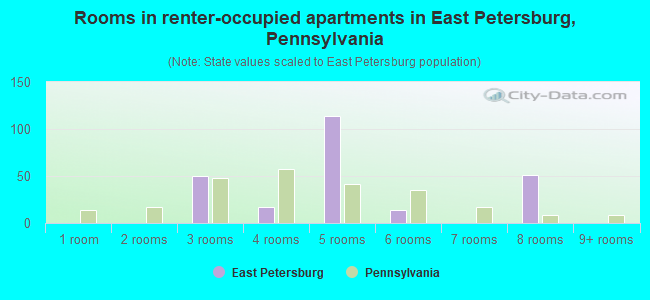
- Rooms in renter-occupied apartments in East Petersburg, Pennsylvania
- 01 room
- 02 rooms
- 503 rooms
- 174 rooms
- 1145 rooms
- 146 rooms
- 07 rooms
- 518 rooms
- 09+ rooms
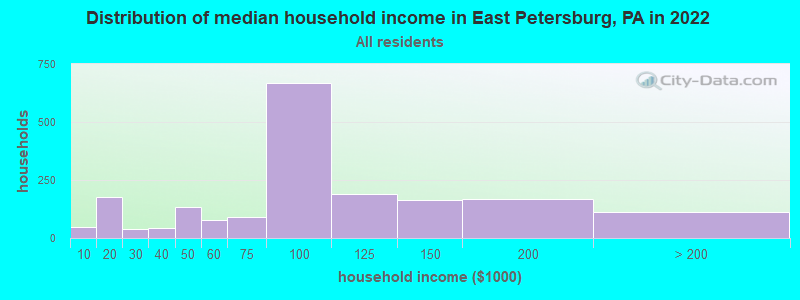
East Petersburg, PA household income distribution

- 48Less than $10,000
- 177$10,000 to $19,999
- 39$20,000 to $29,999
- 44$30,000 to $39,999
- 135$40,000 to $49,999
- 79$50,000 to $59,999
- 90$60,000 to $74,999
- 667$75,000 to $99,999
- 188$100,000 to $124,999
- 163$125,000 to $149,999
- 168$150,000 to $199,999
- 112$200,000 or more
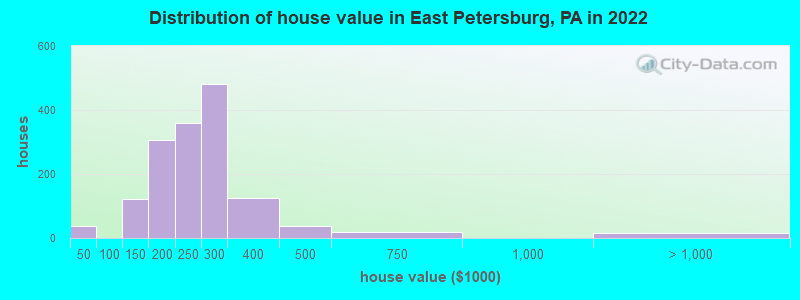
Home value of owner - occupied houses in 2022 in East Petersburg, PA
-
- 17Less than $10,000
- 20$20,000 to $24,999
- 67$100,000 to $124,999
- 53$125,000 to $149,999
- 132$150,000 to $174,999
- 174$175,000 to $199,999
- 359$200,000 to $249,999
- 481$250,000 to $299,999
- 126$300,000 to $399,999
- 35$400,000 to $499,999
- 19$500,000 to $749,999
- 15$2,000,000 or more
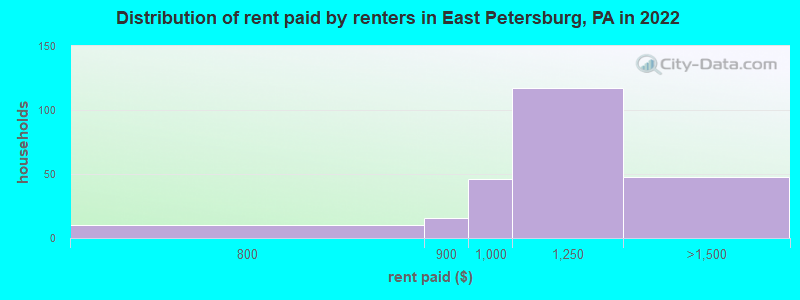
Rent paid by renters in 2022 in East Petersburg, PA
-
- 10$750 to $799
- 16$800 to $899
- 45$900 to $999
- 117$1,000 to $1,249
- 47$1,250 to $1,499
Percentage of workers working in this county: 91.6%
Number of people working at home: 204 (7.4% of all workers)
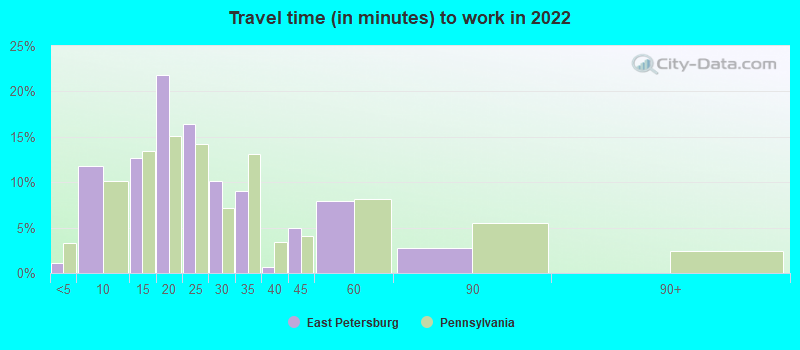
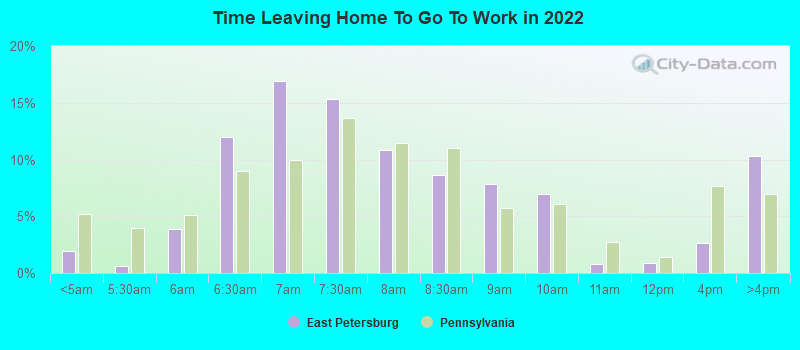
Travel time to work (commute)
- Less than 5 minutes: 16
- 5 to 9 minutes: 156
- 10 to 14 minutes: 657
- 15 to 19 minutes: 581
- 20 to 24 minutes: 513
- 25 to 29 minutes: 147
- 30 to 34 minutes: 244
- 35 to 39 minutes: 151
- 40 to 44 minutes: 0
- 45 to 59 minutes: 67
- 60 to 89 minutes: 8
- 90 or more minutes: 39
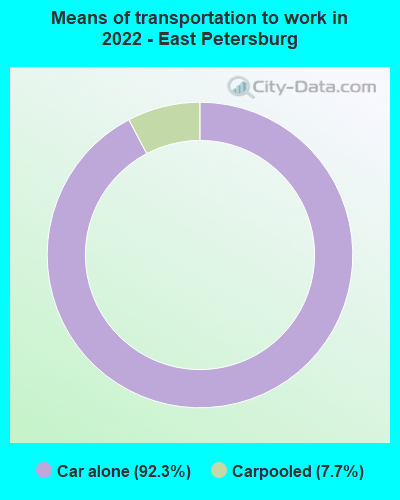
Means of transportation to work:
- Drove a car alone: 1,188 (78.7%)
- Carpooled: 97 (6.4%)
- Worked at home: 204 (13.5%)
- Unemployment by race in 2022
- Unemployment rate for White non-Hispanic residents
- 0.6%Males
- 4.4%Females
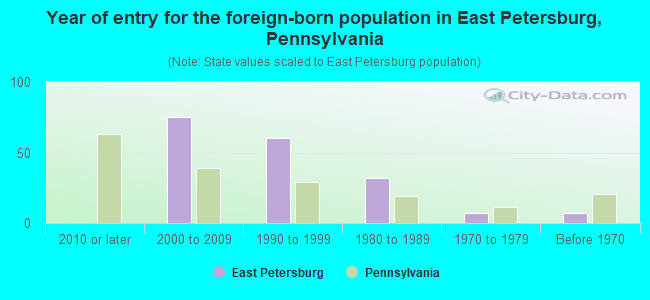
- Year of entry for the foreign-born population in East Petersburg, Pennsylvania
- 02010 or later
- 762000 to 2009
- 601990 to 1999
- 321980 to 1989
- 71970 to 1979
- 7Before 1970
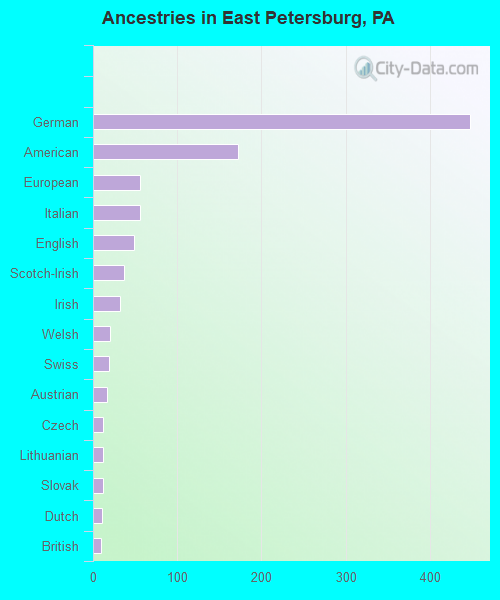
First ancestries reported:
- German: 448 (32.9%)
- American: 172 (12.6%)
- European: 56 (4.1%)
- Italian: 56 (4.1%)
- English: 49 (3.6%)
- Scotch-Irish: 37 (2.7%)
- Irish: 32 (2.4%)
- Welsh: 20 (1.5%)
- Swiss: 19 (1.4%)
- Austrian: 17 (1.2%)
- Czech: 12 (0.9%)
- Lithuanian: 12 (0.9%)
- Slovak: 12 (0.9%)
- Dutch: 11 (0.8%)
- British: 10 (0.7%)
Most common places of birth for foreign-born residents (%):
| East Petersburg: | 69.6% (128) |
| Pennsylvania: | 0.1% (687) |
| East Petersburg: | 10.9% (20) |
| Pennsylvania: | 0.4% (4,113) |
| East Petersburg: | 8.2% (15) |
| Pennsylvania: | 0.5% (4,424) |
| East Petersburg: | 8.2% (15) |
| Pennsylvania: | 1.8% (17,032) |
Place of birth for U.S.-born residents:
- This state: 3,453
- Other state: 919
- Northeast: 517
- Midwest: 98
- South: 241
- West: 75
95.9% of East Petersburg residents lived in the same house 1 years ago.
Out of people who lived in different houses, 44.2% lived in this county.
Out of people who lived in different counties, 100.0% lived in Pennsylvania.
| East Petersburg: | 95.9% |
| State average: | 89.3% |
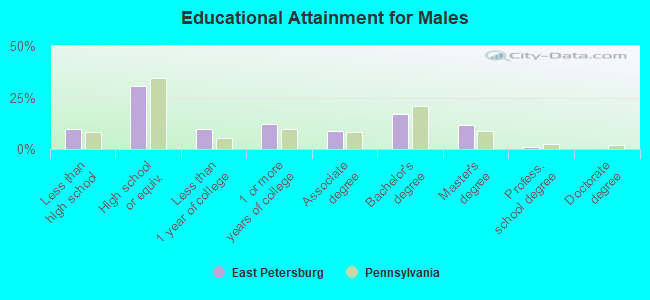
Education attainment for males 25 years and older:
- No schooling: 0
- Nursery to 4th grade: 0
- 5th and 6th grade: 0
- 7th and 8th grade: 28
- 9th grade: 18
- 10th grade: 45
- 11th grade: 58
- 12th grade, no diploma: 25
- High school graduate (or equivalency): 558
- Less than 1 year of college: 176
- Some college more than 1 year, no degree: 218
- Associate degree: 158
- Bachelor's degree: 314
- Master's degree: 209
- Professional school degree: 16
- Doctorate degree: 0
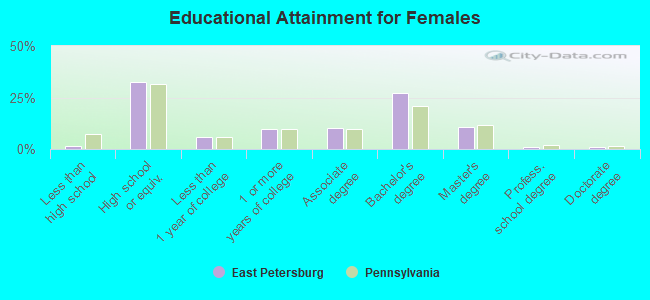
Education attainment for females 25 years and older:
- No schooling: 2
- Nursery to 4th grade: 0
- 5th and 6th grade: 0
- 7th and 8th grade: 0
- 9th grade: 0
- 10th grade: 0
- 11th grade: 13
- 12th grade, no diploma: 15
- High school graduate (or equivalency): 576
- Less than 1 year of college: 108
- Some college more than 1 year, no degree: 175
- Associate degree: 182
- Bachelor's degree: 486
- Master's degree: 187
- Professional school degree: 21
- Doctorate degree: 18
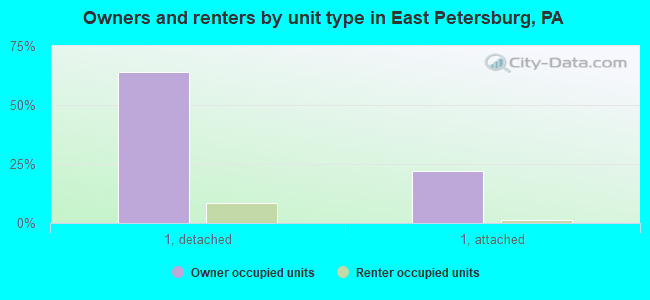
Housing units in structures:
- One, detached: 1,426
- One, attached: 432
- Two: 17
- 3 or 4: 49
- Mobile homes: 18
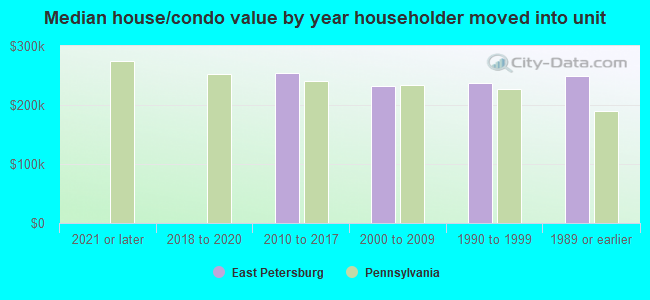
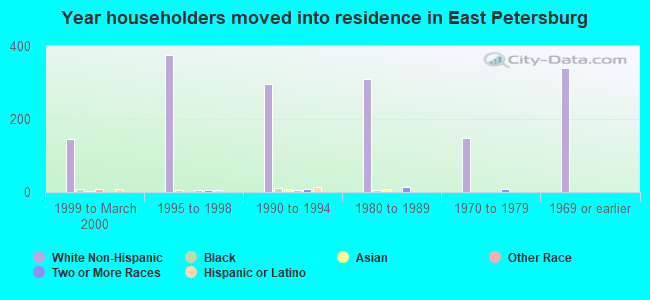
House/condo owner moved in on average 21 years ago
Renter moved in on average 7 years ago
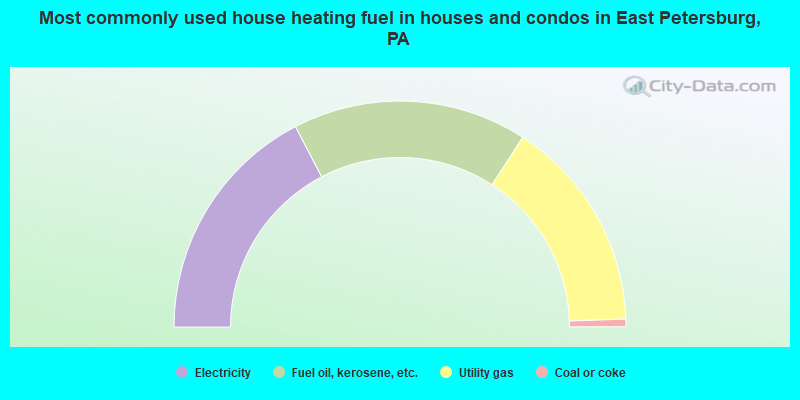
- 34.7%Electricity
- 33.6%Fuel oil, kerosene, etc.
- 30.6%Utility gas
- 1.1%Coal or coke
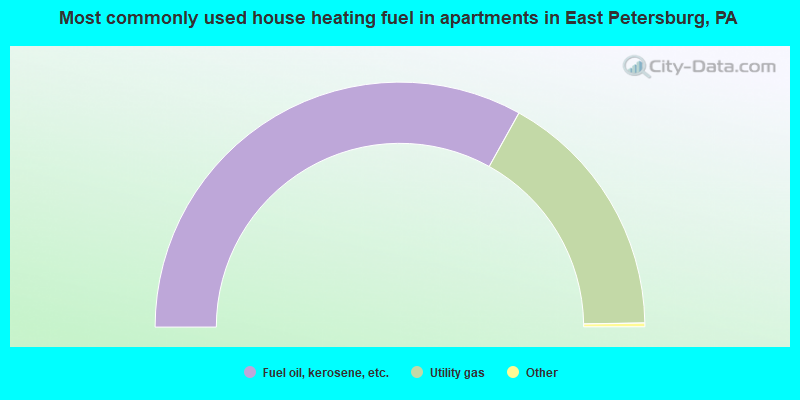
- 66.5%Fuel oil, kerosene, etc.
- 33.5%Utility gas
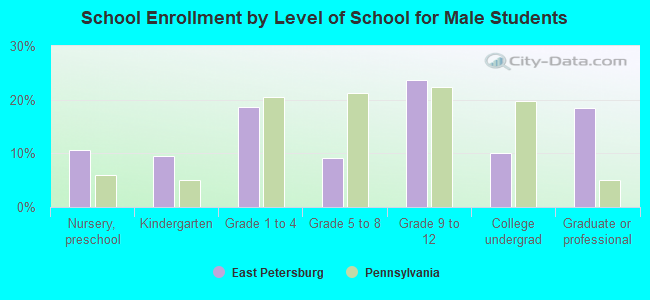
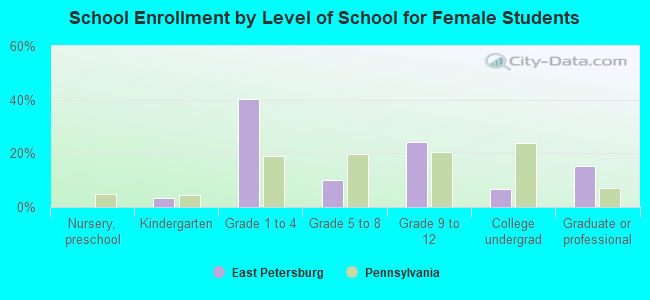
Private vs. public school enrollment:
| Here: | 20.5% |
| Pennsylvania: | 15.7% |
| Here: | 0.4% |
| Pennsylvania: | 13.4% |
| Here: | 0.0% |
| Pennsylvania: | 39.8% |