Easton, PA (Pennsylvania) Houses and Residents
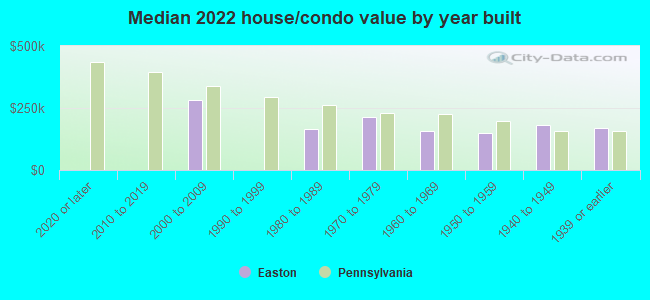
| Easton: | $165,629 |
| Pennsylvania: | $245,500 |
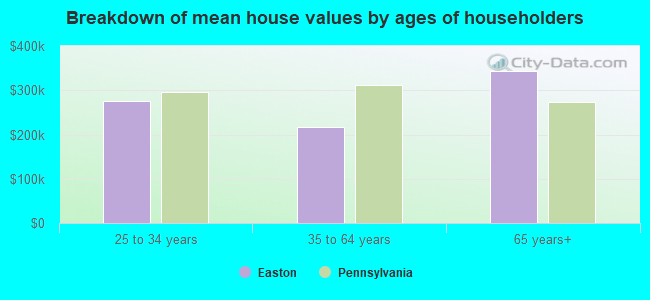
Mean price in 2022:
Detached houses: $301,886
Here: $301,886 State: $317,202 Townhouses or other attached units: $175,261
Here: $175,261 State: $254,369 In 2-unit structures: $186,668
Here: $186,668 State: $249,182 In 3-to-4-unit structures: $269,362
Here: $269,362 State: $297,446 In 5-or-more-unit structures: $126,717
Here: $126,717 State: $320,068
Total population: 27,052 (Urban population: 26,263, Rural population: 0)
Houses: 11,656 (10,597 occupied: 4,918 owner occupied, 5,633 renter occupied)
| % of renters here: | 53% |
| State: | 31% |
Housing density: 2,738 houses/condos per square mile
Median price asked for vacant for-sale houses and condos in 2022: $233,682.
Median contract rent in 2022: $1,045 (lower quartile is $838, upper quartile is $1,269)
Median rent asked for vacant for-rent units in 2022: $1,610
Median gross rent in Easton, PA in 2022: $1,209
Housing units in Easton with a mortgage: 2,811 (123 second mortgage, 0 home equity loan, 115 both second mortgage and home equity loan)
Houses without a mortgage: 138
Median household income for houses/condos with a mortgage: $93,857
Median household income for apartments without a mortgage: $59,849
Median monthly housing costs: $1,151
Compare current foreclosures in Easton, PA:
| Photo | Address | Area | Beds / Baths | Price | Details |
|---|---|---|---|---|---|

|
#1
E Wilkes Barre St
Easton, PA 18042
|
1,212 sq. feet
|
1 baths 4 beds |
show details | |

|
#2
Edie Ln
Easton, PA 18045
|
1,092 sq. feet
|
1 baths 4 beds |
show details | |

|
#3
S 13th St
Easton, PA 18042
|
1,488 sq. feet
|
1 baths 4 beds |
show details | |

|
#4
Ferry St
Easton, PA 18042
|
1,854 sq. feet
|
2 baths 5 beds |
show details | |

|
#5
Knollwood Dr
Easton, PA 18042
|
2,196 sq. feet
|
3 baths 3 beds |
show details | |

|
#6
Bushkill Dr
Easton, PA 18042
|
928 sq. feet
|
1 baths 2 beds |
show details | |

|
#7
Freemansburg Ave
Easton, PA 18045
|
1,298 sq. feet
|
1 baths 3 beds |
show details | |

|
#8
Hodle Ave
Easton, PA 18045
|
2,228 sq. feet
|
2 baths 4 beds |
show details | |

|
#9
Spring Water Ct
Easton, PA 18042
|
3,444 sq. feet
|
4 baths 4 beds |
show details | |

|
#10
Washington St
Easton, PA 18042
|
2,187 sq. feet
|
1 baths 2 beds |
show details |
| Photo | Address | Area | Beds / Baths | Price | Details |
|---|---|---|---|---|---|

|
#11
Ferry St
Easton, PA 18042
|
1,830 sq. feet
|
1 baths 3 beds |
show details | |

|
#12
W Wilkes Barre St
Easton, PA 18042
|
1,522 sq. feet
|
1 baths 3 beds |
show details | |

|
#13
W Lincoln St
Easton, PA 18042
|
960 sq. feet
|
1 baths 3 beds |
show details | |

|
#14
Leigh Dr
Easton, PA 18040
|
2,606 sq. feet
|
2 baths 4 beds |
show details | |

|
#15
Gordon Dr
Easton, PA 18045
|
1,872 sq. feet
|
2 baths 4 beds |
show details | |

|
#16
W Berwick St
Easton, PA 18042
|
1,864 sq. feet
|
1 baths 3 beds |
show details | |

|
#17
Clark Pl
Easton, PA 18040
|
2,591 sq. feet
|
2 baths 4 beds |
show details | |

|
#18
Allen St
Easton, PA 18045
|
1,064 sq. feet
|
1 baths 3 beds |
show details | |

|
#19
Pine St
Easton, PA 18042
|
1,158 sq. feet
|
1 baths 3 beds |
show details | |

|
#20
S Nulton Ave
Easton, PA 18045
|
1,816 sq. feet
|
2 baths 3 beds |
show details |
| Photo | Address | Area | Beds / Baths | Price | Details |
|---|---|---|---|---|---|

|
#21
Chianti Pl
Easton, PA 18045
|
1,903 sq. feet
|
2 baths 3 beds |
show details | |

|
#22
S Delaware Dr
Easton, PA 18042
|
955 sq. feet
|
1 baths 2 beds |
show details | |

|
#23
High St
Easton, PA 18042
|
1,836 sq. feet
|
1 baths 3 beds |
show details | |

|
#24
Greenleaf St
Easton, PA 18040
|
2,581 sq. feet
|
2 baths 4 beds |
show details | |

|
#25
Park Ridge Dr
Easton, PA 18040
|
2,488 sq. feet
|
2 baths 3 beds |
show details | |

|
#26
S 17th St
Easton, PA 18042
|
1,549 sq. feet
|
2 baths 3 beds |
show details | |

|
#27
Clark Pl
Easton, PA 18040
|
3,122 sq. feet
|
2 baths 4 beds |
show details | |

|
#28
Ramblewood Dr
Easton, PA 18040
|
1,728 sq. feet
|
2 baths 2 beds |
show details | |

|
#29
Morgan Hill Rd
Easton, PA 18042
|
1,152 sq. feet
|
1 baths 3 beds |
show details | |

|
#30
W Lincoln St
Easton, PA 18042
|
1,235 sq. feet
|
1 baths 2 beds |
show details |
| Photo | Address | Area | Beds / Baths | Price | Details |
|---|---|---|---|---|---|

|
#31
Schaffers Ct
Easton, PA 18042
|
792 sq. feet
|
1 baths 2 beds |
show details | |

|
#32
Magnolia Dr
Easton, PA 18045
|
2,722 sq. feet
|
2 baths 4 beds |
show details | |

|
#33
Victoria Ln
Easton, PA 18045
|
1,456 sq. feet
|
2 baths 3 beds |
show details | |

|
#34
Crown Dr
Easton, PA 18040
|
1,230 sq. feet
|
1 baths 2 beds |
show details | |

|
#35
W Saint Joseph St
Easton, PA 18042
|
1,248 sq. feet
|
1 baths 2 beds |
show details | |

|
#36
N Warren St
Easton, PA 18042
|
1,139 sq. feet
|
1 baths 3 beds |
show details | |

|
#37
Haupt St
Easton, PA 18045
|
936 sq. feet
|
2 baths 2 beds |
show details | |

|
#38
Diehl Rd
Easton, PA 18042
|
1,707 sq. feet
|
1 baths 3 beds |
show details | |

|
#39
Butler St
Easton, PA 18042
|
1,669 sq. feet
|
1 baths 3 beds |
show details | |

|
#40
W Berwick St
Easton, PA 18042
|
1,736 sq. feet
|
1 baths 4 beds |
show details |
| Photo | Address | Area | Beds / Baths | Price | Details |
|---|---|---|---|---|---|

|
#41
Northwood Ave # 2
Easton, PA 18045
|
2,071 sq. feet
|
2 baths 4 beds |
show details | |

|
#42
Philadelphia Rd
Easton, PA 18042
|
1,572 sq. feet
|
1 baths 2 beds |
show details | |

|
#43
Guyton St
Easton, PA 18045
|
2,128 sq. feet
|
1 baths 3 beds |
show details | |

|
#44
Willow Dr
Easton, PA 18045
|
2,352 sq. feet
|
2 baths 3 beds |
show details | |

|
#45
Meadow Lane Dr
Easton, PA 18040
|
2,461 sq. feet
|
2 baths 4 beds |
show details | |

|
#46
Lehigh St
Easton, PA 18042
|
2,030 sq. feet
|
1 baths 6 beds |
show details | |

|
#47
Ruben Ct
Easton, PA 18045
|
2,597 sq. feet
|
3 baths 4 beds |
show details | |

|
#48
Ridge Trl
Easton, PA 18040
|
936 sq. feet
|
1 baths 3 beds |
show details | |

|
#49
Willow Dr
Easton, PA 18045
|
2,265 sq. feet
|
2 baths 3 beds |
show details | |

|
Check over 1 million property listings on Foreclosure.com!
|
browse all offers | |||

Latest news about housing in Easton, PA collected exclusively by city-data.com from local newspapers, TV, and radio stations

 | What's up with the twin houses in Easton? (5 replies) |
| Realtor Recommendations for Easton or Bethlehem? (2 replies) |
| I Went Searching For Apartments Bethlehem yesterday.....Help! (10 replies) |
| Easton Area HS Parents: Insights/Advice (3 replies) |
| Looking at Homes in Easton Area (3 replies) |
| where to look for apartment? may get job in Easton (4 replies) |
Median year apartment built: 1938
Household type by relationship:
Households: 29,271- Male householders: 5,047 (1,806 living alone), Female householders: 5,534 (1,560 living alone)
3,647 spouses (3,514 opposite-sex spouses), 883 unmarried partners, (849 opposite-sex unmarried partners), 7,296 children (6,642 natural, 109 adopted, 545 stepchildren), 987 grandchildren, 294 brothers or sisters, 342 parents, 27 foster children, 709 other relatives, 599 non-relatives
- In group quarters: 3,899
Size of family households: 2,278 2-persons, 1,507 3-persons, 1,082 4-persons, 566 5-persons, 277 6-persons, 295 7-or-more-persons.
Size of nonfamily households: 3,853 1-person, 954 2-persons, 7 3-persons.
1,968 married couples with children.
2,415 single-parent households (476 men, 1,939 women).
79.0% of residents of Easton speak English at home.
18.7% of residents speak Spanish at home (55% speak English very well, 22% speak English well, 18% speak English not well, 5% don't speak English at all).
1.8% of residents speak other Indo-European language at home (55% speak English very well, 40% speak English well, 5% speak English not well).
0.8% of residents speak Asian or Pacific Island language at home (63% speak English very well, 37% speak English well).
0.4% of residents speak other language at home (95% speak English very well, 5% speak English well).
Foreign born population: 4,512 (15.4%)
(52.3% of them are naturalized citizens)
| Here: | 7.0 |
| State: | 6.8 |
| Here: | 3.9 |
| State: | 4.3 |
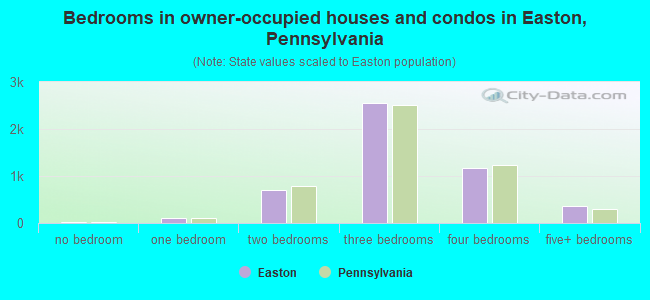
- Bedrooms in owner-occupied houses and condos in Easton, Pennsylvania
- 29no bedroom
- 1081 bedroom
- 7112 bedrooms
- 2,5473 bedrooms
- 1,1684 bedrooms
- 3555+ bedrooms
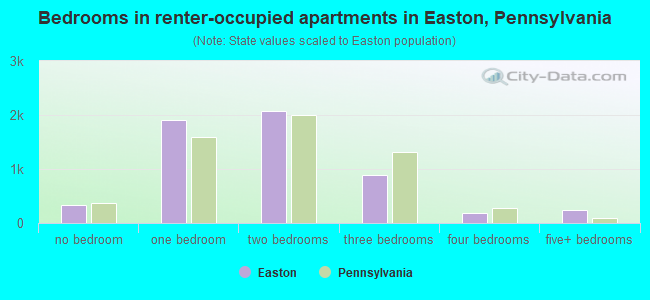
- Bedrooms in renter-occupied apartments in Easton, Pennsylvania
- 340no bedroom
- 1,9091 bedroom
- 2,0762 bedrooms
- 8813 bedrooms
- 1914 bedrooms
- 2375+ bedrooms
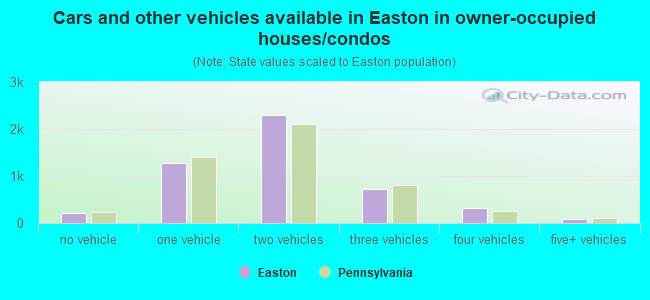
- Cars and other vehicles available in Easton in owner-occupied houses/condos
- 214no vehicle
- 1,2871 vehicle
- 2,2972 vehicles
- 7323 vehicles
- 3114 vehicles
- 775+ vehicles
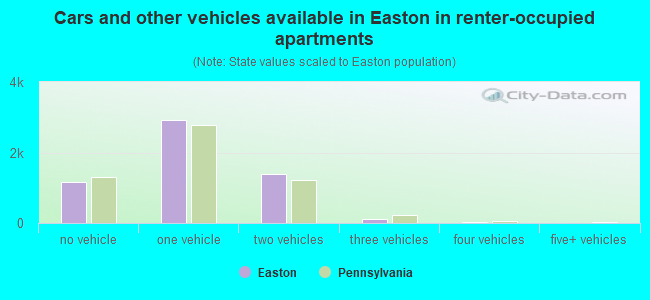
- Cars and other vehicles available in Easton in renter-occupied apartments
- 1,159no vehicle
- 2,9111 vehicle
- 1,3982 vehicles
- 1223 vehicles
- 344 vehicles
- 95+ vehicles
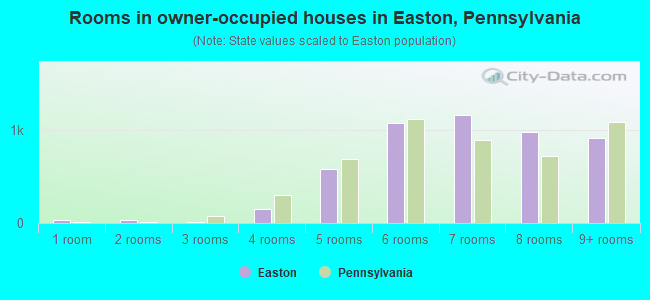
- Rooms in owner-occupied houses in Easton, Pennsylvania
- 291 room
- 322 rooms
- 73 rooms
- 1464 rooms
- 5795 rooms
- 1,0786 rooms
- 1,1627 rooms
- 9748 rooms
- 9109+ rooms
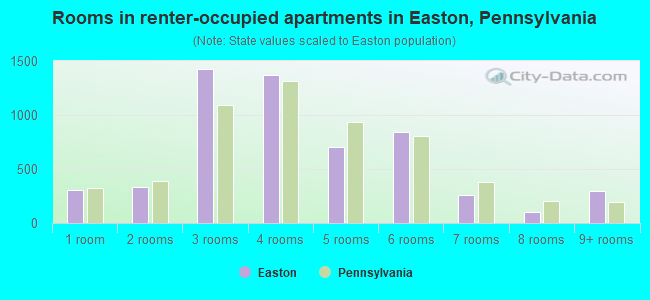
- Rooms in renter-occupied apartments in Easton, Pennsylvania
- 3031 room
- 3302 rooms
- 1,4243 rooms
- 1,3754 rooms
- 7085 rooms
- 8416 rooms
- 2557 rooms
- 1048 rooms
- 2939+ rooms
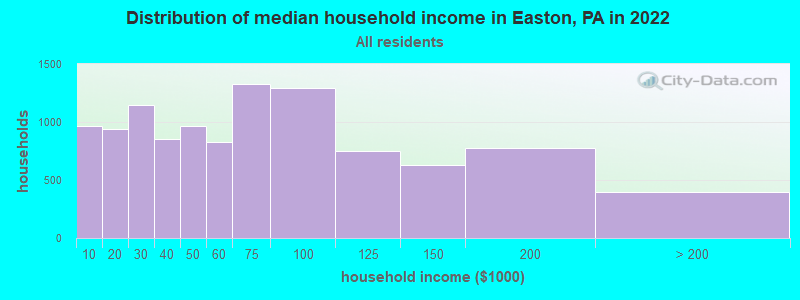
Easton, PA household income distribution

- 967Less than $10,000
- 940$10,000 to $19,999
- 1,146$20,000 to $29,999
- 854$30,000 to $39,999
- 968$40,000 to $49,999
- 828$50,000 to $59,999
- 1,327$60,000 to $74,999
- 1,292$75,000 to $99,999
- 746$100,000 to $124,999
- 629$125,000 to $149,999
- 775$150,000 to $199,999
- 398$200,000 or more
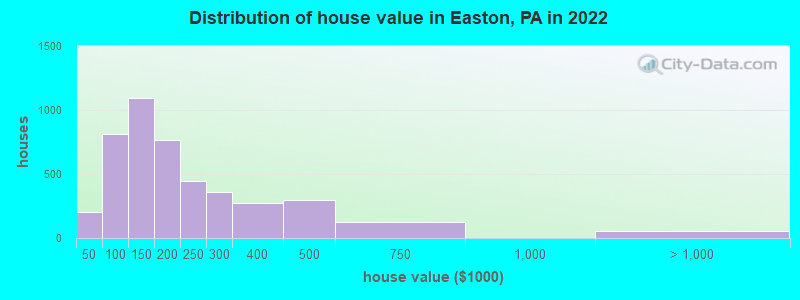
Home value of owner - occupied houses in 2022 in Easton, PA
-
- 87Less than $10,000
- 16$10,000 to $14,999
- 15$15,000 to $19,999
- 42$20,000 to $24,999
- 11$35,000 to $39,999
- 28$40,000 to $49,999
- 4$50,000 to $59,999
- 215$60,000 to $69,999
- 291$70,000 to $79,999
- 197$80,000 to $89,999
- 73$90,000 to $99,999
- 477$100,000 to $124,999
- 614$125,000 to $149,999
- 540$150,000 to $174,999
- 225$175,000 to $199,999
- 441$200,000 to $249,999
- 355$250,000 to $299,999
- 270$300,000 to $399,999
- 293$400,000 to $499,999
- 128$500,000 to $749,999
- 50$1,000,000 to $1,499,999
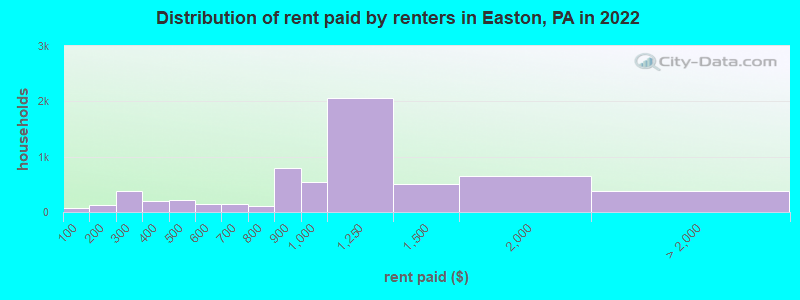
Rent paid by renters in 2022 in Easton, PA
-
- 71Less than $100
- 129$150 to $199
- 32$200 to $249
- 341$250 to $299
- 76$300 to $349
- 117$350 to $399
- 123$400 to $449
- 90$450 to $499
- 109$500 to $549
- 38$550 to $599
- 138$600 to $649
- 39$700 to $749
- 77$750 to $799
- 798$800 to $899
- 536$900 to $999
- 2,058$1,000 to $1,249
- 513$1,250 to $1,499
- 657$1,500 to $1,999
- 33$2,000 to $2,499
- 64$2,500 to $2,999
- 286No cash rent
Percentage of workers working in this county: 73.5%
Number of people working at home: 1,825 (12.9% of all workers)
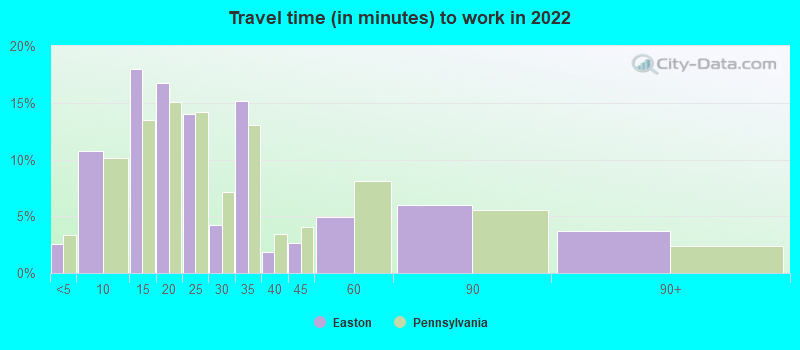
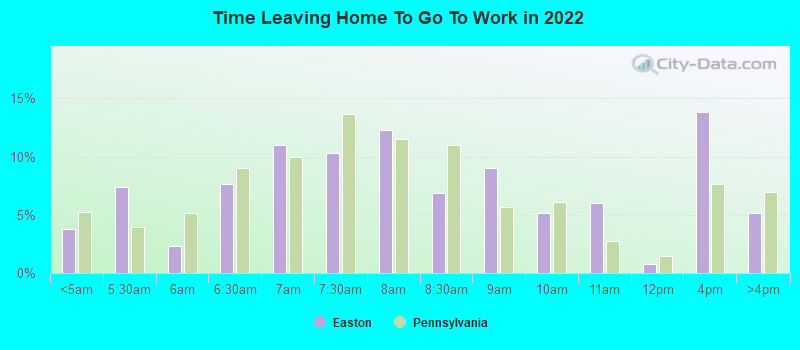
Travel time to work (commute)
- Less than 5 minutes: 294
- 5 to 9 minutes: 1,413
- 10 to 14 minutes: 2,020
- 15 to 19 minutes: 2,066
- 20 to 24 minutes: 1,807
- 25 to 29 minutes: 535
- 30 to 34 minutes: 1,518
- 35 to 39 minutes: 157
- 40 to 44 minutes: 388
- 45 to 59 minutes: 519
- 60 to 89 minutes: 506
- 90 or more minutes: 1,231
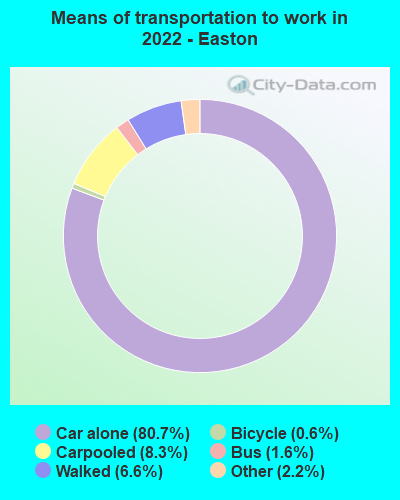
Means of transportation to work:
- Drove a car alone: 10,235 (70.3%)
- Carpooled: 1,052 (7.2%)
- Bus: 318 (2.2%)
- Taxi: 273 (1.9%)
- Bicycle: 101 (0.7%)
- Walked: 687 (4.7%)
- Worked at home: 1,825 (12.5%)
- Unemployment by race in 2022
- Unemployment rate for White non-Hispanic residents
- 4.8%Males
- 1.6%Females
- Unemployment rate for Black residents
- 4.4%Males
- 1.1%Females
- Unemployment rate for Asian residents
- 6.5%Females
- Unemployment rate for other race residents
- 3.0%Females
- Unemployment rate for two or more race residents
- 17.1%Males
- 4.0%Females
- Unemployment rate for Hispanic or Latino residents
- 16.1%Males
- 3.3%Females
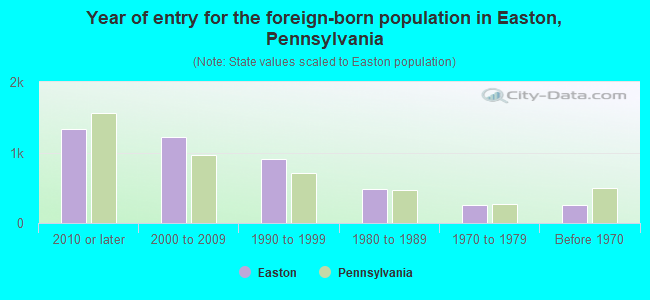
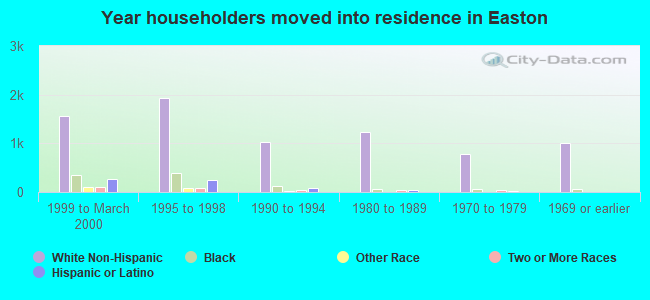
- Year of entry for the foreign-born population in Easton, Pennsylvania
- 1,3342010 or later
- 1,2172000 to 2009
- 9031990 to 1999
- 4871980 to 1989
- 2581970 to 1979
- 259Before 1970
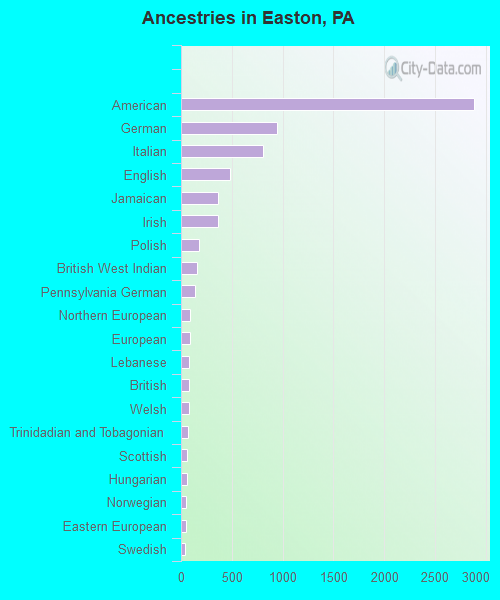
First ancestries reported:
- American: 2,888 (19.7%)
- German: 950 (6.5%)
- Italian: 810 (5.5%)
- English: 484 (3.3%)
- Jamaican: 362 (2.5%)
- Irish: 360 (2.5%)
- Polish: 176 (1.2%)
- British West Indian: 153 (1.0%)
- Pennsylvania German: 141 (1.0%)
- Northern European: 87 (0.6%)
- European: 87 (0.6%)
- Lebanese: 81 (0.6%)
- British: 76 (0.5%)
- Welsh: 76 (0.5%)
- Trinidadian and Tobagonian: 66 (0.5%)
- Scottish: 62 (0.4%)
- Hungarian: 58 (0.4%)
- Norwegian: 51 (0.3%)
- Eastern European: 48 (0.3%)
- Swedish: 44 (0.3%)
- Portuguese: 26 (0.2%)
- Lithuanian: 25 (0.2%)
- Scotch-Irish: 25 (0.2%)
- Canadian: 21 (0.1%)
- Dutch: 17 (0.1%)
- French: 15 (0.1%)
- Haitian: 15 (0.1%)
- Arab: 14 (0.10%)
- Slavic: 12 (0.08%)
- Russian: 11 (0.08%)
- Australian: 10 (0.07%)
- Ethiopian: 10 (0.07%)
- Moroccan: 9 (0.06%)
- Armenian: 9 (0.06%)
- Scandinavian: 8 (0.05%)
- Albanian: 6 (0.04%)
- Liberian: 4 (0.03%)
- Slovak: 1 (0.01%)
- Turkish: 1 (0.01%)
Most common places of birth for foreign-born residents (%):
| Easton: | 24.1% (984) |
| Pennsylvania: | 9.2% (86,544) |
| Easton: | 12.3% (504) |
| Pennsylvania: | 2.4% (22,612) |
| Easton: | 9.7% (397) |
| Pennsylvania: | 5.8% (54,190) |
| Easton: | 7.0% (286) |
| Pennsylvania: | 1.1% (10,035) |
| Easton: | 5.8% (235) |
| Pennsylvania: | 0.8% (7,727) |
| Easton: | 5.1% (210) |
| Pennsylvania: | 1.4% (13,268) |
| Easton: | 3.8% (157) |
| Pennsylvania: | 0.7% (6,690) |
| Easton: | 3.8% (156) |
| Pennsylvania: | 7.2% (67,704) |
| Easton: | 3.2% (129) |
| Pennsylvania: | 1.3% (12,172) |
| Easton: | 3.0% (123) |
| Pennsylvania: | 0.1% (842) |
| Easton: | 2.9% (120) |
| Pennsylvania: | 0.3% (3,132) |
| Easton: | 2.7% (110) |
| Pennsylvania: | 0.6% (5,742) |
| Easton: | 2.3% (93) |
| Pennsylvania: | 1.8% (17,032) |
| Easton: | 2.0% (81) |
| Pennsylvania: | 1.5% (13,823) |
| Easton: | 2.0% (81) |
| Pennsylvania: | 0.8% (7,224) |
Place of birth for U.S.-born residents:
- This state: 13,024
- Other state: 10,929
- Northeast: 7,816
- Midwest: 430
- South: 1,734
- West: 1,041
84.2% of Easton residents lived in the same house 1 years ago.
Out of people who lived in different houses, 25.2% lived in this county.
Out of people who lived in different counties, 41.0% lived in Pennsylvania.
| Easton: | 84.2% |
| State average: | 89.3% |
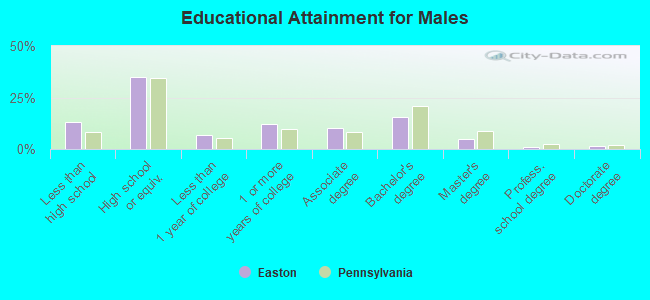
Education attainment for males 25 years and older:
- No schooling: 173
- Nursery to 4th grade: 14
- 5th and 6th grade: 131
- 7th and 8th grade: 242
- 9th grade: 27
- 10th grade: 220
- 11th grade: 253
- 12th grade, no diploma: 144
- High school graduate (or equivalency): 3,226
- Less than 1 year of college: 615
- Some college more than 1 year, no degree: 1,111
- Associate degree: 925
- Bachelor's degree: 1,426
- Master's degree: 468
- Professional school degree: 102
- Doctorate degree: 142
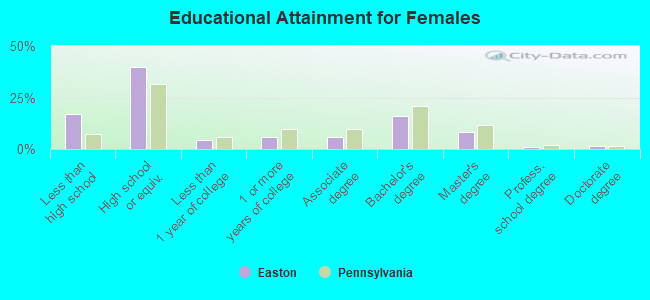
Education attainment for females 25 years and older:
- No schooling: 70
- Nursery to 4th grade: 15
- 5th and 6th grade: 30
- 7th and 8th grade: 126
- 9th grade: 206
- 10th grade: 480
- 11th grade: 563
- 12th grade, no diploma: 66
- High school graduate (or equivalency): 3,689
- Less than 1 year of college: 424
- Some college more than 1 year, no degree: 547
- Associate degree: 550
- Bachelor's degree: 1,478
- Master's degree: 784
- Professional school degree: 95
- Doctorate degree: 119
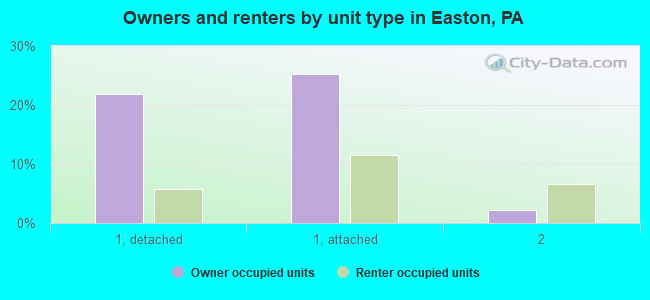
Housing units in structures:
- One, detached: 3,129
- One, attached: 3,878
- Two: 1,544
- 3 or 4: 696
- 5 to 9: 833
- 10 to 19: 681
- 20 to 49: 659
- 50 or more: 199
- Mobile homes: 32
Housing units lacking complete kitchen facilities in 2022: 2.8%
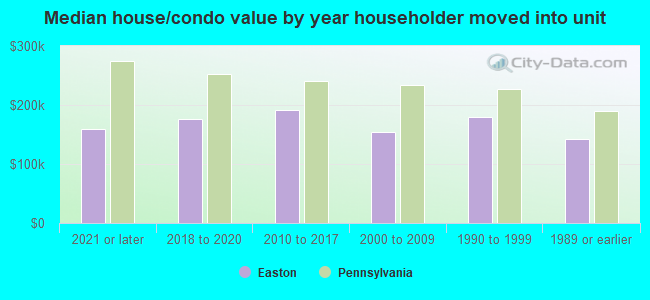
House/condo owner moved in on average 13 years ago
Renter moved in on average 1 years ago
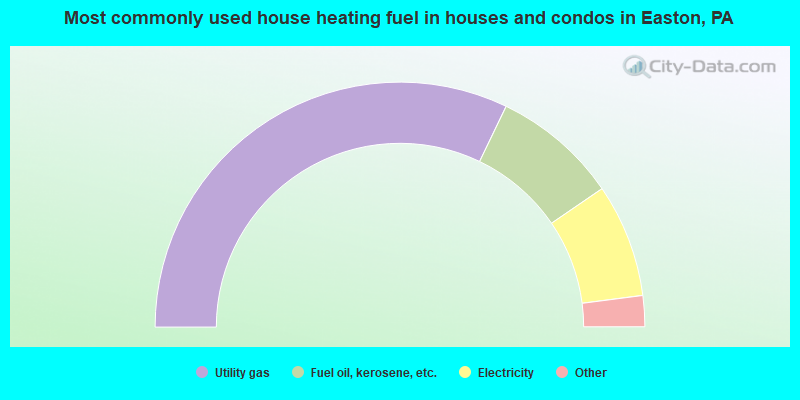
- 64.3%Utility gas
- 16.6%Fuel oil, kerosene, etc.
- 15.0%Electricity
- 1.8%Wood
- 1.2%Bottled, tank, or LP gas
- 0.4%Coal or coke
- 0.4%Solar energy
- 0.2%No fuel used
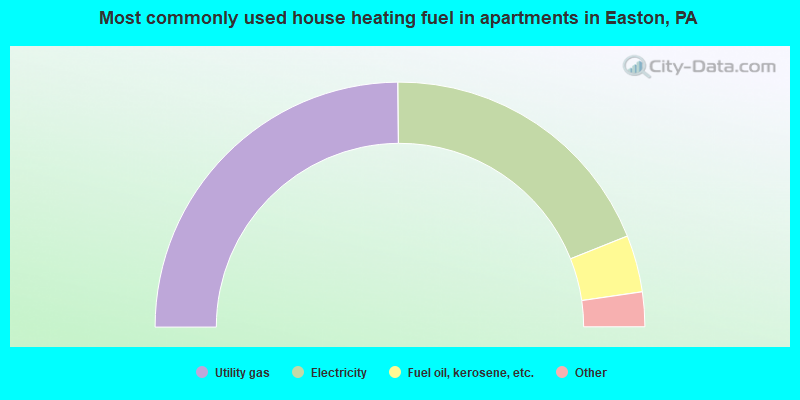
- 49.8%Utility gas
- 38.2%Electricity
- 7.5%Fuel oil, kerosene, etc.
- 2.3%Bottled, tank, or LP gas
- 1.5%No fuel used
- 0.7%Other fuel
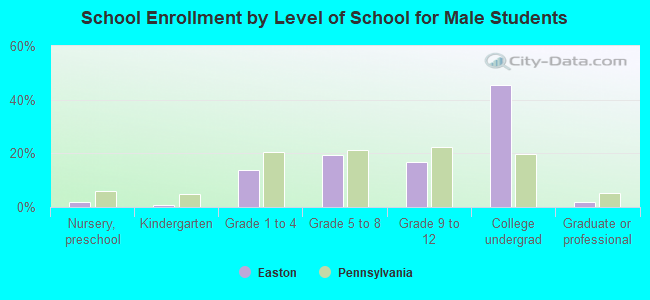
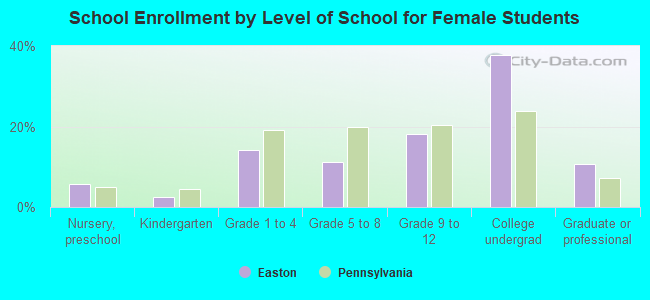
Private vs. public school enrollment:
| Here: | 8.4% |
| Pennsylvania: | 15.7% |
| Here: | 1.1% |
| Pennsylvania: | 13.4% |
| Here: | 74.7% |
| Pennsylvania: | 39.8% |