Fort Myers, FL (Florida) Houses and Residents
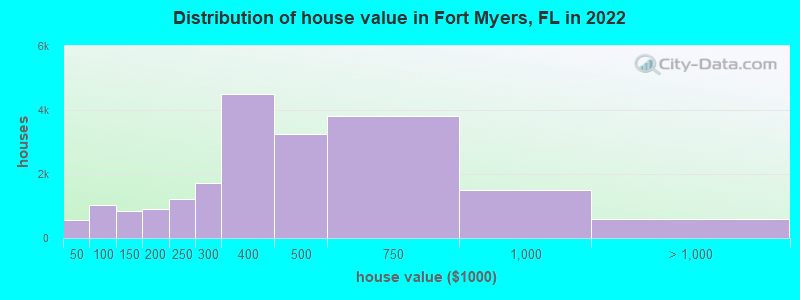
Estimated median house or condo value in 2022: $405,000 (it was $71,700 in 2000 )
Fort Myers:
$405,000Florida:
$354,100
Lower value quartile - upper value quartile: $272,200 - $611,800Mean price in 2022: Detached houses: $443,797 Here:
$443,797State:
$500,941
Townhouses or other attached units: $382,251 Here:
$382,251State:
$370,869
In 2-unit structures: $315,633 Here:
$315,633State:
$423,188
In 3-to-4-unit structures: $307,917 Here:
$307,917State:
$309,944
In 5-or-more-unit structures: $302,237 Here:
$302,237State:
$447,145
Mobile homes: $85,722 Here:
$85,722State:
$113,202
Occupied boats, RVs, vans, etc.: $189,704 Here:
$189,704State:
$73,933
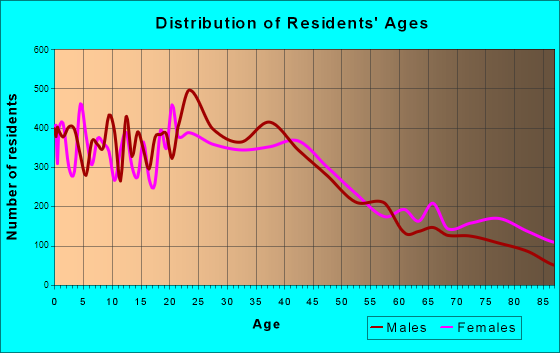
Total population: 70,918 (Urban population: 47,502, Rural population: 544 (all nonfarm) )
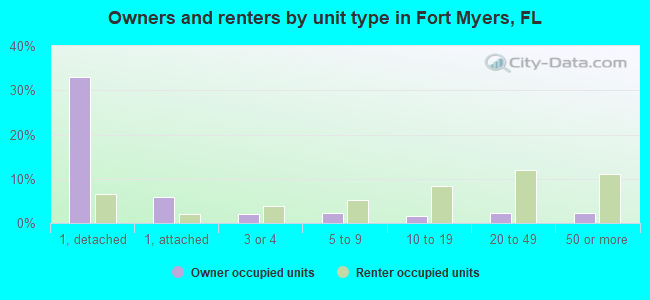
Houses: 51,180 (40,790 occupied: 20,607 owner occupied, 20,183 renter occupied )
% of renters here:
49%State:
33%
Housing density: 1,608 houses/condos per square mile
Median price asked for vacant for-sale houses and condos in 2022: $548,975.
Median contract rent in 2022: $1,364 (lower quartile is $967, upper quartile is $1,721)
Median rent asked for vacant for-rent units in 2022: $1,759
Median gross rent in Fort Myers, FL in 2022: $1,511
Housing units in Fort Myers with a mortgage: 10,368 (383 second mortgage, 0 home equity loan, 317 both second mortgage and home equity loan )Houses without a mortgage: 100
Median household income for houses/condos with a mortgage: $100,577
Median household income for apartments without a mortgage: $82,838
Median monthly housing costs: $1,419
Data:
Median house or condo value ($)
Median house or condo value ($ change since 2000)
Median house or condo value ($) - White
Median house or condo value ($) - Black or African American
Median house or condo value ($) - Asian
Median house or condo value ($) - Hispanic or Latino
Median house or condo value ($) - American Indian and Alaska Native
Median house or condo value ($) - Multirace
Median house or condo value ($) - Other Race
Median price asked for mobile homes ($)
Household density (households per square mile)
Mean house or condo value by units in structure - 1, detached ($)
Mean house or condo value by units in structure - 1, attached ($)
Mean house or condo value by units in structure - 2 ($)
Mean house or condo value by units in structure by units in structure - 3 or 4 ($)
Mean house or condo value by units in structure - 5 or more ($)
Mean house or condo value by units in structure - Boat, RV, van, etc. ($)
Mean house or condo value by units in structure - Mobile home ($)
Median contract rent ($)
Median contract rent - Lower quartile ($)
Median contract rent - Upper quartile ($)
Median gross rent ($)
Urban houses (%)
Rural houses (%)
Houses occupied (%)
Houses occupied (% change since 2000)
Houses owner occupied (%)
Houses owner occupied (% change since 2000)
Houses renter occupied (%)
Houses renter occupied (% change since 2000)
Vacant housing units - For rent (%)
Vacant housing units - For rent (% change since 2000)
Vacant housing units - For sale only (%)
Vacant housing units - For sale only (% change since 2000)
Vacant housing units - Rented or sold, not occupied (%)
Vacant housing units - Rented or sold, not occupied (% change since 2000)
Vacant housing units - For seasonal, recreational, or occasional use (%)
Vacant housing units - For seasonal, recreational, or occasional use (% change since 2000)
Vacant housing units - For migrant workers (%)
Vacant housing units - For migrant workers (% change since 2000)
Vacant housing units - Other vacant (%)
Vacant housing units - Other vacant (% change since 2000)
Median monthly housing costs ($)
Median household income for houses/condos with a mortgage ($)
Median household income for houses/condos without a mortgage ($)
Median household income ($)
Median household income ($) - White
Median household income ($) - Black or African American
Median household income ($) - Asian
Median household income ($) - Hispanic or Latino
Median household income ($) - American Indian and Alaska Native
Median household income ($) - Multirace
Median household income ($) - Other Race
Mortgage status - with mortgage (%)
Mortgage status - with second mortgage (%)
Mortgage status - with home equity loan (%)
Mortgage status - with both second mortgage and home equity loan (%)
Mortgage status - without a mortgage (%)
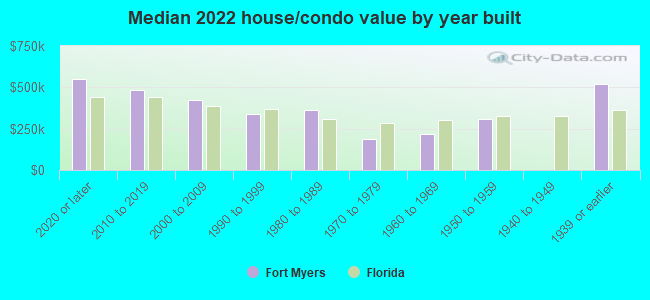
Median year house/condo built
Median year apartment built
Household type by relationship - Male householder living alone (%)
Household type by relationship - Male householder not living alone (%)
Household type by relationship - Female householder living alone (%)
Household type by relationship - Female householder not living alone (%)
Household type by relationship - Opposite-Sex spouse (%)
Household type by relationship - Same-Sex spouse (%)
Household type by relationship - Opposite-Sex unmarried partner (%)
Household type by relationship - Same-Sex unmarried partner (%)
Household type by relationship - In group quarters (%)
Size of family households - 2-person household (%)
Size of family households - 3-person household (%)
Size of family households - 4-person household (%)
Size of family households - 5-person household (%)
Size of family households - 6-person household (%)
Size of family households - 7-or-more-person household (%)
Size of nonfamily households - 1-person household (%)
Size of nonfamily households - 2-person household (%)
Size of nonfamily households - 3-person household (%)
Size of nonfamily households - 4-person household (%)
Size of nonfamily households - 5-person household (%)
Size of nonfamily households - 6-person household (%)
Size of nonfamily households - 7-or-moreperson household (%)
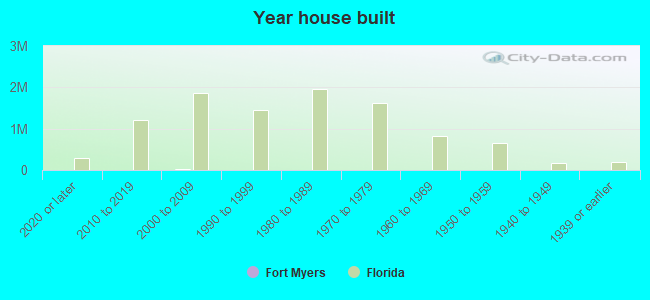
Year house built - Built 2010 or later (%)
Year house built - Built 2000 to 2009 (%)
Year house built - Built 1990 to 1999 (%)
Year house built - Built 1980 to 1989 (%)
Year house built - Built 1970 to 1979 (%)
Year house built - Built 1960 to 1969 (%)
Year house built - Built 1950 to 1959 (%)
Year house built - Built 1940 to 1949 (%)
Year house built - Built 1939 or earlier (%)
Median number of rooms in houses and condos
Median number of rooms in apartments
Median number of bedrooms in owner occupied houses
Mean number of bedrooms in owner occupied houses
Median number of bedrooms in renter occupied houses
Mean number of bedrooms in renter occupied houses
Median number of vehichles in owner occupied houses
Mean number of vehichles in owner occupied houses
Median number of vehichles in renter occupied houses
Mean number of vehichles in renter occupied houses
Rooms in owner-occupied houses - 1 room (%)
Rooms in owner-occupied houses - 2 rooms (%)
Rooms in owner-occupied houses - 3 rooms (%)
Rooms in owner-occupied houses - 4 rooms (%)
Rooms in owner-occupied houses - 5 rooms (%)
Rooms in owner-occupied houses - 6 rooms (%)
Rooms in owner-occupied houses - 7 rooms (%)
Rooms in owner-occupied houses - 8 rooms (%)
Rooms in owner-occupied houses - 9+ rooms (%)
Rooms in renter-occupied houses - 1 room (%)
Rooms in renter-occupied houses - 2 rooms (%)
Rooms in renter-occupied houses - 3 rooms (%)
Rooms in renter-occupied houses - 4 rooms (%)
Rooms in renter-occupied houses - 5 rooms (%)
Rooms in renter-occupied houses - 6 rooms (%)
Rooms in renter-occupied houses - 7 rooms (%)
Rooms in renter-occupied houses - 8 rooms (%)
Rooms in renter-occupied houses - 9+ rooms (%)
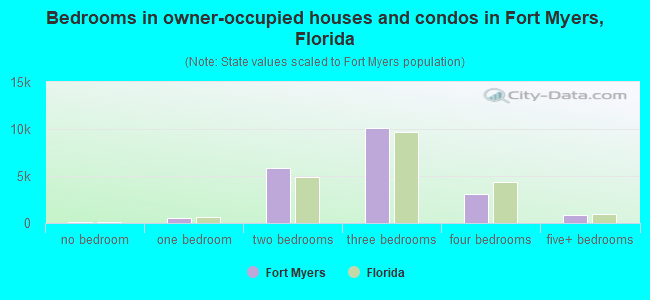
Bedrooms in owner-occupied houses - no bedrooms (%)
Bedrooms in owner-occupied houses - 1 bedroom (%)
Bedrooms in owner-occupied houses - 2 bedrooms (%)
Bedrooms in owner-occupied houses - 3 bedrooms (%)
Bedrooms in owner-occupied houses - 4 bedrooms (%)
Bedrooms in owner-occupied houses - 5+ bedrooms (%)
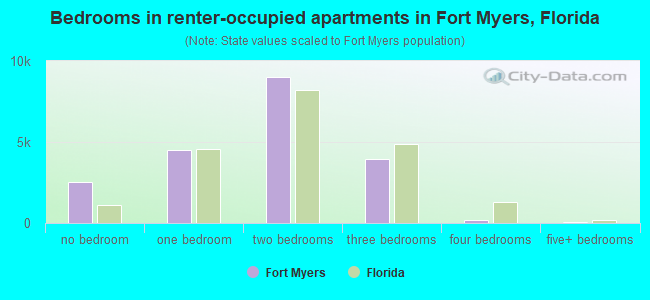
Bedrooms in renter-occupied houses - no bedrooms (%)
Bedrooms in renter-occupied houses - 1 bedroom (%)
Bedrooms in renter-occupied houses - 2 bedrooms (%)
Bedrooms in renter-occupied houses - 3 bedrooms (%)
Bedrooms in renter-occupied houses - 4 bedrooms (%)
Bedrooms in renter-occupied houses - 5+ bedrooms (%)
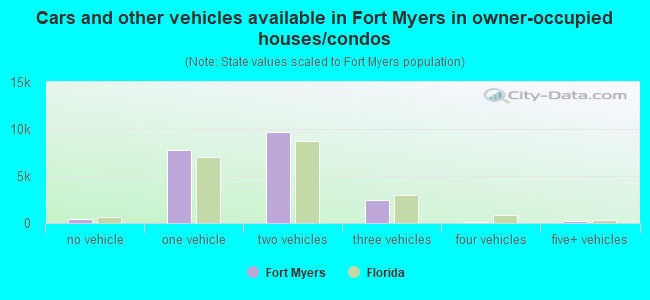
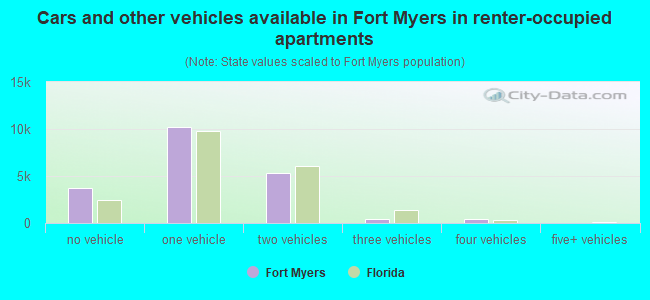
Vehicles available in owner-occupied houses - no vehicle available (%)
Vehicles available in owner-occupied houses - 1 vehicle available(%)
Vehicles available in owner-occupied houses - 2 Vehicles available (%)
Vehicles available in owner-occupied houses - 3 Vehicles available (%)
Vehicles available in owner-occupied houses - 4 Vehicles available (%)
Vehicles available in owner-occupied houses - 5+ Vehicles available (%)
Vehicles available in renter-occupied houses - no vehicle available (%)
Vehicles available in renter-occupied houses - 1 vehicle available (%)
Vehicles available in renter-occupied houses - 2 Vehicles available (%)
Vehicles available in renter-occupied houses - 3 Vehicles available (%)
Vehicles available in renter-occupied houses - 4 Vehicles available (%)
Vehicles available in renter-occupied houses - 5+ Vehicles available (%)
Housing units in structures - 1, detached (%)
Housing units in structures - 1, attached (%)
Housing units in structures - 2 (%)
Housing units in structures - 3 or 4 (%)
Housing units in structures - 5 to 9 (%)
Housing units in structures - 10 to 19 (%)
Housing units in structures - 20 to 49 (%)
Housing units in structures - 50 or more (%)
Housing units in structures - Mobile home (%)
Housing units in structures - Boat, RV, van, etc. (%)
Housing units in structures - Owners - 1, detached (%)
Housing units in structures - Owners - 1, attached (%)
Housing units in structures - Owners - 2 (%)
Housing units in structures - Owners - 3 or 4 (%)
Housing units in structures - Owners - 5 to 9 (%)
Housing units in structures - Owners - 10 to 19 (%)
Housing units in structures - Owners - 20 to 49 (%)
Housing units in structures - Owners - 50 or more (%)
Housing units in structures - Owners - Mobile home (%)
Housing units in structures - Owners - Boat, RV, van, etc. (%)
Housing units in structures - Renters - 1, detached (%)
Housing units in structures - Renters - 1, attached (%)
Housing units in structures - Renters - 2 (%)
Housing units in structures - Renters - 3 or 4 (%)
Housing units in structures - Renters - 5 to 9 (%)
Housing units in structures - Renters - 10 to 19 (%)
Housing units in structures - Renters - 20 to 49 (%)
Housing units in structures - Renters - 50 or more (%)
Housing units in structures - Renters - Mobile home (%)
Housing units in structures - Renters - Boat, RV, van, etc. (%)
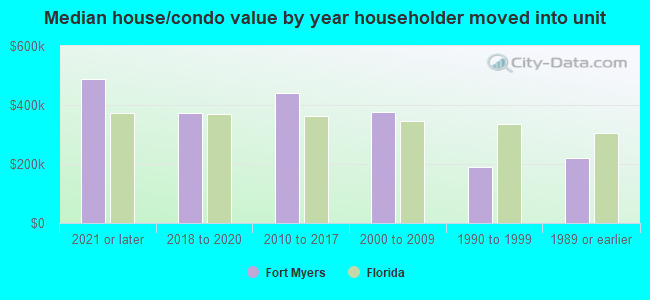
House/condo owner moved in on average (years ago)
Renter moved in on average (years ago)
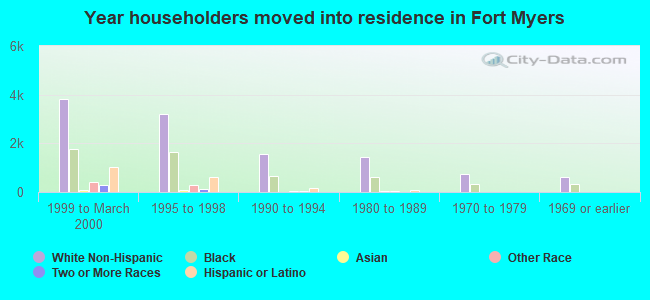
Year householder moved into unit - Moved in 1999 to March 2000 (%)
Year householder moved into unit - Moved in 1999 to March 2000 (%) - White
Year householder moved into unit - Moved in 1999 to March 2000 (%) - Black or African American
Year householder moved into unit - Moved in 1999 to March 2000 (%) - Asian
Year householder moved into unit - Moved in 1999 to March 2000 (%) - Hispanic or Latino
Year householder moved into unit - Moved in 1999 to March 2000 (%) - American Indian and Alaska Native
Year householder moved into unit - Moved in 1999 to March 2000 (%) - Multirace
Year householder moved into unit - Moved in 1999 to March 2000 (%) - Other Race
Year householder moved into unit - Moved in 1995 to 1998 (%)
Year householder moved into unit - Moved in 1995 to 1998 (%) - White
Year householder moved into unit - Moved in 1995 to 1998 (%) - Black or African American
Year householder moved into unit - Moved in 1995 to 1998 (%) - Asian
Year householder moved into unit - Moved in 1995 to 1998 (%) - Hispanic or Latino
Year householder moved into unit - Moved in 1995 to 1998 (%) - American Indian and Alaska Native
Year householder moved into unit - Moved in 1995 to 1998 (%) - Multirace
Year householder moved into unit - Moved in 1995 to 1998 (%) - Other Race
Year householder moved into unit - Moved in 1990 to 1994 (%)
Year householder moved into unit - Moved in 1990 to 1994 (%) - White
Year householder moved into unit - Moved in 1990 to 1994 (%) - Black or African American
Year householder moved into unit - Moved in 1990 to 1994 (%) - Asian
Year householder moved into unit - Moved in 1990 to 1994 (%) - Hispanic or Latino
Year householder moved into unit - Moved in 1990 to 1994 (%) - American Indian and Alaska Native
Year householder moved into unit - Moved in 1990 to 1994 (%) - Multirace
Year householder moved into unit - Moved in 1990 to 1994 (%) - Other Race
Year householder moved into unit - Moved in 1980 to 1989 (%)
Year householder moved into unit - Moved in 1980 to 1989 (%) - White
Year householder moved into unit - Moved in 1980 to 1989 (%) - Black or African American
Year householder moved into unit - Moved in 1980 to 1989 (%) - Asian
Year householder moved into unit - Moved in 1980 to 1989 (%) - Hispanic or Latino
Year householder moved into unit - Moved in 1980 to 1989 (%) - American Indian and Alaska Native
Year householder moved into unit - Moved in 1980 to 1989 (%) - Multirace
Year householder moved into unit - Moved in 1980 to 1989 (%) - Other Race
Year householder moved into unit - Moved in 1970 to 1979 (%)
Year householder moved into unit - Moved in 1970 to 1979 (%) - White
Year householder moved into unit - Moved in 1970 to 1979 (%) - Black or African American
Year householder moved into unit - Moved in 1970 to 1979 (%) - Asian
Year householder moved into unit - Moved in 1970 to 1979 (%) - Hispanic or Latino
Year householder moved into unit - Moved in 1970 to 1979 (%) - American Indian and Alaska Native
Year householder moved into unit - Moved in 1970 to 1979 (%) - Multirace
Year householder moved into unit - Moved in 1970 to 1979 (%) - Other Race
Year householder moved into unit - Moved in 1969 or earlier (%)
Year householder moved into unit - Moved in 1969 or earlier (%) - White
Year householder moved into unit - Moved in 1969 or earlier (%) - Black or African American
Year householder moved into unit - Moved in 1969 or earlier (%) - Asian
Year householder moved into unit - Moved in 1969 or earlier (%) - Hispanic or Latino
Year householder moved into unit - Moved in 1969 or earlier (%) - American Indian and Alaska Native
Year householder moved into unit - Moved in 1969 or earlier (%) - Multirace
Year householder moved into unit - Moved in 1969 or earlier (%) - Other Race
Housing units lacking complete plumbing facilities (%)
Housing units lacking complete kitchen facilities (%)
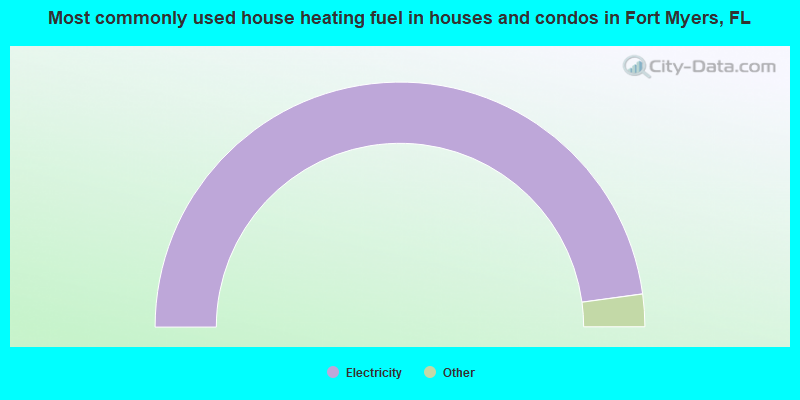
House heating fuel used in houses and condos - Utility gas (%)
House heating fuel used in houses and condos - Bottled, tank, or LP gas (%)
House heating fuel used in houses and condos - Electricity (%)
House heating fuel used in houses and condos - Fuel oil, kerosene, etc. (%)
House heating fuel used in houses and condos - Coal or coke (%)
House heating fuel used in houses and condos - Wood (%)
House heating fuel used in houses and condos - Solar energy (%)
House heating fuel used in houses and condos - Other fuel (%)
House heating fuel used in houses and condos - No fuel used (%)
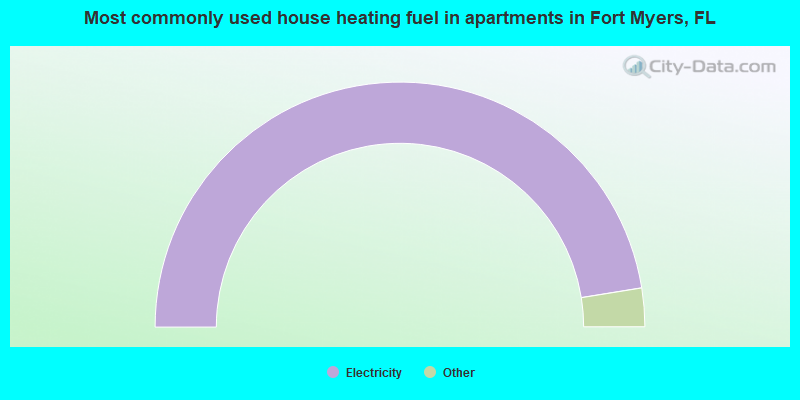
House heating fuel used in apartments - Utility gas (%)
House heating fuel used in apartments - Bottled, tank, or LP gas (%)
House heating fuel used in apartments - Electricity (%)
House heating fuel used in apartments - Fuel oil, kerosene, etc. (%)
House heating fuel used in apartments - Coal or coke (%)
House heating fuel used in apartments - Wood (%)
House heating fuel used in apartments - Solar energy (%)
House heating fuel used in apartments - Other fuel (%)
House heating fuel used in apartments - No fuel used (%)
Median year house/condo built: 2006Median year apartment built: 1994Household type by relationship:
Households: 95,935
Male householders: 19,824 (4,344 living alone ), Female householders: 20,966 (8,246 living alone )17,148 spouses (17,024 opposite-sex spouses ), 3,599 unmarried partners , (3,522 opposite-sex unmarried partners ), 22,133 children (21,728 natural , 95 adopted , 310 stepchildren ), 873 grandchildren , 1,299 brothers or sisters , 1,857 parents , 0 foster children , 2,498 other relatives , 3,029 non-relatives In group quarters: 2,709
Size of family households: 15,248 2-persons , 4,550 3-persons , 3,050 4-persons , 937 5-persons , 412 6-persons , 380 7-or-more-persons .
Size of nonfamily households: 12,590 1-person , 3,331 2-persons , 169 3-persons , 123 4-persons .
7,712 married couples with children. single-parent households (1,642 men , 4,981 women ).
70.1% of residents of Fort Myers speak English at home. of residents speak Spanish at home (45% speak English very well , 21% speak English well , 16% speak English not well , 17% don't speak English at all ).of residents speak other Indo-European language at home (56% speak English very well , 22% speak English well , 17% speak English not well , 5% don't speak English at all ).of residents speak Asian or Pacific Island language at home (45% speak English very well , 32% speak English well , 17% speak English not well , 6% don't speak English at all ).of residents speak other language at home (83% speak English very well , 17% speak English well ).
Foreign born population: 23,073 (24.1%)of them are naturalized citizens )
Median number of rooms in houses and condos:
Median number of rooms in apartments
Owner-occupied Renter-occupied
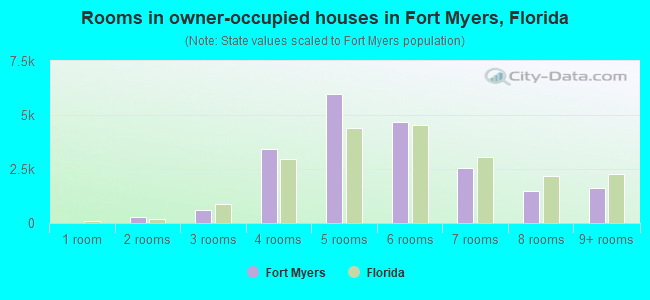
Rooms in owner-occupied houses in Fort Myers, Florida
0 1 room 283 2 rooms 581 3 rooms 3,424 4 rooms 5,965 5 rooms 4,672 6 rooms 2,550 7 rooms 1,493 8 rooms 1,639 9+ rooms
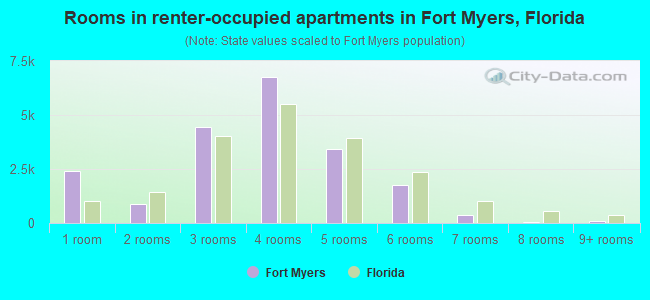
Rooms in renter-occupied apartments in Fort Myers, Florida
2,401 1 room 871 2 rooms 4,443 3 rooms 6,758 4 rooms 3,416 5 rooms 1,763 6 rooms 380 7 rooms 42 8 rooms 109 9+ rooms
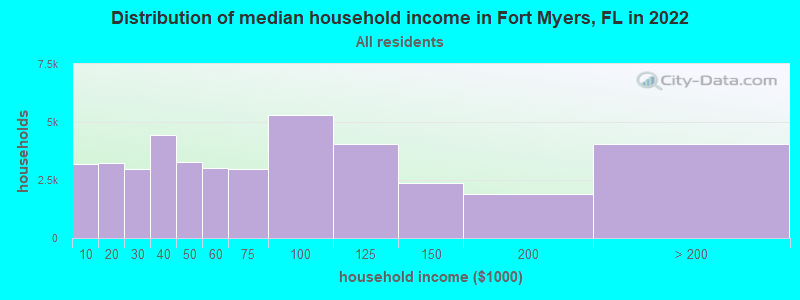
Fort Myers, FL household income distribution 3,206 Less than $10,0003,216 $10,000 to $19,9992,988 $20,000 to $29,9994,440 $30,000 to $39,9993,287 $40,000 to $49,9993,017 $50,000 to $59,9992,978 $60,000 to $74,9995,312 $75,000 to $99,9994,045 $100,000 to $124,9992,379 $125,000 to $149,9991,881 $150,000 to $199,9994,041 $200,000 or more
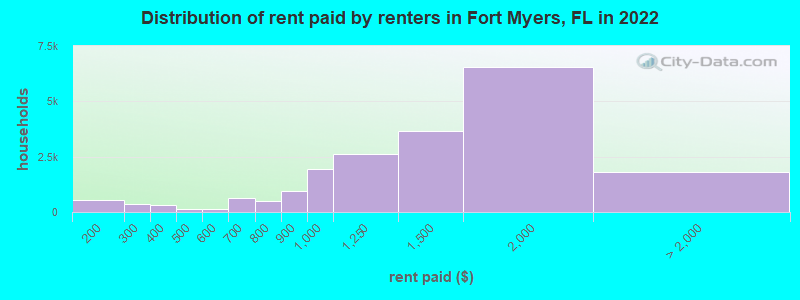
Home value of owner - occupied houses in 2022 in Fort Myers, FL 257 Less than $10,000134 $10,000 to $14,99929 $15,000 to $19,99939 $20,000 to $24,9996 $25,000 to $29,9996 $30,000 to $34,9994 $35,000 to $39,99975 $40,000 to $49,999207 $50,000 to $59,999184 $60,000 to $69,999216 $70,000 to $79,999227 $80,000 to $89,999114 $90,000 to $99,999457 $100,000 to $124,999372 $125,000 to $149,999571 $150,000 to $174,999321 $175,000 to $199,9991,205 $200,000 to $249,9991,709 $250,000 to $299,9994,505 $300,000 to $399,9993,253 $400,000 to $499,9993,805 $500,000 to $749,9991,499 $750,000 to $999,999360 $1,000,000 to $1,499,99972 $1,500,000 to $1,999,999149 $2,000,000 or moreRent paid by renters in 2022 in Fort Myers, FL 44 Less than $100524 $150 to $199267 $200 to $24984 $250 to $299315 $350 to $39940 $400 to $449108 $450 to $499122 $550 to $599576 $600 to $64966 $650 to $699296 $700 to $749218 $750 to $799937 $800 to $8991,945 $900 to $9992,609 $1,000 to $1,2493,649 $1,250 to $1,4996,562 $1,500 to $1,999770 $2,000 to $2,499119 $2,500 to $2,999216 $3,000 to $3,499151 $3,500 or more565 No cash rent
Percentage of workers working in this county: 90.8%Number of people working at home: 5,175 (12.8% of all workers )
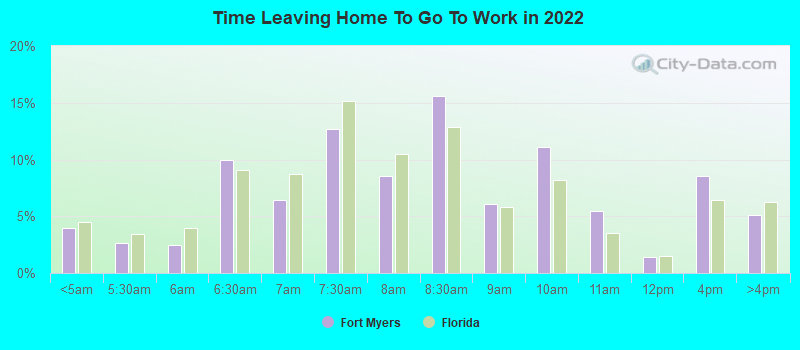
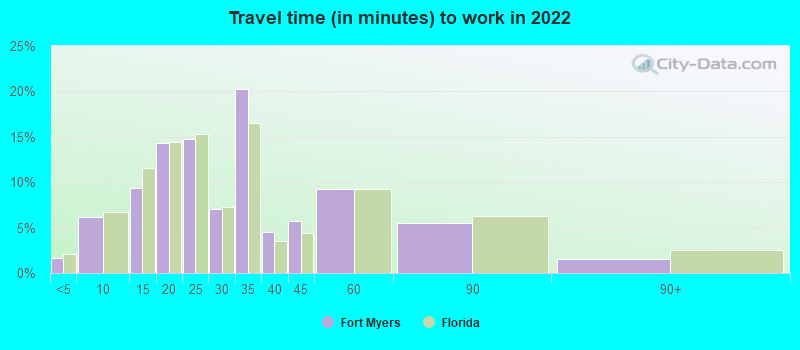
Travel time to work (commute)
Less than 5 minutes: 6215 to 9 minutes: 3,31210 to 14 minutes: 4,11715 to 19 minutes: 4,66320 to 24 minutes: 6,77025 to 29 minutes: 3,83630 to 34 minutes: 4,76735 to 39 minutes: 1,08440 to 44 minutes: 2,36645 to 59 minutes: 2,54860 to 89 minutes: 1,51190 or more minutes: 426
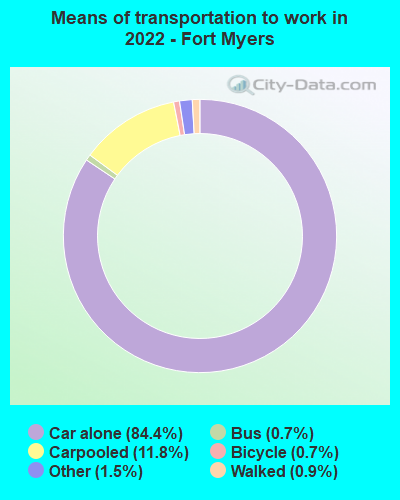
Means of transportation to work:
Drove a car alone: 62,585 (75.6%)Carpooled: 10,708 (12.9%)Bus : 655 (0.8%)Long-distance train or commuter rail : 12 (0.0%)Taxi: 770 (0.9%)Bicycle: 311 (0.4%)Walked: 731 (0.9%)Worked at home: 5,175 (6.3%)
Unemployment by race in 2022
Unemployment rate for White non-Hispanic residents 0.8% Males4.0% FemalesUnemployment rate for Black residents 4.9% Males11.0% FemalesUnemployment rate for American Indian and Alaska Native residents 4.9% MalesUnemployment rate for Asian residents 1.4% MalesUnemployment rate for other race residents 0.2% FemalesUnemployment rate for two or more race residents 0.2% Males5.9% FemalesUnemployment rate for Hispanic or Latino residents 3.0% Males4.5% Females
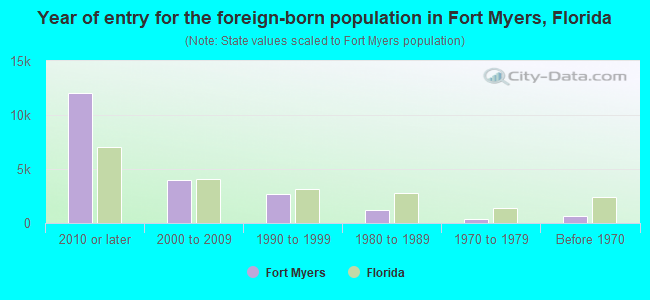
Year of entry for the foreign-born population in Fort Myers, Florida
12,032 2010 or later 3,975 2000 to 2009 2,712 1990 to 1999 1,228 1980 to 1989 363 1970 to 1979 637 Before 1970
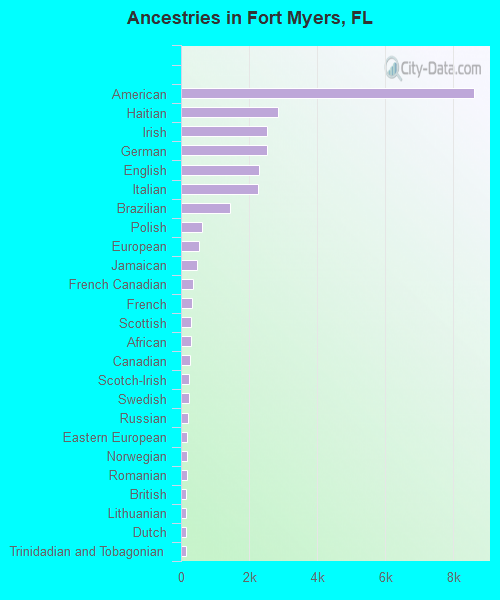
First ancestries reported:
American: 8,616 (15.7%)
Haitian: 2,850 (5.2%)
Irish: 2,534 (4.6%)
German: 2,521 (4.6%)
English: 2,304 (4.2%)
Italian: 2,265 (4.1%)
Brazilian: 1,451 (2.6%)
Polish: 606 (1.1%)
European: 535 (1.0%)
Jamaican: 481 (0.9%)
French Canadian: 348 (0.6%)
French: 319 (0.6%)
Scottish: 305 (0.6%)
African: 299 (0.5%)
Canadian: 251 (0.5%)
Scotch-Irish: 240 (0.4%)
Swedish: 229 (0.4%)
Russian: 199 (0.4%)
Eastern European: 184 (0.3%)
Norwegian: 184 (0.3%)
Romanian: 171 (0.3%)
British: 161 (0.3%)
Lithuanian: 160 (0.3%)
Dutch: 145 (0.3%)
Trinidadian and Tobagonian: 144 (0.3%)
Portuguese: 138 (0.3%)
Lebanese: 128 (0.2%)
Hungarian: 90 (0.2%)
Austrian: 89 (0.2%)
Yugoslavian: 88 (0.2%)
South African: 87 (0.2%)
Northern European: 86 (0.2%)
Greek: 75 (0.1%)
Danish: 73 (0.1%)
Swiss: 65 (0.1%)
Israeli: 61 (0.1%)
Czech: 60 (0.1%)
Scandinavian: 59 (0.1%)
Bahamian: 51 (0.09%)
British West Indian: 45 (0.08%)
Slovak: 40 (0.07%)
Zimbabwean: 37 (0.07%)
Albanian: 34 (0.06%)
Ukrainian: 34 (0.06%)
Egyptian: 31 (0.06%)
Moroccan: 29 (0.05%)
Nigerian: 28 (0.05%)
Kenyan: 27 (0.05%)
Guyanese: 22 (0.04%)
Welsh: 13 (0.02%)
Slavic: 12 (0.02%)
Czechoslovakian: 11 (0.02%)
Finnish: 9 (0.02%)
Maltese: 9 (0.02%)
Serbian: 9 (0.02%)
Slovene: 9 (0.02%)
Iranian: 9 (0.02%)
Palestinian: 7 (0.01%)
Pennsylvania German: 6 (0.01%)
Belizean: 5 (0.01%)
Croatian: 4 (0.01%)
Celtic: 4 (0.01%)
West Indian: 4 (0.01%)
Most common places of birth for foreign-born residents (%): Haiti Fort Myers:
15.1% (2,879)Florida:
7.5% (342,375)
Guatemala Fort Myers:
15.0% (2,856)Florida:
2.1% (97,632)
Cuba Fort Myers:
10.5% (1,997)Florida:
22.0% (1,006,576)
Mexico Fort Myers:
10.1% (1,911)Florida:
5.6% (257,152)
Brazil Fort Myers:
8.0% (1,524)Florida:
2.7% (122,906)
Canada Fort Myers:
4.2% (799)Florida:
2.4% (109,132)
Honduras Fort Myers:
3.6% (691)Florida:
2.3% (107,160)
Dominican Republic Fort Myers:
3.4% (647)Florida:
3.0% (137,727)
Jamaica Fort Myers:
3.1% (594)Florida:
5.0% (227,319)
Colombia Fort Myers:
2.4% (450)Florida:
6.5% (298,669)
Venezuela Fort Myers:
2.1% (395)Florida:
5.7% (262,042)
Germany Fort Myers:
1.7% (317)Florida:
1.2% (54,272)
Nicaragua Fort Myers:
1.5% (294)Florida:
2.3% (105,066)
Place of birth for U.S.-born residents:
This state: 25,777Other state: 43,856Northeast: 17,355Midwest: 15,046South: 10,010West: 1,445 83.7% of Fort Myers residents lived in the same house 1 years ago.
Out of people who lived in different houses, 30.0% lived in this county.
Out of people who lived in different counties, 29.8% lived in Florida.
Fort Myers:
83.7%State average:
86.3%
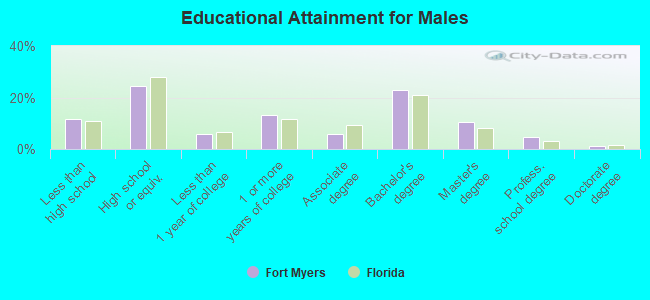
Education attainment for males 25 years and older:
No schooling: 264Nursery to 4th grade: 1245th and 6th grade: 7957th and 8th grade: 499th grade: 46210th grade: 80211th grade: 77712th grade, no diploma: 506High school graduate (or equivalency): 7,876Less than 1 year of college: 1,858Some college more than 1 year, no degree: 4,271Associate degree: 1,914Bachelor's degree: 7,449Master's degree: 3,352Professional school degree: 1,492Doctorate degree: 357
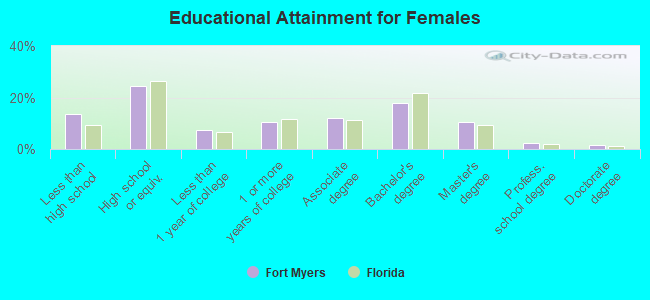
Education attainment for females 25 years and older:
No schooling: 353Nursery to 4th grade: 3125th and 6th grade: 3057th and 8th grade: 5499th grade: 99610th grade: 60311th grade: 1,56212th grade, no diploma: 586High school graduate (or equivalency): 9,517Less than 1 year of college: 2,823Some college more than 1 year, no degree: 4,030Associate degree: 4,714Bachelor's degree: 6,986Master's degree: 4,103Professional school degree: 931Doctorate degree: 681
Housing units in structures:
One, detached: 18,618One, attached: 7,281Two: 1,8633 or 4: 3,1575 to 9: 2,44910 to 19: 4,76920 to 49: 6,65450 or more: 5,765Mobile homes: 624Median worth of mobile homes: $171,300
Housing units lacking complete plumbing facilities in 2022: 1.1%Housing units lacking complete kitchen facilities in 2022: 2.3%House/condo owner moved in on average 4 years ago
Renter moved in on average 2 years ago
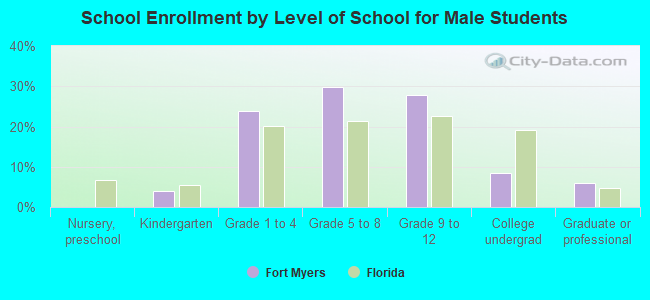
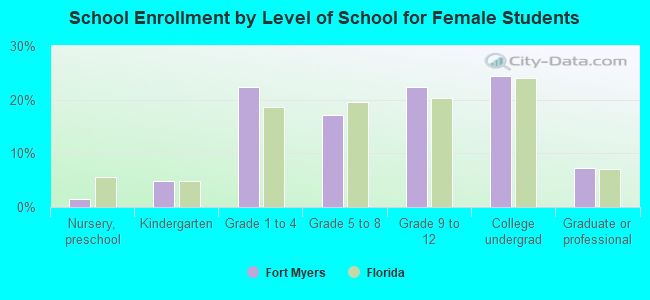
Private vs. public school enrollment:
Students in private schools in grades 1 to 8 (elementary and middle school): 1,319 Students in private schools in grades 9 to 12 (high school): 5 Students in private undergraduate colleges: 726