Races in Fort Myers, Florida (FL) Detailed Stats
Data:
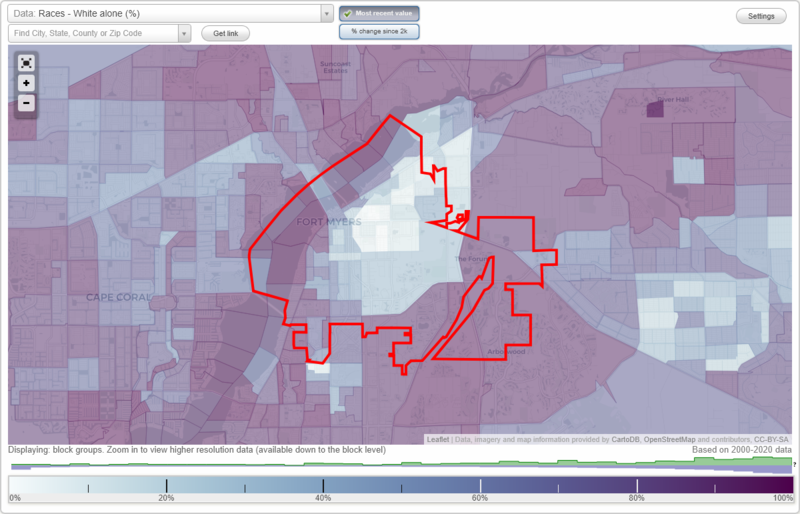
Races - White alone (%)
Races - White alone (% change since 2000)
Races - Black alone (%)
Races - Black alone (% change since 2000)
Races - American Indian alone (%)
Races - American Indian alone (% change since 2000)
Races - Asian alone (%)
Races - Asian alone (% change since 2000)
Races - Hispanic (%)
Races - Hispanic (% change since 2000)
Races - Native Hawaiian and Other Pacific Islander alone (%)
Races - Native Hawaiian and Other Pacific Islander alone (% change since 2000)
Races - Two or more races(%)
Races - Two or more races(% change since 2000)
Races - Other race alone (%)
Races - Other race alone (% change since 2000)
Racial diversity
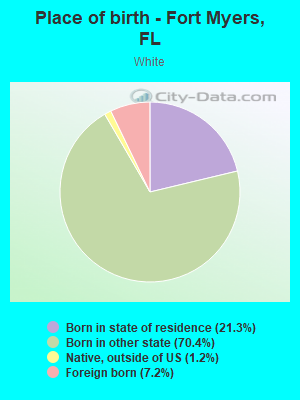
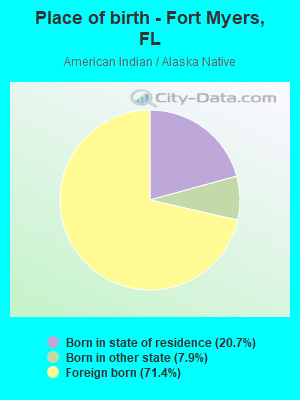
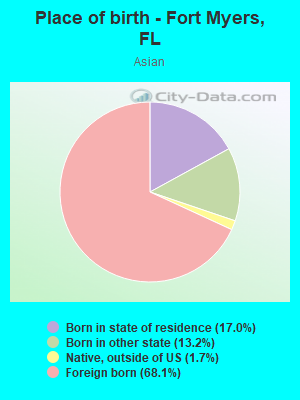
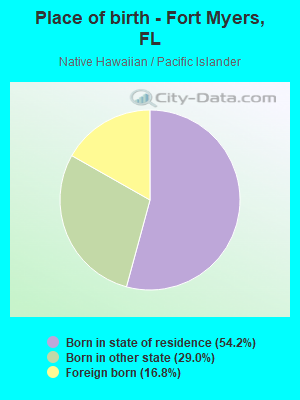
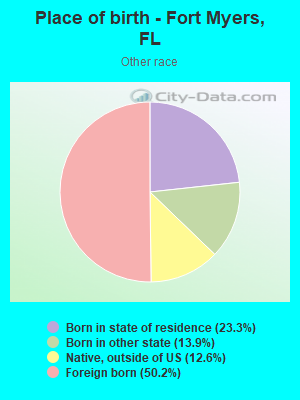
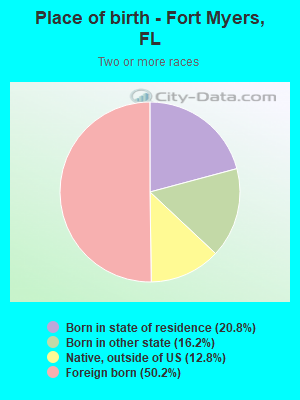
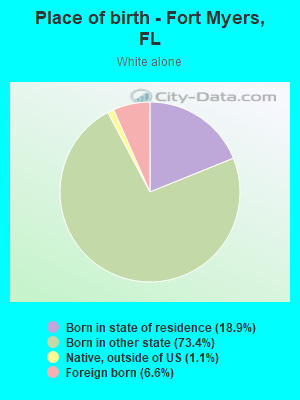
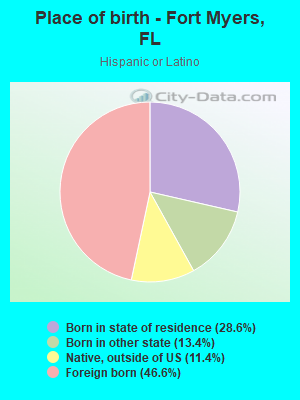
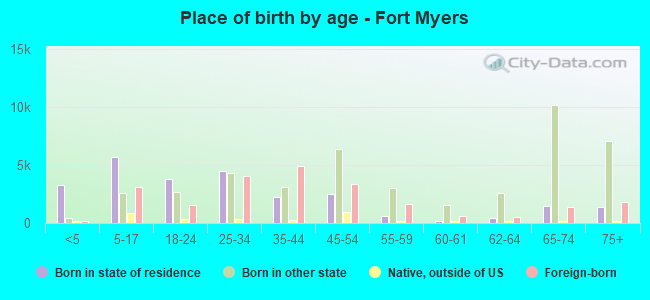
Place of birth - Born in state of residence (%)
Place of birth - Born in state of residence (%) - White
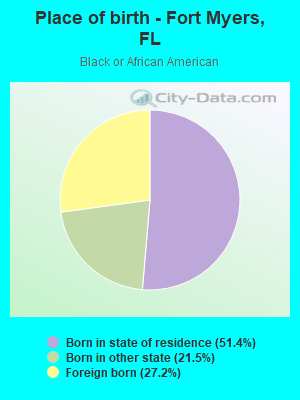
Place of birth - Born in state of residence (%) - Black or African American
Place of birth - Born in state of residence (%) - Asian
Place of birth - Born in state of residence (%) - Hispanic or Latino
Place of birth - Born in state of residence (%) - American Indian and Alaska Native
Place of birth - Born in state of residence (%) - Multirace
Place of birth - Born in state of residence (%) - Other Race
Place of birth - Born in other state (%)
Place of birth - Born in other state (%) - White
Place of birth - Born in other state (%) - Black or African American
Place of birth - Born in other state (%) - Asian
Place of birth - Born in other state (%) - Hispanic or Latino
Place of birth - Born in other state (%) - American Indian and Alaska Native
Place of birth - Born in other state (%) - Multirace
Place of birth - Born in other state (%) - Other Race
Place of birth - Native, outside of US (%)
Place of birth - Native, outside of US (%) - White
Place of birth - Native, outside of US (%) - Black or African American
Place of birth - Native, outside of US (%) - Asian
Place of birth - Native, outside of US (%) - Hispanic or Latino
Place of birth - Native, outside of US (%) - American Indian and Alaska Native
Place of birth - Native, outside of US (%) - Multirace
Place of birth - Native, outside of US (%) - Other Race
Place of birth - Foreign born (%)
Place of birth - Foreign born (%) - White
Place of birth - Foreign born (%) - Black or African American
Place of birth - Foreign born (%) - Asian
Place of birth - Foreign born (%) - Hispanic or Latino
Place of birth - Foreign born (%) - American Indian and Alaska Native
Place of birth - Foreign born (%) - Multirace
Place of birth - Foreign born (%) - Other Race
Residents speaking English at home (%)
Residents speaking English at home - Born in the United States (%)
Residents speaking English at home - Native, born elsewhere (%)
Residents speaking English at home - Foreign born (%)
Residents speaking Spanish at home (%)
Residents speaking Spanish at home - Born in the United States (%)
Residents speaking Spanish at home - Native, born elsewhere (%)
Residents speaking Spanish at home - Foreign born (%)
Residents speaking other language at home (%)
Residents speaking other language at home - Born in the United States (%)
Residents speaking other language at home - Native, born elsewhere (%)
Residents speaking other language at home - Foreign born (%)
Marital status - Never married (%)
Marital status - Now married (%)
Marital status - Separated (%)
Marital status - Widowed (%)
Marital status - Divorced (%)
Ancestries Reported - Arab (%)
Ancestries Reported - Czech (%)
Ancestries Reported - Danish (%)
Ancestries Reported - Dutch (%)
Ancestries Reported - English (%)
Ancestries Reported - French (%)
Ancestries Reported - French Canadian (%)
Ancestries Reported - German (%)
Ancestries Reported - Greek (%)
Ancestries Reported - Hungarian (%)
Ancestries Reported - Irish (%)
Ancestries Reported - Italian (%)
Ancestries Reported - Lithuanian (%)
Ancestries Reported - Norwegian (%)
Ancestries Reported - Polish (%)
Ancestries Reported - Portuguese (%)
Ancestries Reported - Russian (%)
Ancestries Reported - Scotch-Irish (%)
Ancestries Reported - Scottish (%)
Ancestries Reported - Slovak (%)
Ancestries Reported - Subsaharan African (%)
Ancestries Reported - Swedish (%)
Ancestries Reported - Swiss (%)
Ancestries Reported - Ukrainian (%)
Ancestries Reported - United States (%)
Ancestries Reported - Welsh (%)
Ancestries Reported - West Indian (%)
Ancestries Reported - Other (%)
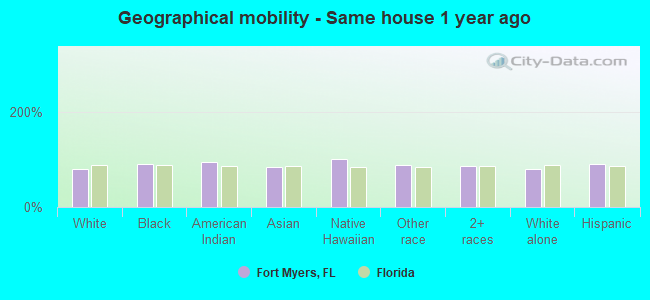
Geographical mobility - Same house 1 year ago (%)
Geographical mobility - Same house 1 year ago (%) - White
Geographical mobility - Same house 1 year ago (%) - Black or African American
Geographical mobility - Same house 1 year ago (%) - Asian
Geographical mobility - Same house 1 year ago (%) - Hispanic or Latino
Geographical mobility - Same house 1 year ago (%) - American Indian and Alaska Native
Geographical mobility - Same house 1 year ago (%) - Multirace
Geographical mobility - Same house 1 year ago (%) - Other Race
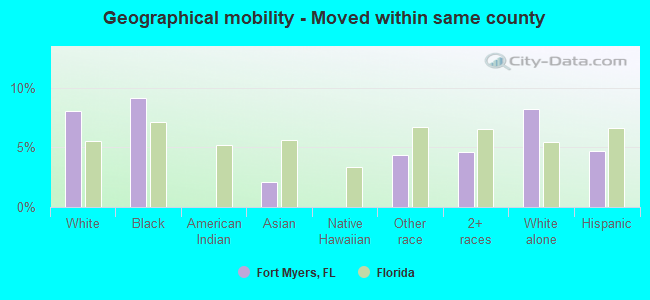
Geographical mobility - Moved within same county (%)
Geographical mobility - Moved within same county (%) - White
Geographical mobility - Moved within same county (%) - Black or African American
Geographical mobility - Moved within same county (%) - Asian
Geographical mobility - Moved within same county (%) - Hispanic or Latino
Geographical mobility - Moved within same county (%) - American Indian and Alaska Native
Geographical mobility - Moved within same county (%) - Multirace
Geographical mobility - Moved within same county (%) - Other Race
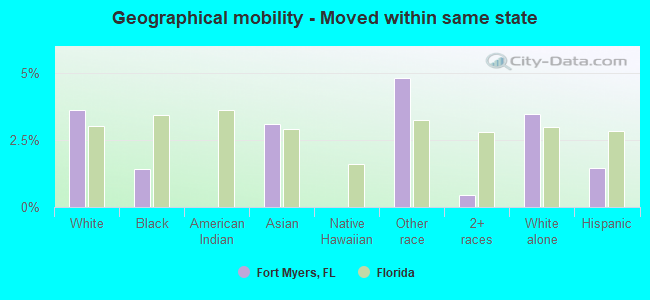
Geographical mobility - Moved from different county within same state (%)
Geographical mobility - Moved from different county within same state (%) - White
Geographical mobility - Moved from different county within same state (%) - Black or African American
Geographical mobility - Moved from different county within same state (%) - Asian
Geographical mobility - Moved from different county within same state (%) - Hispanic or Latino
Geographical mobility - Moved from different county within same state (%) - American Indian and Alaska Native
Geographical mobility - Moved from different county within same state (%) - Multirace
Geographical mobility - Moved from different county within same state (%) - Other Race
Geographical mobility - Moved from different state (%)
Geographical mobility - Moved from different state (%) - White
Geographical mobility - Moved from different state (%) - Black or African American
Geographical mobility - Moved from different state (%) - Asian
Geographical mobility - Moved from different state (%) - Hispanic or Latino
Geographical mobility - Moved from different state (%) - American Indian and Alaska Native
Geographical mobility - Moved from different state (%) - Multirace
Geographical mobility - Moved from different state (%) - Other Race
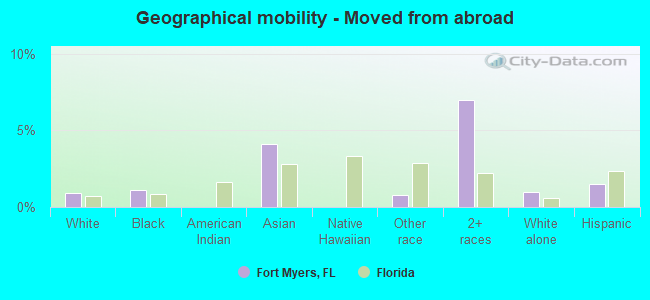
Geographical mobility - Moved from abroad (%)
Geographical mobility - Moved from abroad (%) - White
Geographical mobility - Moved from abroad (%) - Black or African American
Geographical mobility - Moved from abroad (%) - Asian
Geographical mobility - Moved from abroad (%) - Hispanic or Latino
Geographical mobility - Moved from abroad (%) - American Indian and Alaska Native
Geographical mobility - Moved from abroad (%) - Multirace
Geographical mobility - Moved from abroad (%) - Other Race
Place of birth for the foreign-born population - Ireland (%)
Place of birth for the foreign-born population - Denmark (%)
Place of birth for the foreign-born population - Norway (%)
Place of birth for the foreign-born population - Sweden (%)
Place of birth for the foreign-born population - United Kingdom (%)
Place of birth for the foreign-born population - England (%)
Place of birth for the foreign-born population - Scotland (%)
Place of birth for the foreign-born population - Other Northern Europe (%)
Place of birth for the foreign-born population - Austria (%)
Place of birth for the foreign-born population - Belgium (%)
Place of birth for the foreign-born population - France (%)
Place of birth for the foreign-born population - Germany (%)
Place of birth for the foreign-born population - Netherlands (%)
Place of birth for the foreign-born population - Switzerland (%)
Place of birth for the foreign-born population - Other Western Europe (%)
Place of birth for the foreign-born population - Greece (%)
Place of birth for the foreign-born population - Italy (%)
Place of birth for the foreign-born population - Portugal (%)
Place of birth for the foreign-born population - Spain (%)
Place of birth for the foreign-born population - Other Southern Europe (%)
Place of birth for the foreign-born population - Albania (%)
Place of birth for the foreign-born population - Belarus (%)
Place of birth for the foreign-born population - Bosnia and Herzegovina (%)
Place of birth for the foreign-born population - Bulgaria (%)
Place of birth for the foreign-born population - Croatia (%)
Place of birth for the foreign-born population - Czechoslovakia (%)
Place of birth for the foreign-born population - Hungary (%)
Place of birth for the foreign-born population - Latvia (%)
Place of birth for the foreign-born population - Lithuania (%)
Place of birth for the foreign-born population - North Macedonia (Macedonia) (%)
Place of birth for the foreign-born population - Moldova (%)
Place of birth for the foreign-born population - Poland (%)
Place of birth for the foreign-born population - Romania (%)
Place of birth for the foreign-born population - Russia (%)
Place of birth for the foreign-born population - Serbia (%)
Place of birth for the foreign-born population - Ukraine (%)
Place of birth for the foreign-born population - Other Eastern Europe (%)
Place of birth for the foreign-born population - China (%)
Place of birth for the foreign-born population - Hong Kong (%)
Place of birth for the foreign-born population - Taiwan (%)
Place of birth for the foreign-born population - Japan (%)
Place of birth for the foreign-born population - Korea (%)
Place of birth for the foreign-born population - Other Eastern Asia (%)
Place of birth for the foreign-born population - Afghanistan (%)
Place of birth for the foreign-born population - Bangladesh (%)
Place of birth for the foreign-born population - India (%)
Place of birth for the foreign-born population - Iran (%)
Place of birth for the foreign-born population - Kazakhstan (%)
Place of birth for the foreign-born population - Nepal (%)
Place of birth for the foreign-born population - Pakistan (%)
Place of birth for the foreign-born population - Sri Lanka (%)
Place of birth for the foreign-born population - Uzbekistan (%)
Place of birth for the foreign-born population - Other South Central Asia (%)
Place of birth for the foreign-born population - Burma (%)
Place of birth for the foreign-born population - Cambodia (%)
Place of birth for the foreign-born population - Indonesia (%)
Place of birth for the foreign-born population - Laos (%)
Place of birth for the foreign-born population - Malaysia (%)
Place of birth for the foreign-born population - Philippines (%)
Place of birth for the foreign-born population - Singapore (%)
Place of birth for the foreign-born population - Thailand (%)
Place of birth for the foreign-born population - Vietnam (%)
Place of birth for the foreign-born population - Other South Eastern Asia (%)
Place of birth for the foreign-born population - Armenia (%)
Place of birth for the foreign-born population - Iraq (%)
Place of birth for the foreign-born population - Israel (%)
Place of birth for the foreign-born population - Jordan (%)
Place of birth for the foreign-born population - Kuwait (%)
Place of birth for the foreign-born population - Lebanon (%)
Place of birth for the foreign-born population - Saudi Arabia (%)
Place of birth for the foreign-born population - Syria (%)
Place of birth for the foreign-born population - Turkey (%)
Place of birth for the foreign-born population - Yemen (%)
Place of birth for the foreign-born population - Other Western Asia (%)
Place of birth for the foreign-born population - Eritrea (%)
Place of birth for the foreign-born population - Ethiopia (%)
Place of birth for the foreign-born population - Kenya (%)
Place of birth for the foreign-born population - Somalia (%)
Place of birth for the foreign-born population - Uganda (%)
Place of birth for the foreign-born population - Zimbabwe (%)
Place of birth for the foreign-born population - Other Eastern Africa (%)
Place of birth for the foreign-born population - Cameroon (%)
Place of birth for the foreign-born population - Congo (%)
Place of birth for the foreign-born population - Democratic Republic of Congo (Zaire) (%)
Place of birth for the foreign-born population - Other Middle Africa (%)
Place of birth for the foreign-born population - Egypt (%)
Place of birth for the foreign-born population - Morocco (%)
Place of birth for the foreign-born population - Sudan (%)
Place of birth for the foreign-born population - Other Northern Africa (%)
Place of birth for the foreign-born population - South Africa (%)
Place of birth for the foreign-born population - Other Southern Africa (%)
Place of birth for the foreign-born population - Cabo Verde (%)
Place of birth for the foreign-born population - Ghana (%)
Place of birth for the foreign-born population - Liberia (%)
Place of birth for the foreign-born population - Nigeria (%)
Place of birth for the foreign-born population - Senegal (%)
Place of birth for the foreign-born population - Sierra Leone (%)
Place of birth for the foreign-born population - Other Western Africa (%)
Place of birth for the foreign-born population - Australia (%)
Place of birth for the foreign-born population - New Zealand (%)
Place of birth for the foreign-born population - Fiji (%)
Place of birth for the foreign-born population - Micronesia (%)
Place of birth for the foreign-born population - Bahamas (%)
Place of birth for the foreign-born population - Barbados (%)
Place of birth for the foreign-born population - Cuba (%)
Place of birth for the foreign-born population - Dominica (%)
Place of birth for the foreign-born population - Dominican Republic (%)
Place of birth for the foreign-born population - Grenada (%)
Place of birth for the foreign-born population - Haiti (%)
Place of birth for the foreign-born population - Jamaica (%)
Place of birth for the foreign-born population - St. Vincent and the Grenadines (%)
Place of birth for the foreign-born population - Trinidad and Tobago (%)
Place of birth for the foreign-born population - West Indies (%)
Place of birth for the foreign-born population - Other Caribbean (%)
Place of birth for the foreign-born population - Belize (%)
Place of birth for the foreign-born population - Costa Rica (%)
Place of birth for the foreign-born population - El Salvador (%)
Place of birth for the foreign-born population - Guatemala (%)
Place of birth for the foreign-born population - Honduras (%)
Place of birth for the foreign-born population - Mexico (%)
Place of birth for the foreign-born population - Nicaragua (%)
Place of birth for the foreign-born population - Panama (%)
Place of birth for the foreign-born population - Other Central America (%)
Place of birth for the foreign-born population - Argentina (%)
Place of birth for the foreign-born population - Bolivia (%)
Place of birth for the foreign-born population - Brazil (%)
Place of birth for the foreign-born population - Chile (%)
Place of birth for the foreign-born population - Colombia (%)
Place of birth for the foreign-born population - Ecuador (%)
Place of birth for the foreign-born population - Guyana (%)
Place of birth for the foreign-born population - Peru (%)
Place of birth for the foreign-born population - Uruguay (%)
Place of birth for the foreign-born population - Venezuela (%)
Place of birth for the foreign-born population - Other South America (%)
Place of birth for the foreign-born population - Canada (%)
Place of birth for the foreign-born population - Other Northern America (%)
Place of birth for the foreign-born population - Other (%)
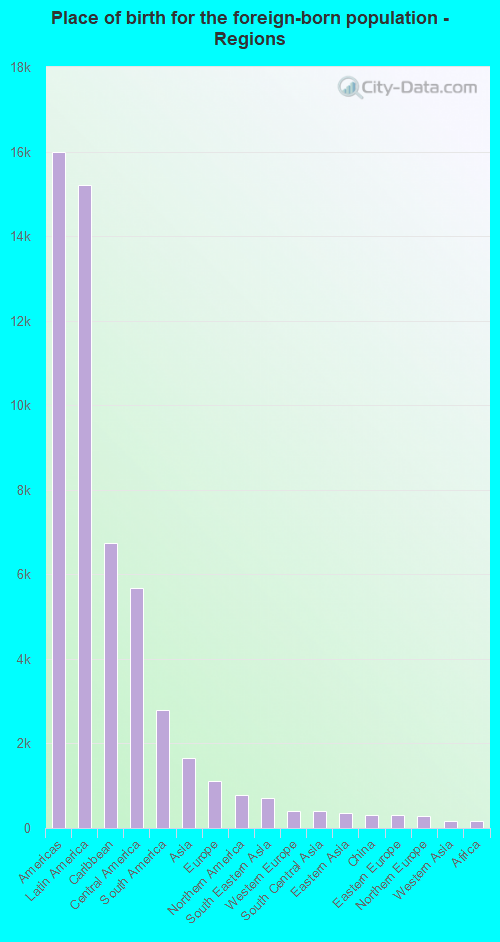
According to 2022 data, the most numerous races in Fort Myers, FL are White alone (46,846 residents), Hispanic (23,203 residents), and Black alone (17,992 residents). 69.4% of Fort Myers residents speak English at home. 20.1% of Fort Myers, FL residents are foreign-born (16.3% born in Latin America), which is 4.3% less than the foreign-born rate of 21.0% across the entire state of Florida.
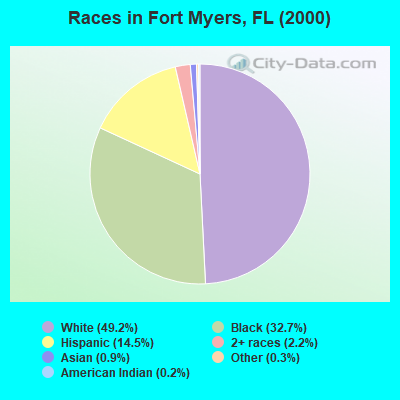
Race distribution in Fort Myers
2000 2022
10,458,509 65.4% White alone 2,682,715 16.8% Hispanic 2,264,268 14.2% Black alone 261,693 1.6% Asian alone 236,954 1.5% Two or more races 42,358 0.3% American Indian alone 28,994 0.2% Other race alone 6,887 0.04% Native Hawaiian and Other
11,309,403 50.8% White alone 6,025,039 27.1% Hispanic 3,241,015 14.6% Black alone 861,630 3.9% Two or more races 623,692 2.8% Asian alone 152,054 0.7% Other race alone 22,504 0.1% American Indian alone 9,486 0.04% Native Hawaiian and Other
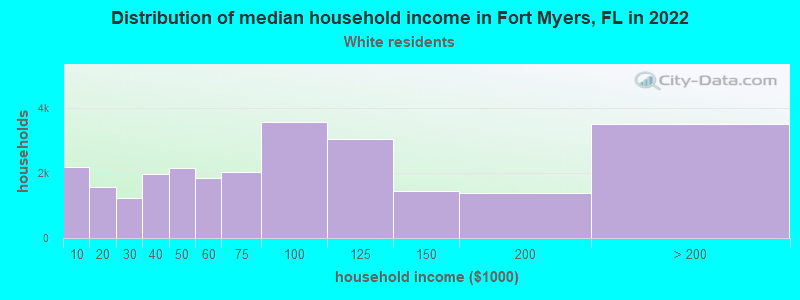
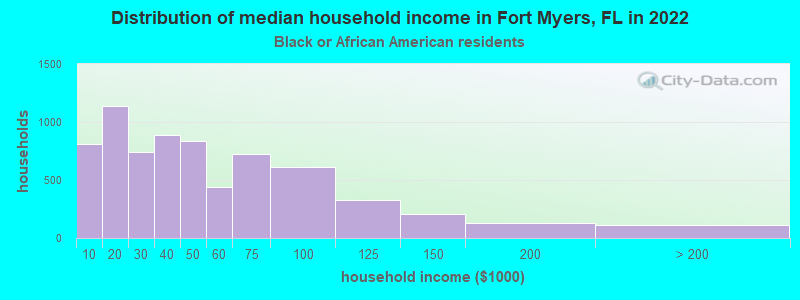
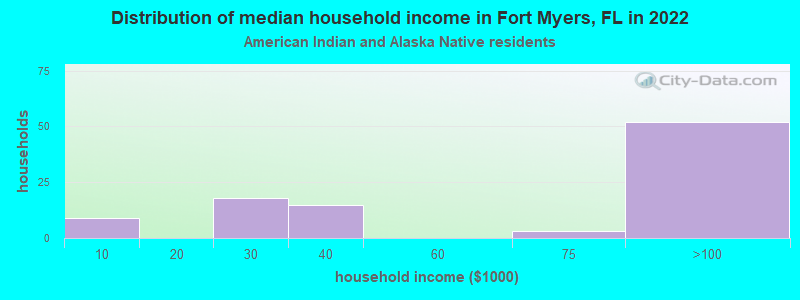
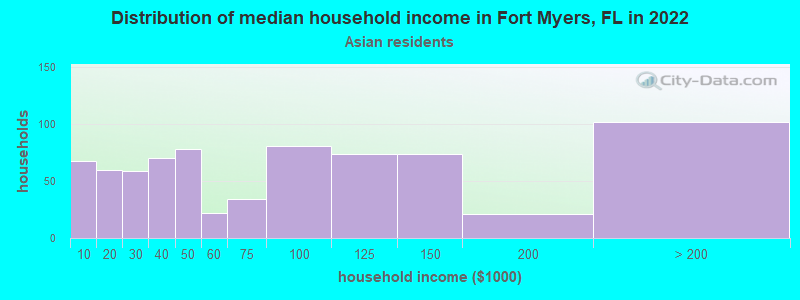
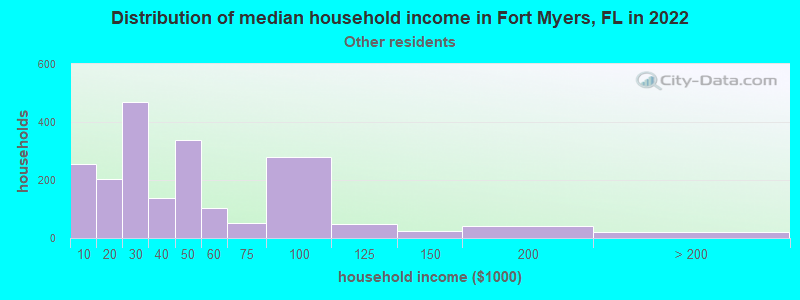
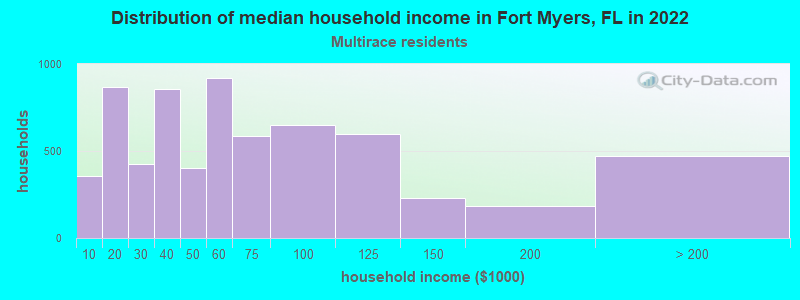
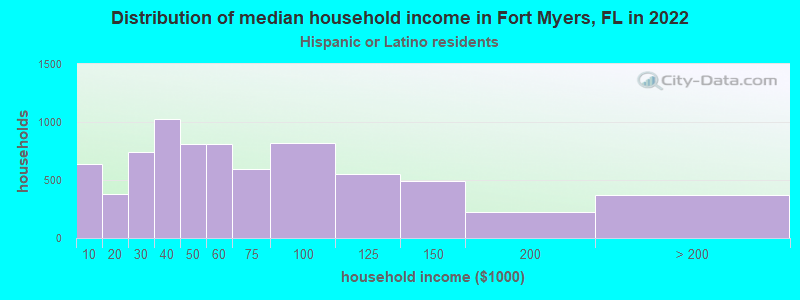
Income and house value in Fort Myers Median household income in 2022 $79,075 White non-Hispanic householders$37,656 Black householders$75,885 Asian householders$30,446 Some other race householders$57,614 Two or more races householders$51,250 Hispanic or Latino race householdersMedian 2022 house value $521,924 White Non-Hispanic householders$330,439 Black or African American householders$635,460 American Indian or Alaska Native householders $560,899 Asian householders$267,175 Some other race householders$408,389 Two or more races householders$331,569 Hispanic or Latino householders
Median age by race in Fort Myers
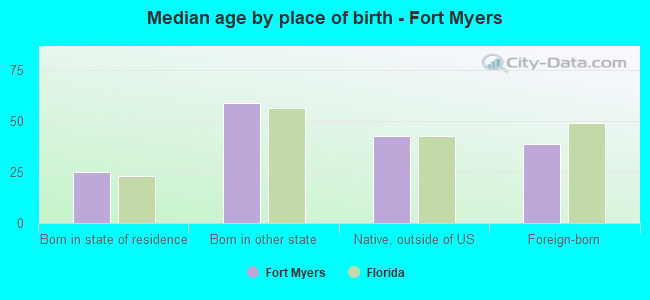
57.7 Median age for White residents53.6 60.1 32.5 Median age for Black or African American residents31.4 34.5 24.0 Median age for American Indian / Alaska Native residents21.5 24.7 41.2 Median age for Asian residents41.1 45.1 -666,666,666.0 Median age for Native Hawaiian / Pacific Islander residents-666,666,666.0 -666,666,666.0 47.9 Median age for Other race residents48.0 45.9 33.0 Median age for Two or more races residents31.6 35.9 59.2 Median age for White alone residents56.4 61.1 28.8 Median age for Hispanic or Latino residents26.1 33.2
Owner/renter occupied households by race in Fort Myers
House owners and renters - White residents 15,828 61.0% Owner occupied10,125 39.0% Renter occupiedHouse owners and renters - Black or African American residents 1,671 27.9% Owner occupied4,319 72.1% Renter occupiedHouse owners and renters - American Indian / Alaska Native residents 40 40.1% Owner occupied60 59.9% Renter occupiedHouse owners and renters - Asian residents 622 63.5% Owner occupied358 36.5% Renter occupiedHouse owners and renters - Native Hawaiian / Pacific Islander residents 32 100.0% Renter occupiedHouse owners and renters - Other race residents 435 25.5% Owner occupied1,272 74.5% Renter occupiedHouse owners and renters - Two or more races residents 2,260 33.7% Owner occupied4,439 66.3% Renter occupiedHouse owners and renters - White alone residents 15,307 62.9% Owner occupied9,037 37.1% Renter occupiedHouse owners and renters - Hispanic or Latino residents 2,419 32.4% Owner occupied5,044 67.6% Renter occupied
Language usage in Fort Myers
English speakers - Total 69.4% of residents of Fort Myers speak English at home.
19.9% of residents speak Spanish at home 7,981 43.6% Speak English very well10,308 56.4% Speak English less than very well10.7% of residents speak other language at home 5,784 58.8% Speak English very well4,051 41.2% Speak English less than very well
English speakers - Born in the United States 90.6% of residents of Fort Myers speak English at home.
5.5% of residents speak Spanish at home 2,081 87.7% Speak English very well291 12.3% Speak English less than very well3.9% of residents speak other language at home 1,650 96.3% Speak English very well64 3.7% Speak English less than very well
English speakers - Native, born elsewhere 28.3% of residents of Fort Myers speak English at home.
71.7% of residents speak Spanish at home 616 26.6% Speak English very well1,700 73.4% Speak English less than very well
English speakers - Foreign-born 22.3% of residents of Fort Myers speak English at home.
44.1% of residents speak Spanish at home 2,503 24.8% Speak English very well7,579 75.2% Speak English less than very well33.6% of residents speak other language at home 3,693 48.1% Speak English very well3,987 51.9% Speak English less than very well
White (Caucasian) - Speak only English Native:
93.1% (42,369)Foreign-born:
52.8% (1,923)
White (Caucasian) - Speak another language Native:
6.9% (3,164)Foreign-born:
47.2% (1,716)
Black or African American - Speak only English Native:
95.9% (11,862)Foreign-born:
34.0% (1,593)
Black or African American - Speak another language Native:
4.1% (513)Foreign-born:
66.0% (3,093)
American Indian / Alaska Native - Speak only English Native:
42.8% (71)Foreign-born:
6.1% (40)
American Indian / Alaska Native - Speak another language Native:
65.3% (108)Foreign-born:
94.2% (613)
Asian - Speak only English Native:
75.2% (572)Foreign-born:
37.9% (766)
Asian - Speak another language Native:
24.8% (189)Foreign-born:
62.1% (1,256)
Native Hawaiian / Pacific Islander - Speak another language Native:
61.1% (49)Foreign-born:
100.0% (28)
Other race - Speak only English Native:
61.8% (593)Foreign-born:
7.2% (80)
Other race - Speak another language Native:
38.2% (366)Foreign-born:
92.8% (1,028)
Two or more races - Speak only English Native:
36.6% (3,235)Foreign-born:
7.7% (749)
Two or more races - Speak another language Native:
63.4% (5,594)Foreign-born:
92.3% (8,989)
White alone - Speak only English Native:
95.9% (41,023)Foreign-born:
56.4% (1,747)
White alone - Speak another language Native:
4.1% (1,740)Foreign-born:
43.6% (1,349)
Hispanic or Latino - Speak only English Native:
26.2% (2,752)Foreign-born:
8.7% (942)
Hispanic or Latino - Speak another language Native:
73.8% (7,763)Foreign-born:
91.3% (9,882)
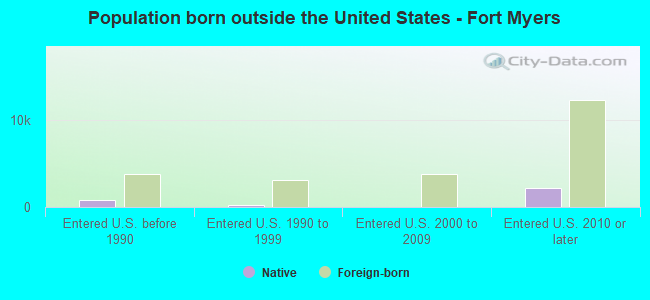
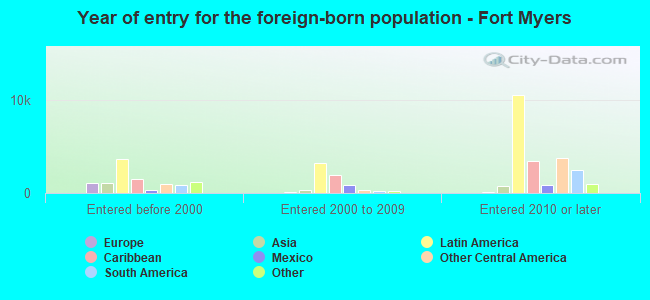
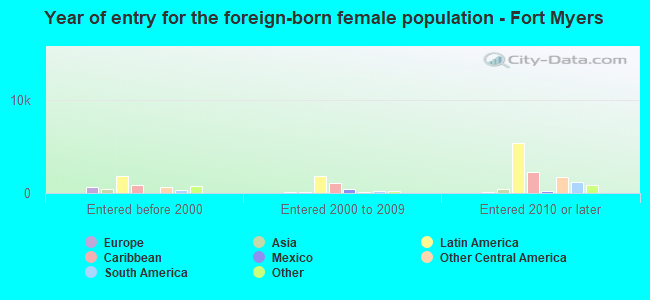
Foreign-born residents in Fort Myers 19,010 residents are foreign born (16.3% Latin America ).
This city:
20.1%Florida:
21.1%
Marital status for residents in Fort Myers Marital status - White (Caucasian) population 15 years and over
Males 29.5% Never married54.1% Now married1.0% Separated2.0% Widowed13.4% DivorcedFemales 26.1% Never married46.1% Now married1.8% Separated13.4% Widowed12.6% DivorcedWomen who gave birth in the past 12 months Now married:
74.7% (162)Unmarried:
25.3% (55)
Women who did not give birth in the past 12 months Now married:
35.6% (2,730)Unmarried:
64.4% (4,945)
Marital status - Black or African American population 15 years and over
Males 43.6% Never married22.1% Now married1.4% Separated5.1% Widowed27.8% DivorcedFemales 55.2% Never married22.4% Now married4.2% Separated11.4% Widowed6.7% DivorcedWomen who gave birth in the past 12 months Now married:
17.4% (73)Unmarried:
82.6% (346)
Women who did not give birth in the past 12 months Now married:
21.9% (1,154)Unmarried:
78.1% (4,117)
Marital status - American Indian / Alaska Native population 15 years and over
Males 70.1% Never married22.6% Now married0.0% Separated0.0% Widowed7.2% DivorcedFemales 59.7% Never married28.8% Now married0.0% Separated6.5% Widowed5.0% DivorcedWomen who gave birth in the past 12 months Now married:
0.0% (0)Unmarried:
100.0% (121)
Women who did not give birth in the past 12 months Now married:
48.4% (25)Unmarried:
51.6% (26)
Marital status - Asian population 15 years and over
Males 31.4% Never married53.5% Now married1.3% Separated0.0% Widowed13.9% DivorcedFemales 19.2% Never married64.0% Now married0.0% Separated6.9% Widowed9.9% DivorcedWomen who did not give birth in the past 12 months Now married:
67.0% (423)Unmarried:
33.0% (209)
Marital status - Native Hawaiian / Pacific Islander population 15 years and over
Males 36.1% Never married63.9% Now married0.0% Separated0.0% Widowed0.0% DivorcedFemales 100.0% Never married0.0% Now married0.0% Separated0.0% Widowed0.0% DivorcedWomen who did not give birth in the past 12 months Now married:
0.0% (0)Unmarried:
100.0% (2)
Marital status - Other race population 15 years and over
Males 45.4% Never married33.7% Now married2.1% Separated0.0% Widowed18.8% DivorcedFemales 33.5% Never married45.3% Now married1.0% Separated9.0% Widowed11.2% DivorcedWomen who gave birth in the past 12 months Now married:
69.7% (90)Unmarried:
30.3% (39)
Women who did not give birth in the past 12 months Now married:
43.7% (456)Unmarried:
56.3% (589)
Marital status - Two or more races population 15 years and over
Males 40.4% Never married56.2% Now married0.0% Separated0.0% Widowed3.4% DivorcedFemales 36.6% Never married42.0% Now married3.7% Separated5.2% Widowed12.4% DivorcedWomen who gave birth in the past 12 months Now married:
33.7% (97)Unmarried:
66.3% (191)
Women who did not give birth in the past 12 months Now married:
42.9% (2,438)Unmarried:
57.1% (3,248)
Marital status - White alone, not Hispanic / Latino population 15 years and over
Males 29.9% Never married54.2% Now married1.1% Separated2.1% Widowed12.8% DivorcedFemales 23.7% Never married47.8% Now married2.0% Separated14.4% Widowed12.2% DivorcedWomen who gave birth in the past 12 months Now married:
67.5% (114)Unmarried:
32.5% (55)
Women who did not give birth in the past 12 months Now married:
35.1% (2,303)Unmarried:
64.9% (4,266)
Marital status - Hispanic or Latino population 15 years and over
Males 46.2% Never married48.6% Now married0.8% Separated0.0% Widowed4.4% DivorcedFemales 45.9% Never married31.6% Now married3.5% Separated4.7% Widowed14.3% DivorcedWomen who gave birth in the past 12 months Now married:
6.3% (48)Unmarried:
93.7% (714)
Women who did not give birth in the past 12 months Now married:
39.1% (2,361)Unmarried:
60.9% (3,671)
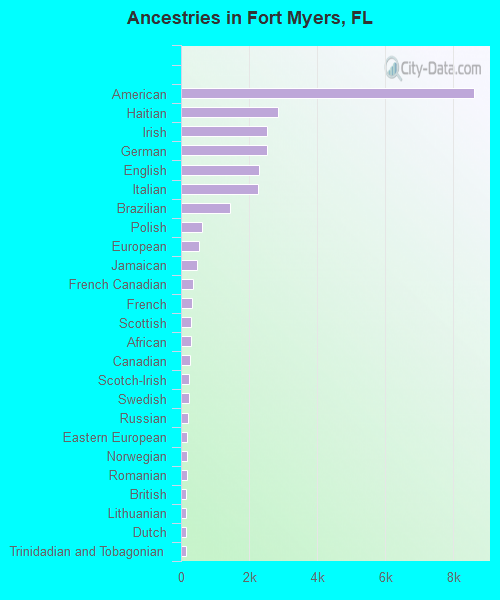
Ancestries in Fort Myers
8,616 15.7% American2,850 5.2% Haitian2,534 4.6% Irish2,521 4.6% German2,304 4.2% English2,265 4.1% Italian1,451 2.6% Brazilian606 1.1% Polish535 1.0% European481 0.9% Jamaican348 0.6% French Canadian319 0.6% French305 0.6% Scottish299 0.5% African251 0.5% Canadian240 0.4% Scotch-Irish229 0.4% Swedish199 0.4% Russian184 0.3% Eastern European184 0.3% Norwegian171 0.3% Romanian161 0.3% British160 0.3% Lithuanian145 0.3% Dutch144 0.3% Trinidadian and Tobagonian138 0.3% Portuguese128 0.2% Lebanese90 0.2% Hungarian89 0.2% Austrian88 0.2% Yugoslavian87 0.2% South African86 0.2% Northern European75 0.1% Greek73 0.1% Danish65 0.1% Swiss61 0.1% Israeli60 0.1% Czech59 0.1% Scandinavian51 0.09% Bahamian45 0.08% British West Indian40 0.07% Slovak37 0.07% Zimbabwean34 0.06% Albanian34 0.06% Ukrainian31 0.06% Egyptian29 0.05% Moroccan28 0.05% Nigerian27 0.05% Kenyan22 0.04% Guyanese13 0.02% Welsh12 0.02% Slavic11 0.02% Czechoslovakian9 0.02% Finnish9 0.02% Maltese9 0.02% Serbian9 0.02% Slovene9 0.02% Iranian7 0.01% Palestinian6 0.01% Pennsylvania German5 0.01% Belizean4 0.01% Croatian4 0.01% Celtic4 0.01% West Indian
Geographical mobility in Fort Myers Same house 1 year ago 40,347 80.1% White (Caucasian)17,842 90.6% Black or African American669 95.4% American Indian / Alaska Native1,782 83.5% Asian156 100.0% Native Hawaiian / Pacific Islander4,328 87.1% Other race16,115 85.2% Two or more races36,989 79.4% White alone, not Hispanic / Latino20,025 89.6% Hispanic or LatinoMoved within same county 4,072 8.1% White / Caucasian1,802 9.2% Black or African American45 2.1% Asian218 4.4% Other race876 4.6% Two or more races3,840 8.2% White alone, not Hispanic / Latino1,044 4.7% Hispanic or LatinoMoved within same state 1,830 3.6% White / Caucasian282 1.4% Black or African American66 3.1% Asian238 4.8% Other race83 0.4% Two or more races1,611 3.5% White alone, not Hispanic / Latino329 1.5% Hispanic or LatinoMoved from different state 3,687 7.3% White / Caucasian356 1.8% Black or African American42 6.0% American Indian / Alaska Native137 6.4% Asian129 2.6% Other race526 2.8% Two or more races3,687 7.9% White alone, not Hispanic / Latino621 2.8% Hispanic or LatinoMoved from abroad 460 0.9% White221 1.1% Black or African American88 4.1% Asian38 0.8% Other race1,325 7.0% Two or more races460 1.0% White alone, not Hispanic / Latino331 1.5% Hispanic or Latino
Children Nativity (place of birth) in Fort Myers
Children under 6 years - Living with two parents Both parents native 1,180 100.0% NativeBoth parents foreign-born 289 59.1% Native200 40.9% Foreign-bornOne native, one foreign-born parent 502 100.0% NativeChildren under 6 years - Living with one parent Native parent 1,094 100.0% NativeForeign-born parent 1,296 100.0% NativeChildren 6 to 17 years - Living with two parents Both parents native 1,725 100.0% NativeBoth parents foreign-born 946 37.9% Native1,551 62.1% Foreign-bornOne native, one foreign-born parent 1,186 89.9% Native133 10.1% Foreign-bornChildren 6 to 17 years - Living with one parent Native parent 1,115 89.0% Native138 11.0% Foreign-bornForeign-born parent 2,770 67.8% Native1,316 32.2% Foreign-born
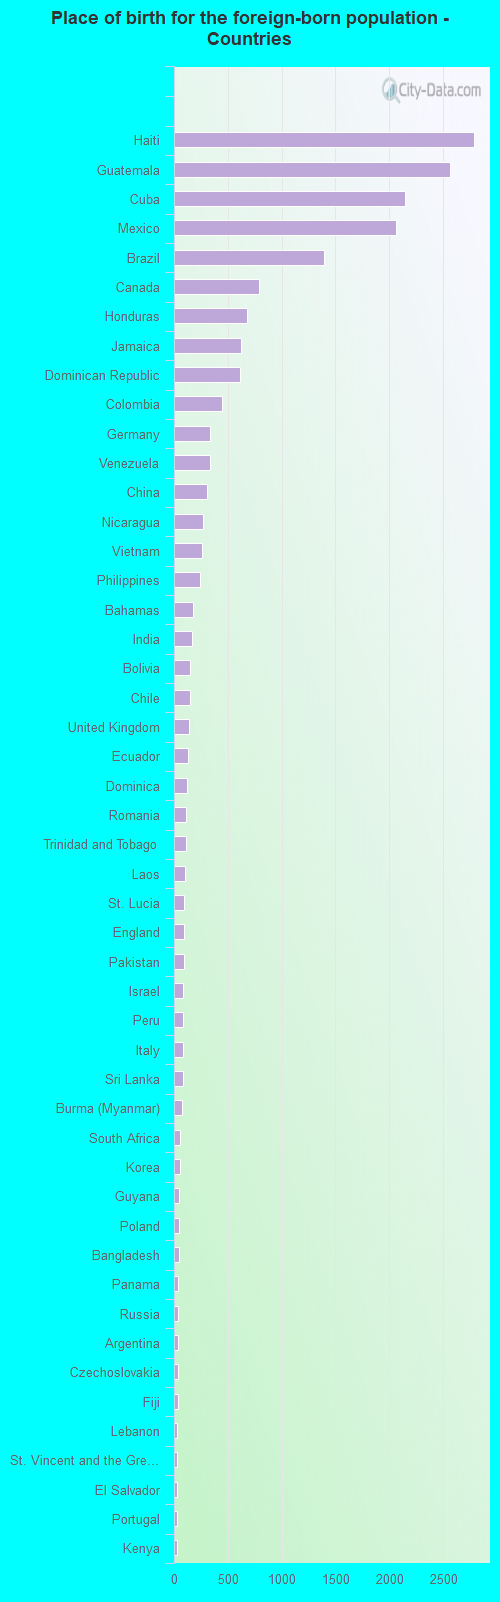
Place of birth for residents in Fort Myers 15,996 Americas15,207 Latin America6,740 Caribbean5,674 Central America2,792 South America1,652 Asia1,112 Europe788 Northern America708 South Eastern Asia394 Western Europe391 South Central Asia361 Eastern Asia308 China302 Eastern Europe276 Northern Europe171 Western Asia165 Africa137 Southern Europe84 Oceania60 Southern Africa49 Eastern Africa35 Northern Africa20 Western Africa2,788 Haiti2,568 Guatemala2,150 Cuba2,067 Mexico1,395 Brazil788 Canada683 Honduras627 Jamaica613 Dominican Republic449 Colombia333 Germany331 Venezuela308 China274 Nicaragua262 Vietnam243 Philippines174 Bahamas168 India151 Bolivia150 Chile144 United Kingdom133 Ecuador117 Dominica108 Romania108 Trinidad and Tobago102 Laos93 St. Lucia90 England90 Pakistan88 Israel88 Peru84 Italy80 Sri Lanka72 Burma (Myanmar)60 South Africa52 Korea50 Guyana48 Poland44 Bangladesh40 Panama40 Russia36 Argentina34 Czechoslovakia33 Fiji32 Lebanon32 St. Vincent and the Grenadines32 El Salvador31 Portugal29 Kenya25 Netherlands24 Morocco22 Spain22 Barbados21 Syria21 Switzerland21 Iraq20 Zimbabwe20 Denmark14 Austria12 Liberia11 Egypt11 Sweden10 Ireland10 West Indies9 Thailand8 Cambodia8 Iran8 Jordan7 Belize7 Ghana7 Ukraine7 Lithuania6 Singapore6 Bosnia and Herzegovina4 Malaysia4 Uruguay
Grandparents responsible for own grandchildren in Fort Myers
Grandparents (30 to 59 years) White / Caucasian 148 22.9% Responsible for grandchildren498 77.1% Not responsible for grandchildrenBlack or African American 56 72.1% Responsible for grandchildren22 27.9% Not responsible for grandchildrenOther race 20 100.0% Not responsible for grandchildrenTwo or more races 13 100.0% Responsible for grandchildrenWhite alone, not Hispanic / Latino 166 24.2% Responsible for grandchildren520 75.8% Not responsible for grandchildrenHispanic or Latino 23 17.1% Responsible for grandchildren114 82.9% Not responsible for grandchildrenGrandparents (60 years and over) White / Caucasian 47 29.8% Responsible for grandchildren110 70.2% Not responsible for grandchildrenBlack or African American 164 68.5% Responsible for grandchildren76 31.5% Not responsible for grandchildrenOther race 3 9.5% Responsible for grandchildren28 90.5% Not responsible for grandchildrenTwo or more races 122 100.0% Not responsible for grandchildrenWhite alone, not Hispanic / Latino 47 31.3% Responsible for grandchildren103 68.7% Not responsible for grandchildrenHispanic or Latino 3 2.0% Responsible for grandchildren137 98.0% Not responsible for grandchildren