Housing density: 167 houses/condos per square mile
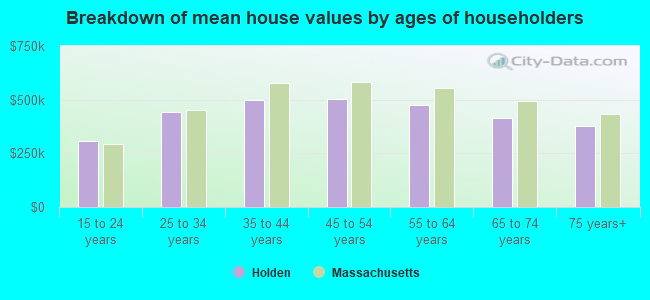
Median price asked for vacant for-sale houses and condos in 2022 in this county: $182,682.
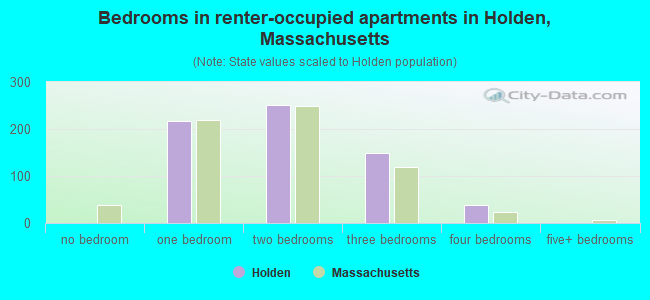
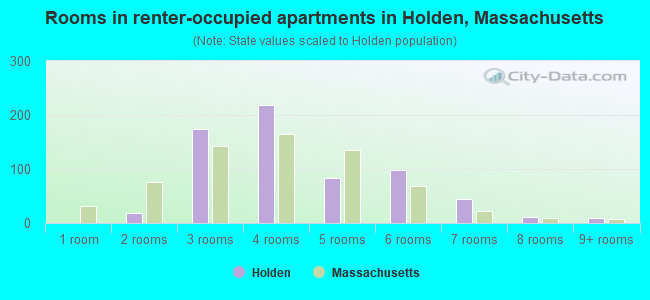
Median contract rent in 2022: $1,206 (lower quartile is $907, upper quartile is $1,699)
Median rent asked for vacant for-rent units in 2022: $857
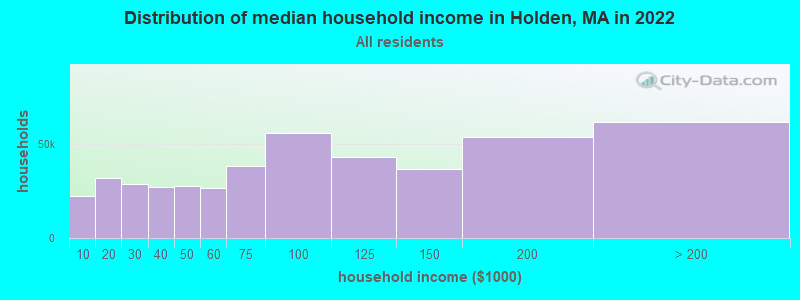
Median gross rent in Holden, MA in 2022: $1,421
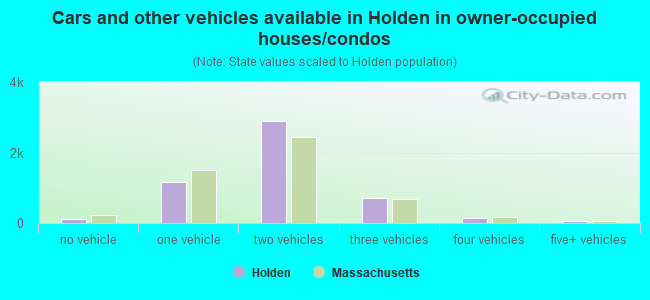
Housing units in Holden with a mortgage: 3,440 (287 second mortgage, 647 home equity loan, 7 both second mortgage and home equity loan) Houses without a mortgage: 1,265
In family households: 644,137 (138,415 male householders, 64,187 female householders)
151,406 spouses, 234,038 children (220,335 natural, 5,096 adopted, 8,607 stepchildren), 11,080 grandchildren, 6,742 brothers or sisters, 7,870 parents, foster children, 7,297 other relatives, 18,119 non-relatives
In nonfamily households: 127,370 (47,312 male householders (35,337 living alone)), 53,166 female householders (44,100 living alone)), 26,892 nonrelatives
In group quarters: 27,045 (11,315 institutionalized population)
135,695 married couples with children.
42,745 single-parent households (8,218 men, 34,527 women).
94.6% of residents of Holden speak English at home.
1.1% of residents speak Spanish at home (51% speak English very well, 30% speak English well, 19% speak English not well).
2.8% of residents speak other Indo-European language at home (71% speak English very well, 21% speak English well, 7% speak English not well, 2% don't speak English at all).
1.1% of residents speak Asian or Pacific Island language at home (55% speak English very well, 25% speak English well, 19% speak English not well).
0.4% of residents speak other language at home (81% speak English very well, 19% speak English well).
Foreign born population: 1,250 (7.0%)
(92.3% of them are naturalized citizens)
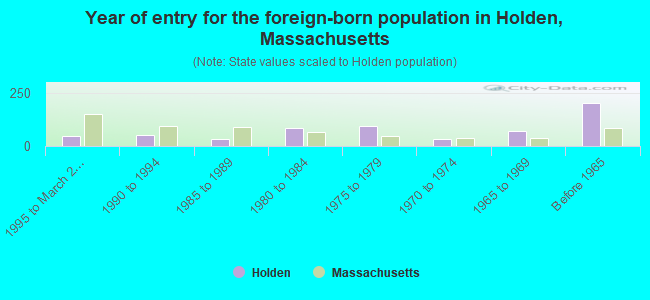
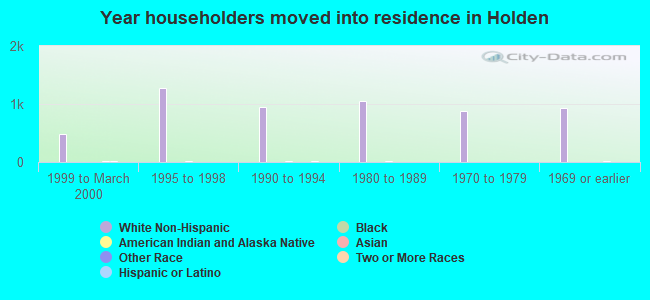
Year of entry for the foreign-born population in Holden, Massachusetts
491995 to March 2000
521990 to 1994
351985 to 1989
831980 to 1984
931975 to 1979
321970 to 1974
691965 to 1969
201Before 1965
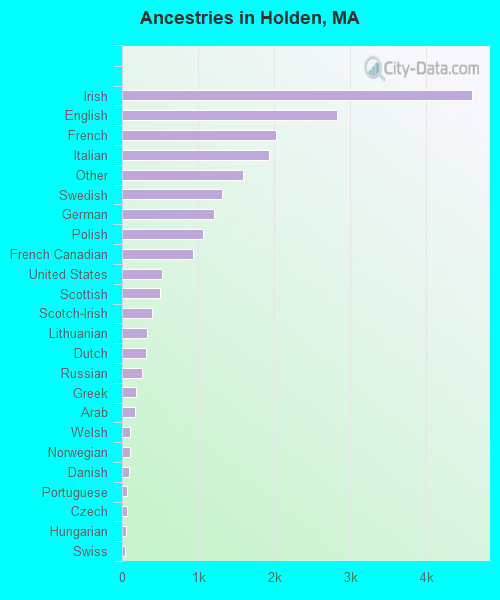
First ancestries reported:
Irish: 4,597 (22.2%)
English: 2,825 (13.6%)
French: 2,024 (9.8%)
Italian: 1,929 (9.3%)
Other: 1,590 (7.7%)
Swedish: 1,316 (6.4%)
German: 1,204 (5.8%)
Polish: 1,061 (5.1%)
French Canadian: 935 (4.5%)
United States: 524 (2.5%)
Scottish: 499 (2.4%)
Scotch-Irish: 396 (1.9%)
Lithuanian: 334 (1.6%)
Dutch: 313 (1.5%)
Russian: 267 (1.3%)
Greek: 180 (0.9%)
Arab: 165 (0.8%)
Welsh: 107 (0.5%)
Norwegian: 101 (0.5%)
Danish: 93 (0.4%)
Portuguese: 69 (0.3%)
Czech: 68 (0.3%)
Hungarian: 49 (0.2%)
Swiss: 43 (0.2%)
Slovak: 24 (0.1%)
Ukrainian: 8 (0.04%)
Most common places of birth for foreign-born residents (%):
United Kingdom
Holden:
10.4% (64)
Massachusetts:
3.3% (25,403)
Vietnam
Holden:
8.1% (50)
Massachusetts:
3.9% (30,457)
Poland
Holden:
7.5% (46)
Massachusetts:
1.8% (13,543)
Germany
Holden:
7.0% (43)
Massachusetts:
1.9% (14,883)
Greece
Holden:
6.7% (41)
Massachusetts:
1.7% (12,975)
Canada
Holden:
5.5% (34)
Massachusetts:
5.2% (40,247)
Japan
Holden:
4.6% (28)
Massachusetts:
1.1% (8,682)
Korea
Holden:
4.4% (27)
Massachusetts:
1.7% (13,456)
Venezuela
Holden:
3.3% (20)
Massachusetts:
0.3% (2,633)
Netherlands
Holden:
3.1% (19)
Massachusetts:
0.3% (2,470)
Turkey
Holden:
2.9% (18)
Massachusetts:
0.5% (3,525)
Taiwan
Holden:
2.6% (16)
Massachusetts:
0.9% (7,258)
Spain
Holden:
2.4% (15)
Massachusetts:
0.3% (1,984)
Ukraine
Holden:
2.4% (15)
Massachusetts:
1.1% (8,754)
Other Eastern Europe
Holden:
2.4% (15)
Massachusetts:
1.6% (12,350)
India
Holden:
2.4% (15)
Massachusetts:
3.6% (28,086)
Sweden
Holden:
2.3% (14)
Massachusetts:
0.3% (2,135)
France
Holden:
2.0% (12)
Massachusetts:
0.8% (5,895)
Italy
Holden:
2.0% (12)
Massachusetts:
3.7% (28,319)
Iran
Holden:
2.0% (12)
Massachusetts:
0.6% (4,416)
Laos
Holden:
1.8% (11)
Massachusetts:
0.4% (3,048)
Egypt
Holden:
1.8% (11)
Massachusetts:
0.4% (2,726)
El Salvador
Holden:
1.8% (11)
Massachusetts:
2.4% (18,606)
Thailand
Holden:
1.6% (10)
Massachusetts:
0.6% (4,578)
Place of birth for U.S.-born residents:
This state: 11,962
Other state: 2,945
Northeast: 1,928
Midwest: 428
South: 406
West: 183
67% of Holden residents lived in the same house 5 years ago. Out of people who lived in different houses, 78% lived in this county. Out of people who lived in different counties, 35% lived in Massachusetts.
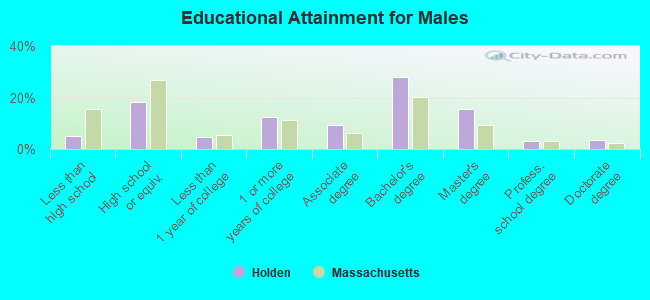
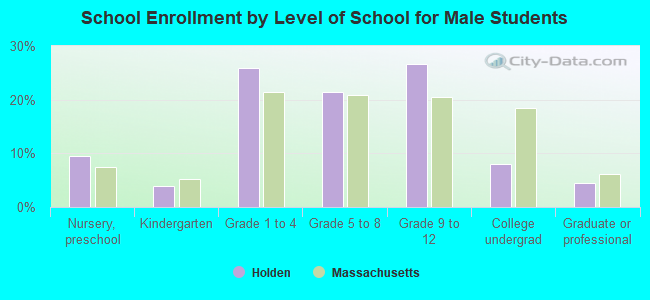
Education attainment for males 25 years and older:
No schooling: 9
Nursery to 4th grade: 0
5th and 6th grade: 0
7th and 8th grade: 40
9th grade: 44
10th grade: 77
11th grade: 30
12th grade, no diploma: 57
High school graduate (or equivalency): 911
Less than 1 year of college: 236
Some college more than 1 year, no degree: 621
Associate degree: 464
Bachelor's degree: 1,407
Master's degree: 776
Professional school degree: 165
Doctorate degree: 170
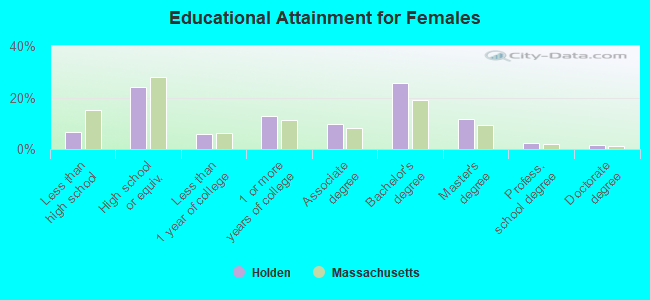
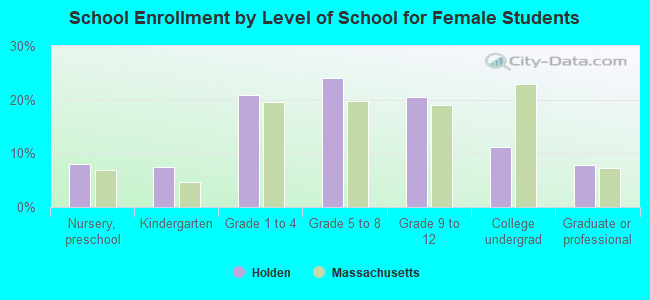
Education attainment for females 25 years and older:
No schooling: 19
Nursery to 4th grade: 8
5th and 6th grade: 6
7th and 8th grade: 106
9th grade: 23
10th grade: 87
11th grade: 33
12th grade, no diploma: 95
High school graduate (or equivalency): 1,336
Less than 1 year of college: 318
Some college more than 1 year, no degree: 723
Associate degree: 533
Bachelor's degree: 1,426
Master's degree: 652
Professional school degree: 132
Doctorate degree: 76
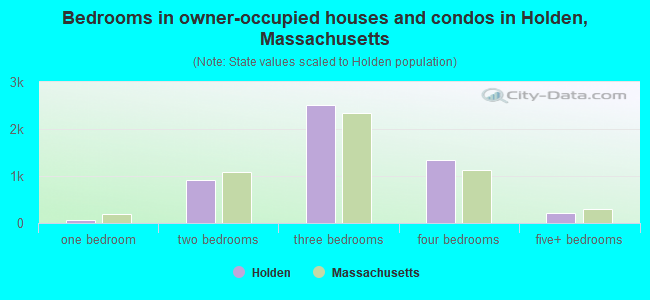
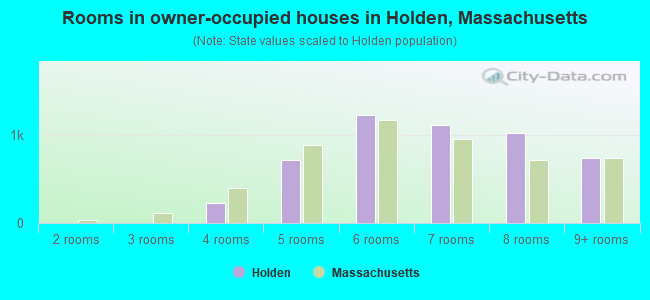
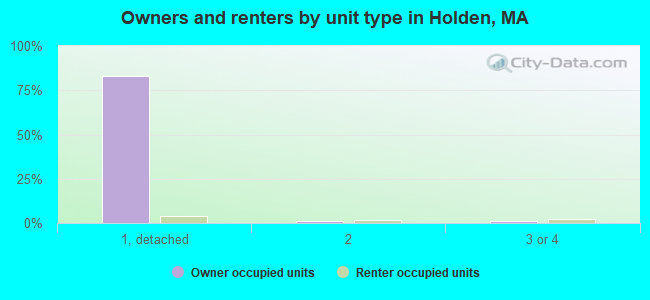
Housing units in structures:
One, detached: 5,044
One, attached: 141
Two: 192
3 or 4: 219
5 to 9: 82
10 to 19: 115
20 to 49: 25
50 or more: 6
Mobile homes: 3
Median worth of mobile homes: $50,659
Housing units lacking complete plumbing facilities: 0.1%