Key Biscayne, FL (Florida) Houses and Residents
Estimated median house or condo value in 2022: $1,560,078 (it was $390,400 in 2000 )
Key Biscayne:
$1,560,078Florida:
$354,100
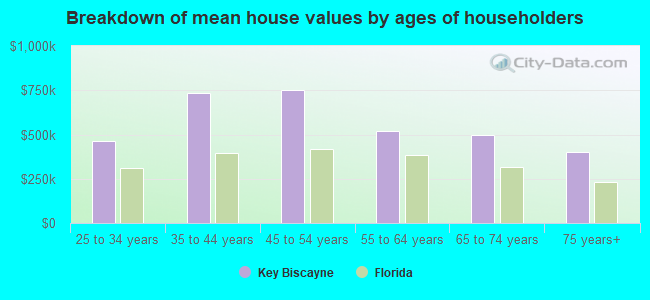
Lower value quartile - upper value quartile: $927,991 - $2,409,214Mean price in 2022: Detached houses: $3,755,635 Here:
$3,755,635State:
$500,941
Townhouses or other attached units: $1,908,168 Here:
$1,908,168State:
$370,869
In 5-or-more-unit structures: $1,838,708 Here:
$1,838,708State:
$447,145
Mobile homes: $43,113 Here:
$43,113State:
$113,202
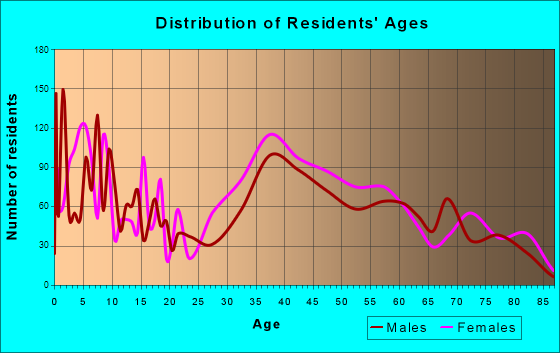
Total population: 12,924 (Urban population: 10,477 (all inside urban clusters), Rural population: 0)
Houses: 7,542 (4,745 occupied: 3,122 owner occupied, 1,685 renter occupied )
% of renters here:
35%State:
33%
Housing density: 5,904 houses/condos per square mile
Median price asked for vacant for-sale houses and condos in 2022: $2,979,174.
Median contract rent in 2022: over $2,000
Median rent asked for vacant for-rent units in 2022: $4,719
Median gross rent in Key Biscayne, FL in 2022: over $2,000
Housing units in Key Biscayne with a mortgage: 1,510 (169 second mortgage, 2 home equity loan, 172 both second mortgage and home equity loan )Houses without a mortgage: 52
Median household income for houses/condos with a mortgage: $258,243
Median household income for apartments without a mortgage: $176,755
Median monthly housing costs: $3,629
Data:
Median house or condo value ($)
Median house or condo value ($ change since 2000)
Median house or condo value ($) - White
Median house or condo value ($) - Black or African American
Median house or condo value ($) - Asian
Median house or condo value ($) - Hispanic or Latino
Median house or condo value ($) - American Indian and Alaska Native
Median house or condo value ($) - Multirace
Median house or condo value ($) - Other Race
Median price asked for mobile homes ($)
Household density (households per square mile)
Mean house or condo value by units in structure - 1, detached ($)
Mean house or condo value by units in structure - 1, attached ($)
Mean house or condo value by units in structure - 2 ($)
Mean house or condo value by units in structure by units in structure - 3 or 4 ($)
Mean house or condo value by units in structure - 5 or more ($)
Mean house or condo value by units in structure - Boat, RV, van, etc. ($)
Mean house or condo value by units in structure - Mobile home ($)
Median contract rent ($)
Median contract rent - Lower quartile ($)
Median contract rent - Upper quartile ($)
Median gross rent ($)
Urban houses (%)
Rural houses (%)
Houses occupied (%)
Houses occupied (% change since 2000)
Houses owner occupied (%)
Houses owner occupied (% change since 2000)
Houses renter occupied (%)
Houses renter occupied (% change since 2000)
Vacant housing units - For rent (%)
Vacant housing units - For rent (% change since 2000)
Vacant housing units - For sale only (%)
Vacant housing units - For sale only (% change since 2000)
Vacant housing units - Rented or sold, not occupied (%)
Vacant housing units - Rented or sold, not occupied (% change since 2000)
Vacant housing units - For seasonal, recreational, or occasional use (%)
Vacant housing units - For seasonal, recreational, or occasional use (% change since 2000)
Vacant housing units - For migrant workers (%)
Vacant housing units - For migrant workers (% change since 2000)
Vacant housing units - Other vacant (%)
Vacant housing units - Other vacant (% change since 2000)
Median monthly housing costs ($)
Median household income for houses/condos with a mortgage ($)
Median household income for houses/condos without a mortgage ($)
Median household income ($)
Median household income ($) - White
Median household income ($) - Black or African American
Median household income ($) - Asian
Median household income ($) - Hispanic or Latino
Median household income ($) - American Indian and Alaska Native
Median household income ($) - Multirace
Median household income ($) - Other Race
Mortgage status - with mortgage (%)
Mortgage status - with second mortgage (%)
Mortgage status - with home equity loan (%)
Mortgage status - with both second mortgage and home equity loan (%)
Mortgage status - without a mortgage (%)
Median year house/condo built
Median year apartment built
Household type by relationship - Male householder living alone (%)
Household type by relationship - Male householder not living alone (%)
Household type by relationship - Female householder living alone (%)
Household type by relationship - Female householder not living alone (%)
Household type by relationship - Opposite-Sex spouse (%)
Household type by relationship - Same-Sex spouse (%)
Household type by relationship - Opposite-Sex unmarried partner (%)
Household type by relationship - Same-Sex unmarried partner (%)
Household type by relationship - In group quarters (%)
Size of family households - 2-person household (%)
Size of family households - 3-person household (%)
Size of family households - 4-person household (%)
Size of family households - 5-person household (%)
Size of family households - 6-person household (%)
Size of family households - 7-or-more-person household (%)
Size of nonfamily households - 1-person household (%)
Size of nonfamily households - 2-person household (%)
Size of nonfamily households - 3-person household (%)
Size of nonfamily households - 4-person household (%)
Size of nonfamily households - 5-person household (%)
Size of nonfamily households - 6-person household (%)
Size of nonfamily households - 7-or-moreperson household (%)
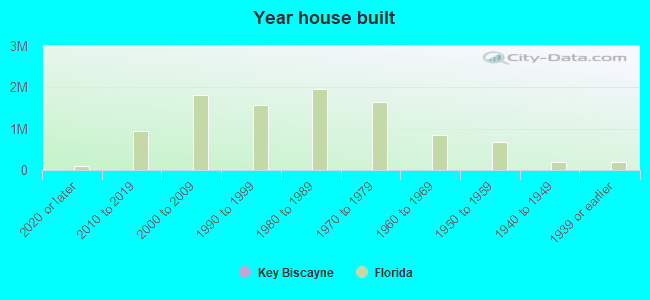
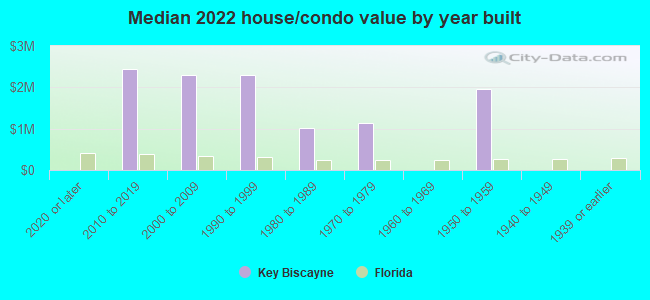
Year house built - Built 2010 or later (%)
Year house built - Built 2000 to 2009 (%)
Year house built - Built 1990 to 1999 (%)
Year house built - Built 1980 to 1989 (%)
Year house built - Built 1970 to 1979 (%)
Year house built - Built 1960 to 1969 (%)
Year house built - Built 1950 to 1959 (%)
Year house built - Built 1940 to 1949 (%)
Year house built - Built 1939 or earlier (%)
Median number of rooms in houses and condos
Median number of rooms in apartments
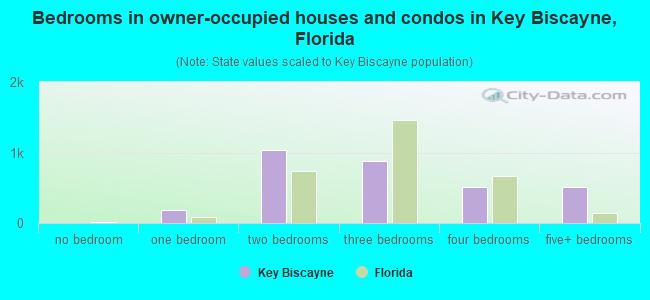
Median number of bedrooms in owner occupied houses
Mean number of bedrooms in owner occupied houses
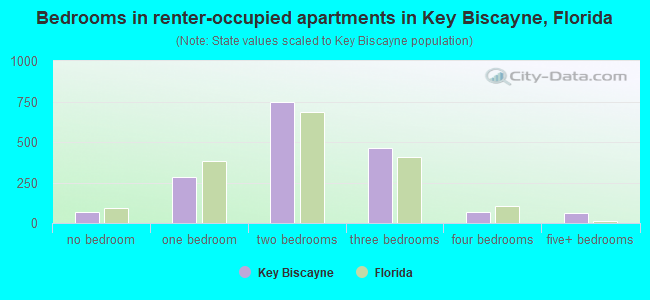
Median number of bedrooms in renter occupied houses
Mean number of bedrooms in renter occupied houses
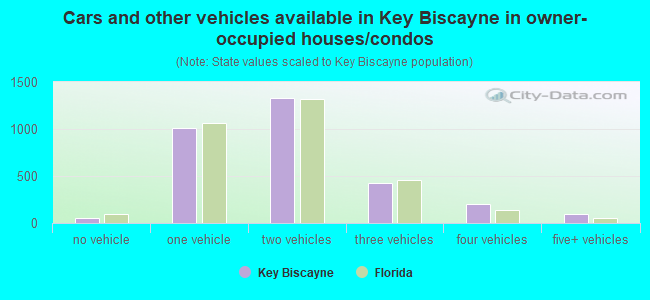
Median number of vehichles in owner occupied houses
Mean number of vehichles in owner occupied houses
Median number of vehichles in renter occupied houses
Mean number of vehichles in renter occupied houses
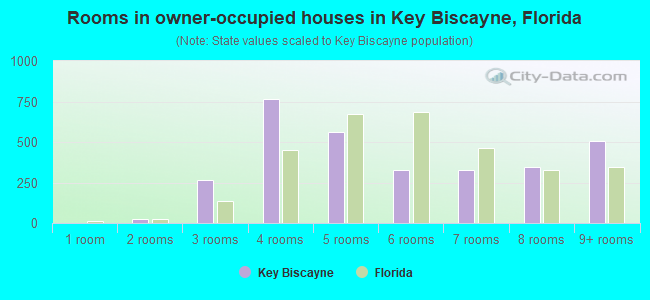
Rooms in owner-occupied houses - 1 room (%)
Rooms in owner-occupied houses - 2 rooms (%)
Rooms in owner-occupied houses - 3 rooms (%)
Rooms in owner-occupied houses - 4 rooms (%)
Rooms in owner-occupied houses - 5 rooms (%)
Rooms in owner-occupied houses - 6 rooms (%)
Rooms in owner-occupied houses - 7 rooms (%)
Rooms in owner-occupied houses - 8 rooms (%)
Rooms in owner-occupied houses - 9+ rooms (%)
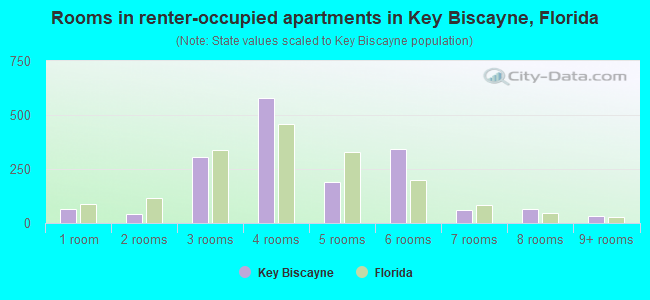
Rooms in renter-occupied houses - 1 room (%)
Rooms in renter-occupied houses - 2 rooms (%)
Rooms in renter-occupied houses - 3 rooms (%)
Rooms in renter-occupied houses - 4 rooms (%)
Rooms in renter-occupied houses - 5 rooms (%)
Rooms in renter-occupied houses - 6 rooms (%)
Rooms in renter-occupied houses - 7 rooms (%)
Rooms in renter-occupied houses - 8 rooms (%)
Rooms in renter-occupied houses - 9+ rooms (%)
Bedrooms in owner-occupied houses - no bedrooms (%)
Bedrooms in owner-occupied houses - 1 bedroom (%)
Bedrooms in owner-occupied houses - 2 bedrooms (%)
Bedrooms in owner-occupied houses - 3 bedrooms (%)
Bedrooms in owner-occupied houses - 4 bedrooms (%)
Bedrooms in owner-occupied houses - 5+ bedrooms (%)
Bedrooms in renter-occupied houses - no bedrooms (%)
Bedrooms in renter-occupied houses - 1 bedroom (%)
Bedrooms in renter-occupied houses - 2 bedrooms (%)
Bedrooms in renter-occupied houses - 3 bedrooms (%)
Bedrooms in renter-occupied houses - 4 bedrooms (%)
Bedrooms in renter-occupied houses - 5+ bedrooms (%)
Vehicles available in owner-occupied houses - no vehicle available (%)
Vehicles available in owner-occupied houses - 1 vehicle available(%)
Vehicles available in owner-occupied houses - 2 Vehicles available (%)
Vehicles available in owner-occupied houses - 3 Vehicles available (%)
Vehicles available in owner-occupied houses - 4 Vehicles available (%)
Vehicles available in owner-occupied houses - 5+ Vehicles available (%)
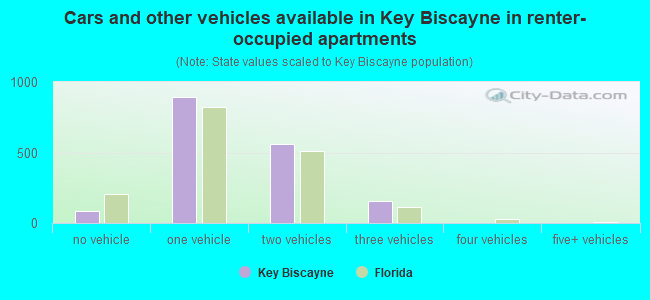
Vehicles available in renter-occupied houses - no vehicle available (%)
Vehicles available in renter-occupied houses - 1 vehicle available (%)
Vehicles available in renter-occupied houses - 2 Vehicles available (%)
Vehicles available in renter-occupied houses - 3 Vehicles available (%)
Vehicles available in renter-occupied houses - 4 Vehicles available (%)
Vehicles available in renter-occupied houses - 5+ Vehicles available (%)
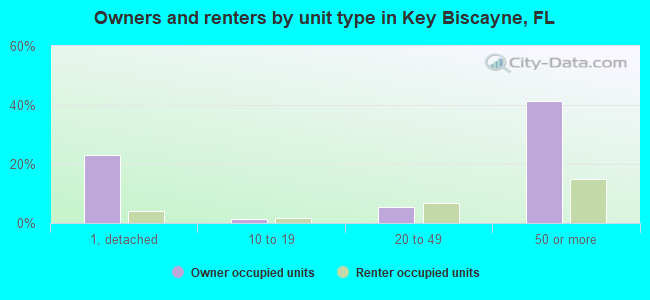
Housing units in structures - 1, detached (%)
Housing units in structures - 1, attached (%)
Housing units in structures - 2 (%)
Housing units in structures - 3 or 4 (%)
Housing units in structures - 5 to 9 (%)
Housing units in structures - 10 to 19 (%)
Housing units in structures - 20 to 49 (%)
Housing units in structures - 50 or more (%)
Housing units in structures - Mobile home (%)
Housing units in structures - Boat, RV, van, etc. (%)
Housing units in structures - Owners - 1, detached (%)
Housing units in structures - Owners - 1, attached (%)
Housing units in structures - Owners - 2 (%)
Housing units in structures - Owners - 3 or 4 (%)
Housing units in structures - Owners - 5 to 9 (%)
Housing units in structures - Owners - 10 to 19 (%)
Housing units in structures - Owners - 20 to 49 (%)
Housing units in structures - Owners - 50 or more (%)
Housing units in structures - Owners - Mobile home (%)
Housing units in structures - Owners - Boat, RV, van, etc. (%)
Housing units in structures - Renters - 1, detached (%)
Housing units in structures - Renters - 1, attached (%)
Housing units in structures - Renters - 2 (%)
Housing units in structures - Renters - 3 or 4 (%)
Housing units in structures - Renters - 5 to 9 (%)
Housing units in structures - Renters - 10 to 19 (%)
Housing units in structures - Renters - 20 to 49 (%)
Housing units in structures - Renters - 50 or more (%)
Housing units in structures - Renters - Mobile home (%)
Housing units in structures - Renters - Boat, RV, van, etc. (%)
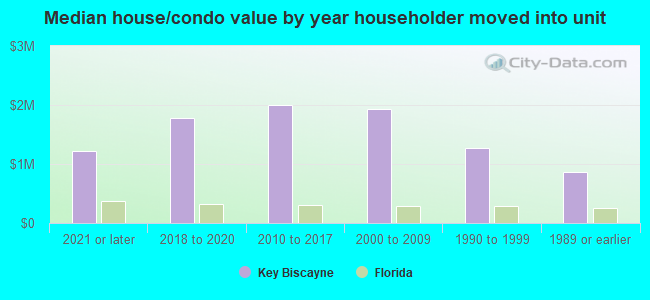
House/condo owner moved in on average (years ago)
Renter moved in on average (years ago)
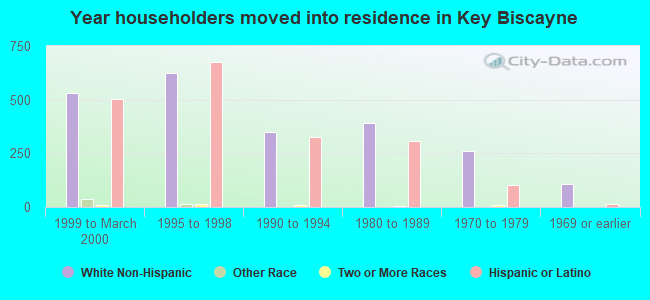
Year householder moved into unit - Moved in 1999 to March 2000 (%)
Year householder moved into unit - Moved in 1999 to March 2000 (%) - White
Year householder moved into unit - Moved in 1999 to March 2000 (%) - Black or African American
Year householder moved into unit - Moved in 1999 to March 2000 (%) - Asian
Year householder moved into unit - Moved in 1999 to March 2000 (%) - Hispanic or Latino
Year householder moved into unit - Moved in 1999 to March 2000 (%) - American Indian and Alaska Native
Year householder moved into unit - Moved in 1999 to March 2000 (%) - Multirace
Year householder moved into unit - Moved in 1999 to March 2000 (%) - Other Race
Year householder moved into unit - Moved in 1995 to 1998 (%)
Year householder moved into unit - Moved in 1995 to 1998 (%) - White
Year householder moved into unit - Moved in 1995 to 1998 (%) - Black or African American
Year householder moved into unit - Moved in 1995 to 1998 (%) - Asian
Year householder moved into unit - Moved in 1995 to 1998 (%) - Hispanic or Latino
Year householder moved into unit - Moved in 1995 to 1998 (%) - American Indian and Alaska Native
Year householder moved into unit - Moved in 1995 to 1998 (%) - Multirace
Year householder moved into unit - Moved in 1995 to 1998 (%) - Other Race
Year householder moved into unit - Moved in 1990 to 1994 (%)
Year householder moved into unit - Moved in 1990 to 1994 (%) - White
Year householder moved into unit - Moved in 1990 to 1994 (%) - Black or African American
Year householder moved into unit - Moved in 1990 to 1994 (%) - Asian
Year householder moved into unit - Moved in 1990 to 1994 (%) - Hispanic or Latino
Year householder moved into unit - Moved in 1990 to 1994 (%) - American Indian and Alaska Native
Year householder moved into unit - Moved in 1990 to 1994 (%) - Multirace
Year householder moved into unit - Moved in 1990 to 1994 (%) - Other Race
Year householder moved into unit - Moved in 1980 to 1989 (%)
Year householder moved into unit - Moved in 1980 to 1989 (%) - White
Year householder moved into unit - Moved in 1980 to 1989 (%) - Black or African American
Year householder moved into unit - Moved in 1980 to 1989 (%) - Asian
Year householder moved into unit - Moved in 1980 to 1989 (%) - Hispanic or Latino
Year householder moved into unit - Moved in 1980 to 1989 (%) - American Indian and Alaska Native
Year householder moved into unit - Moved in 1980 to 1989 (%) - Multirace
Year householder moved into unit - Moved in 1980 to 1989 (%) - Other Race
Year householder moved into unit - Moved in 1970 to 1979 (%)
Year householder moved into unit - Moved in 1970 to 1979 (%) - White
Year householder moved into unit - Moved in 1970 to 1979 (%) - Black or African American
Year householder moved into unit - Moved in 1970 to 1979 (%) - Asian
Year householder moved into unit - Moved in 1970 to 1979 (%) - Hispanic or Latino
Year householder moved into unit - Moved in 1970 to 1979 (%) - American Indian and Alaska Native
Year householder moved into unit - Moved in 1970 to 1979 (%) - Multirace
Year householder moved into unit - Moved in 1970 to 1979 (%) - Other Race
Year householder moved into unit - Moved in 1969 or earlier (%)
Year householder moved into unit - Moved in 1969 or earlier (%) - White
Year householder moved into unit - Moved in 1969 or earlier (%) - Black or African American
Year householder moved into unit - Moved in 1969 or earlier (%) - Asian
Year householder moved into unit - Moved in 1969 or earlier (%) - Hispanic or Latino
Year householder moved into unit - Moved in 1969 or earlier (%) - American Indian and Alaska Native
Year householder moved into unit - Moved in 1969 or earlier (%) - Multirace
Year householder moved into unit - Moved in 1969 or earlier (%) - Other Race
Housing units lacking complete plumbing facilities (%)
Housing units lacking complete kitchen facilities (%)
House heating fuel used in houses and condos - Utility gas (%)
House heating fuel used in houses and condos - Bottled, tank, or LP gas (%)
House heating fuel used in houses and condos - Electricity (%)
House heating fuel used in houses and condos - Fuel oil, kerosene, etc. (%)
House heating fuel used in houses and condos - Coal or coke (%)
House heating fuel used in houses and condos - Wood (%)
House heating fuel used in houses and condos - Solar energy (%)
House heating fuel used in houses and condos - Other fuel (%)
House heating fuel used in houses and condos - No fuel used (%)
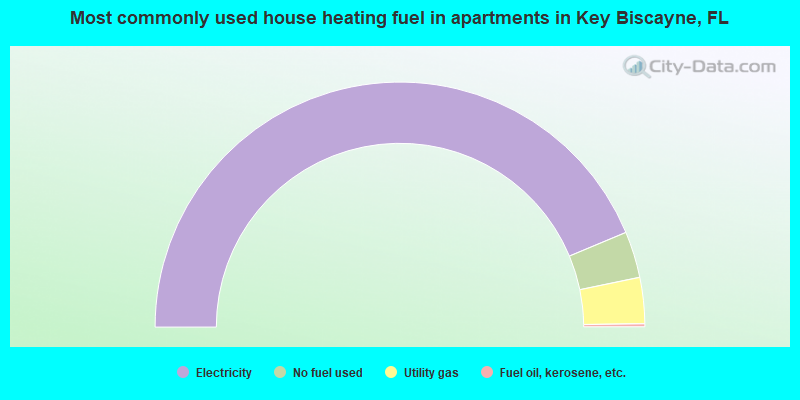
House heating fuel used in apartments - Utility gas (%)
House heating fuel used in apartments - Bottled, tank, or LP gas (%)
House heating fuel used in apartments - Electricity (%)
House heating fuel used in apartments - Fuel oil, kerosene, etc. (%)
House heating fuel used in apartments - Coal or coke (%)
House heating fuel used in apartments - Wood (%)
House heating fuel used in apartments - Solar energy (%)
House heating fuel used in apartments - Other fuel (%)
House heating fuel used in apartments - No fuel used (%)
Median year house/condo built: 1979Median year apartment built: 1978Household type by relationship:
Households: 14,493
Male householders: 2,455 (243 living alone ), Female householders: 2,177 (615 living alone )3,105 spouses (3,074 opposite-sex spouses ), 173 unmarried partners , (166 opposite-sex unmarried partners ), 5,876 children (5,776 natural , 5 adopted , 93 stepchildren ), 140 grandchildren , 8 brothers or sisters , 57 parents , 0 foster children , 43 other relatives , 455 non-relatives
Size of family households: 1,109 2-persons , 846 3-persons , 892 4-persons , 601 5-persons , 155 6-persons , 99 7-or-more-persons .
Size of nonfamily households: 920 1-person , 132 2-persons .
3,758 married couples with children. single-parent households (83 men , 497 women ).
17.2% of residents of Key Biscayne speak English at home. of residents speak Spanish at home (80% speak English very well , 12% speak English well , 4% speak English not well , 4% don't speak English at all ).of residents speak other Indo-European language at home (82% speak English very well , 10% speak English well , 6% speak English not well , 2% don't speak English at all ).of residents speak Asian or Pacific Island language at home (100% speak English very well ).of residents speak other language at home (100% speak English very well ).
Foreign born population: 8,327 (57.5%)of them are naturalized citizens )
Median number of rooms in houses and condos:
Median number of rooms in apartments
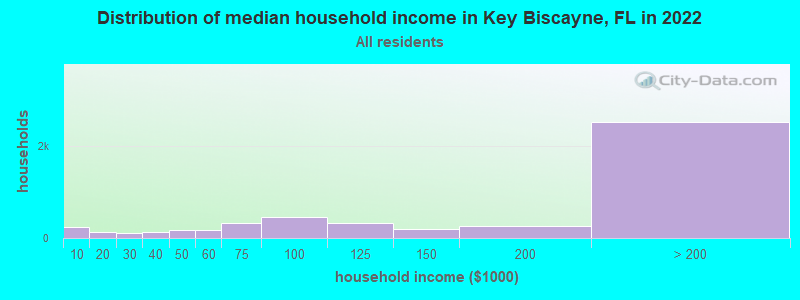
Key Biscayne, FL household income distribution 246 Less than $10,000134 $10,000 to $19,999110 $20,000 to $29,999126 $30,000 to $39,999166 $40,000 to $49,999176 $50,000 to $59,999336 $60,000 to $74,999469 $75,000 to $99,999333 $100,000 to $124,999188 $125,000 to $149,999260 $150,000 to $199,9992,534 $200,000 or more
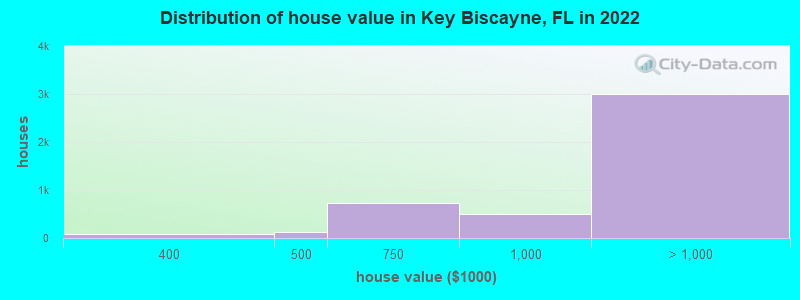
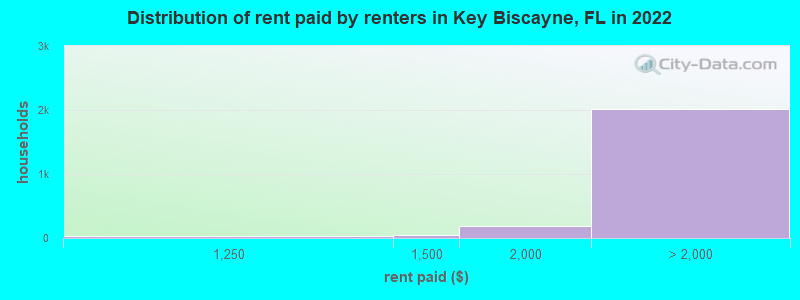
Home value of owner - occupied houses in 2022 in Key Biscayne, FL 27 Less than $10,00013 $200,000 to $249,99975 $300,000 to $399,999124 $400,000 to $499,999724 $500,000 to $749,999504 $750,000 to $999,999757 $1,000,000 to $1,499,999265 $1,500,000 to $1,999,9991,971 $2,000,000 or moreRent paid by renters in 2022 in Key Biscayne, FL 4 $550 to $59917 $800 to $89935 $1,000 to $1,24940 $1,250 to $1,499194 $1,500 to $1,999241 $2,000 to $2,499242 $2,500 to $2,999132 $3,000 to $3,4991,313 $3,500 or more85 No cash rent
Percentage of workers working in this county: 97.6%Number of people working at home: 2,239 (37.5% of all workers )
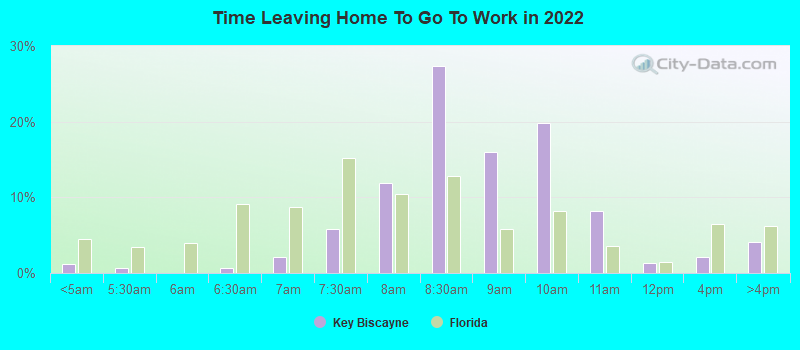
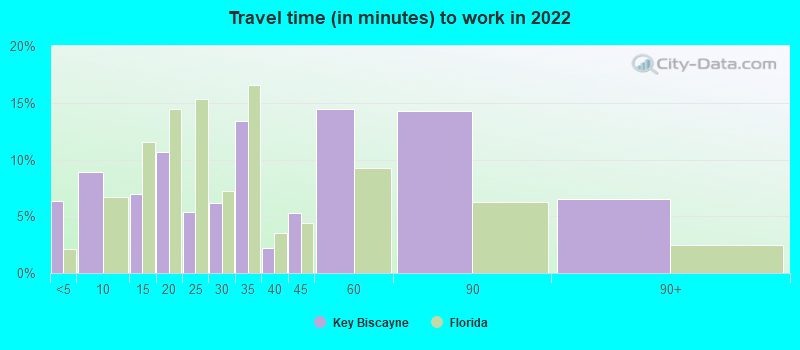
Travel time to work (commute)
Less than 5 minutes: 1715 to 9 minutes: 54910 to 14 minutes: 15415 to 19 minutes: 71120 to 24 minutes: 97825 to 29 minutes: 25030 to 34 minutes: 58435 to 39 minutes: 14840 to 44 minutes: 19645 to 59 minutes: 47560 to 89 minutes: 7390 or more minutes: 39
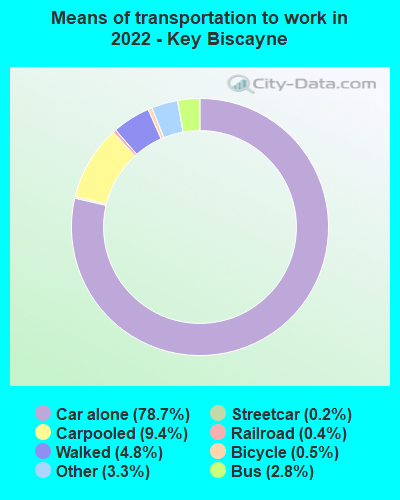
Means of transportation to work:
Drove a car alone: 3,352 (54.7%)Carpooled: 448 (7.3%)Bus : 110 (1.8%)Subway or elevated rail : 16 (0.3%)Light rail, streetcar or trolley : 25 (0.4%)Taxi: 176 (2.9%)Bicycle: 28 (0.5%)Walked: 233 (3.8%)Worked at home: 2,239 (36.5%)
Unemployment by race in 2022
Unemployment rate for White non-Hispanic residents 5.5% Males2.9% FemalesUnemployment rate for other race residents 29.4% FemalesUnemployment rate for two or more race residents 2.1% Males0.2% FemalesUnemployment rate for Hispanic or Latino residents 1.3% Males3.5% Females
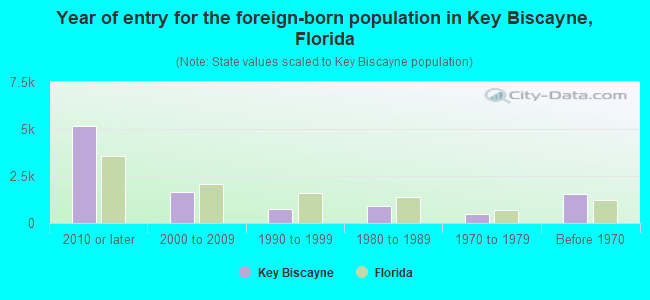
Year of entry for the foreign-born population in Key Biscayne, Florida
5,145 2010 or later 1,643 2000 to 2009 725 1990 to 1999 926 1980 to 1989 499 1970 to 1979 1,530 Before 1970
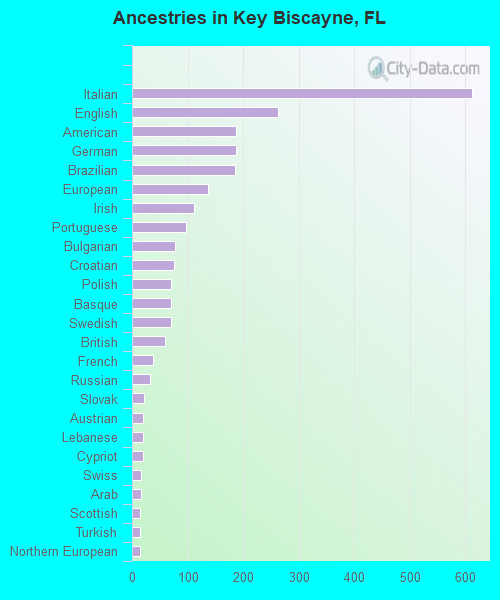
First ancestries reported:
Italian: 612 (6.3%)
English: 263 (2.7%)
American: 188 (1.9%)
German: 187 (1.9%)
Brazilian: 185 (1.9%)
European: 136 (1.4%)
Irish: 111 (1.1%)
Portuguese: 97 (1.0%)
Bulgarian: 77 (0.8%)
Croatian: 75 (0.8%)
Polish: 71 (0.7%)
Basque: 70 (0.7%)
Swedish: 70 (0.7%)
British: 59 (0.6%)
French: 38 (0.4%)
Russian: 33 (0.3%)
Slovak: 21 (0.2%)
Austrian: 20 (0.2%)
Lebanese: 19 (0.2%)
Cypriot: 19 (0.2%)
Swiss: 17 (0.2%)
Arab: 16 (0.2%)
Scottish: 15 (0.2%)
Turkish: 15 (0.2%)
Northern European: 14 (0.1%)
Ukrainian: 11 (0.1%)
Jamaican: 11 (0.1%)
Greek: 10 (0.1%)
Armenian: 8 (0.08%)
Canadian: 8 (0.08%)
French Canadian: 8 (0.08%)
Lithuanian: 7 (0.07%)
Hungarian: 6 (0.06%)
Eastern European: 5 (0.05%)
Scotch-Irish: 4 (0.04%) Most common places of birth for foreign-born residents (%): Argentina Key Biscayne:
20.0% (1,663)Florida:
1.3% (57,263)
Colombia Key Biscayne:
13.5% (1,126)Florida:
6.5% (298,669)
Mexico Key Biscayne:
11.7% (972)Florida:
5.6% (257,152)
Venezuela Key Biscayne:
10.4% (866)Florida:
5.7% (262,042)
Cuba Key Biscayne:
9.2% (763)Florida:
22.0% (1,006,576)
Spain Key Biscayne:
8.5% (707)Florida:
0.5% (21,571)
Brazil Key Biscayne:
6.5% (544)Florida:
2.7% (122,906)
Peru Key Biscayne:
3.8% (319)Florida:
2.1% (96,693)
Chile Key Biscayne:
3.1% (255)Florida:
0.5% (22,715)
Ecuador Key Biscayne:
2.3% (189)Florida:
1.2% (54,585)
Italy Key Biscayne:
2.2% (187)Florida:
0.7% (30,755)
Guatemala Key Biscayne:
2.2% (184)Florida:
2.1% (97,632)
Nicaragua Key Biscayne:
1.8% (152)Florida:
2.3% (105,066)
Place of birth for U.S.-born residents:
This state: 3,425Other state: 2,119Northeast: 1,242Midwest: 259South: 462West: 148 82.8% of Key Biscayne residents lived in the same house 1 years ago.
Out of people who lived in different houses, 41.0% lived in this county.
Out of people who lived in different counties, 10.3% lived in Florida.
Key Biscayne:
82.8%State average:
86.3%
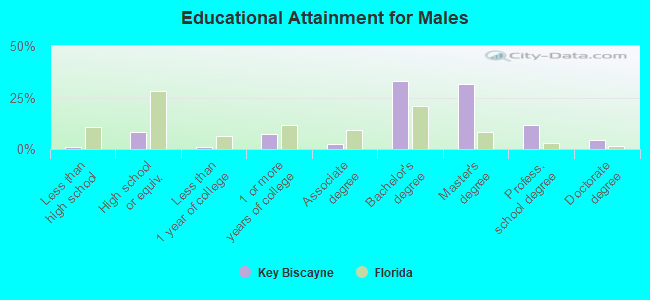
Education attainment for males 25 years and older:
No schooling: 7Nursery to 4th grade: 75th and 6th grade: 137th and 8th grade: 09th grade: 010th grade: 011th grade: 012th grade, no diploma: 24High school graduate (or equivalency): 347Less than 1 year of college: 48Some college more than 1 year, no degree: 310Associate degree: 98Bachelor's degree: 1,415Master's degree: 1,359Professional school degree: 506Doctorate degree: 178
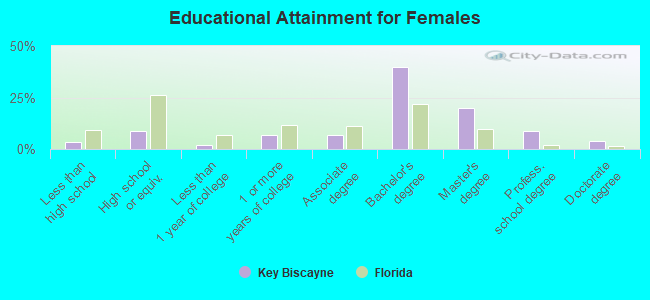
Education attainment for females 25 years and older:
No schooling: 10Nursery to 4th grade: 215th and 6th grade: 807th and 8th grade: 309th grade: 1610th grade: 011th grade: 012th grade, no diploma: 14High school graduate (or equivalency): 458Less than 1 year of college: 107Some college more than 1 year, no degree: 348Associate degree: 337Bachelor's degree: 2,026Master's degree: 1,018Professional school degree: 441Doctorate degree: 208
Housing units in structures:
One, detached: 1,351One, attached: 179Two: 233 or 4: 25 to 9: 6210 to 19: 18720 to 49: 95450 or more: 4,763Mobile homes: 17Housing units lacking complete plumbing facilities in 2022: 0.3%Housing units lacking complete kitchen facilities in 2022: 0.9%House/condo owner moved in on average 11 years ago
Renter moved in on average 1 years ago
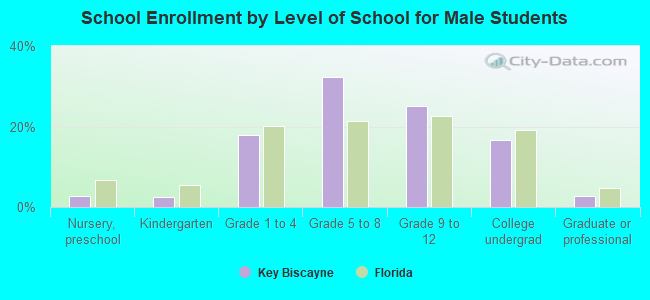
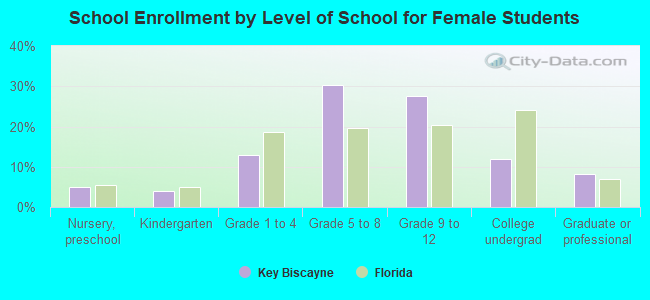
Private vs. public school enrollment:
Students in private schools in grades 1 to 8 (elementary and middle school): 663 Students in private schools in grades 9 to 12 (high school): 476 Students in private undergraduate colleges: 462