Los Angeles, CA (California) Houses and Residents
| Los Angeles: | $903,700 |
| California: | $715,900 |
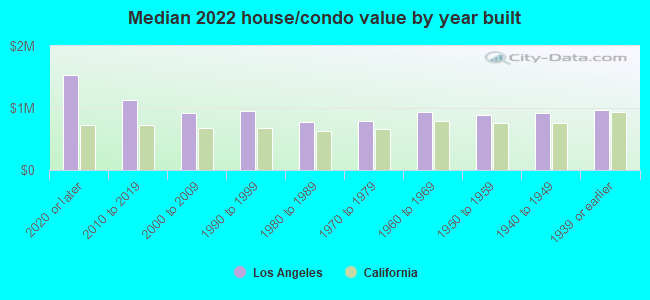
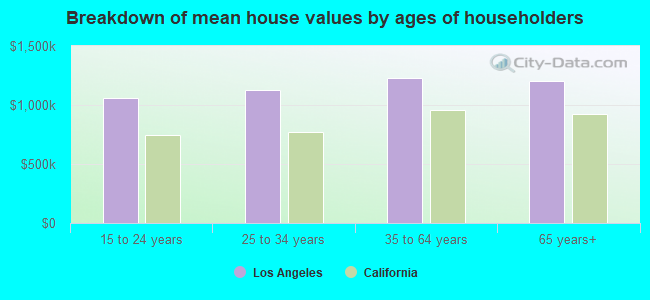
Mean price in 2022:
Detached houses: $1,324,769
Here: $1,324,769 State: $988,808 Townhouses or other attached units: $832,477
Here: $832,477 State: $838,546 In 2-unit structures: $1,127,961
Here: $1,127,961 State: $1,138,100 In 3-to-4-unit structures: $930,211
Here: $930,211 State: $824,253 In 5-or-more-unit structures: $784,826
Here: $784,826 State: $730,996 Mobile homes: $255,082
Here: $255,082 State: $184,506 Occupied boats, RVs, vans, etc.: $63,014
Here: $63,014 State: $204,957
Total population: 3,928,864 (Urban population: 3,689,118, Rural population: 5,716 (all nonfarm))
Houses: 1,549,889 (1,439,805 occupied: 515,117 owner occupied, 924,688 renter occupied)
| % of renters here: | 64% |
| State: | 44% |
Housing density: 3,304 houses/condos per square mile
Median price asked for vacant for-sale houses and condos in 2022: $1,201,223.
Median contract rent in 2022: $1,648 (lower quartile is $1,142, upper quartile is over $2,000)
Median rent asked for vacant for-rent units in 2022: $2,288
Median gross rent in Los Angeles, CA in 2022: $1,788
Housing units in Los Angeles with a mortgage: 354,861 (36,869 second mortgage, 1,753 home equity loan, 30,065 both second mortgage and home equity loan)
Houses without a mortgage: 5,035
Median household income for houses/condos with a mortgage: $137,817
Median household income for apartments without a mortgage: $90,452
Median monthly housing costs: $1,928
Compare current foreclosures in Los Angeles, CA:
| Photo | Address | Area | Beds / Baths | Price | Details |
|---|---|---|---|---|---|

|
#1
Aberdeen Ave
Los Angeles, CA 90027
|
6,957 sq. feet
|
4 baths 6 beds |
$5,040,000
|
show details |

|
#2
1238 S Redondo Blvd
Los Angeles, CA 90019
|
- sq. feet
|
2 baths 4 beds |
$849,900
|
show details |

|
#3
Wilshire Blvd Apt 703
Los Angeles, CA 90024
|
2,245 sq. feet
|
2 baths 2 beds |
$1,750,000
|
show details |

|
#4
N Commonwealth Ave
Los Angeles, CA 90004
|
3,937 sq. feet
|
6 baths 6 beds |
show details | |

|
#5
N Beachwood Dr
Los Angeles, CA 90068
|
1,848 sq. feet
|
2 baths 2 beds |
show details | |

|
#6
E 60th St
Los Angeles, CA 90001
|
1,883 sq. feet
|
3 baths 5 beds |
show details | |

|
#7
Bohlig Rd Apt 45
Los Angeles, CA 90032
|
813 sq. feet
|
2 baths 2 beds |
show details | |

|
#8
And 6111 Northside Drive
Los Angeles, CA 90022
|
1,329 sq. feet
|
4 baths 3 beds |
show details | |

|
#9
S Norton Ave
Los Angeles, CA 90019
|
4,200 sq. feet
|
2 baths 5 beds |
show details | |

|
#10
N Ardmore Ave
Los Angeles, CA 90029
|
3,654 sq. feet
|
4 baths 4 beds |
show details |
| Photo | Address | Area | Beds / Baths | Price | Details |
|---|---|---|---|---|---|

|
#11
Hazelwood Ave
Los Angeles, CA 90041
|
4,755 sq. feet
|
8 baths 8 beds |
show details | |

|
#12
Chalon Rd
Los Angeles, CA 90077
|
3,066 sq. feet
|
6 baths 3 beds |
show details | |

|
#13
4th Ave
Los Angeles, CA 90008
|
1,265 sq. feet
|
1 baths 2 beds |
show details | |

|
#14
Haddington Dr
Los Angeles, CA 90064
|
1,580 sq. feet
|
2 baths 3 beds |
show details | |

|
#15
Playa Vista Dr Apt 15
Los Angeles, CA 90094
|
1,920 sq. feet
|
3 baths 1 beds |
show details | |

|
#16
Tacoma Ave
Los Angeles, CA 90065
|
2,047 sq. feet
|
2 baths 3 beds |
show details | |

|
#17
S Lake St
Los Angeles, CA 90057
|
- sq. feet
|
4 baths 9 beds |
show details | |

|
#18
S Cochran Ave
Los Angeles, CA 90036
|
3,288 sq. feet
|
4 baths 4 beds |
show details | |

|
#19
W 82nd St
Los Angeles, CA 90047
|
1,384 sq. feet
|
2 baths 3 beds |
show details | |

|
#20
Lavell Dr
Los Angeles, CA 90065
|
2,076 sq. feet
|
4 baths 4 beds |
show details |
| Photo | Address | Area | Beds / Baths | Price | Details |
|---|---|---|---|---|---|

|
#21
Deep Dell Pl
Los Angeles, CA 90068
|
2,862 sq. feet
|
3 baths 3 beds |
show details | |

|
#22
W 105th St
Los Angeles, CA 90044
|
792 sq. feet
|
1 baths 2 beds |
show details | |

|
#23
Playa Vista Dr Apt 15
Los Angeles, CA 90094
|
1,920 sq. feet
|
3 baths 1 beds |
show details | |

|
#24
Deep Dell Pl
Los Angeles, CA 90068
|
2,862 sq. feet
|
3 baths 3 beds |
show details | |

|
#25
Olmsted Ave
Los Angeles, CA 90008
|
1,550 sq. feet
|
2 baths 3 beds |
show details | |

|
#26
Nobel St
Los Angeles, CA 90040
|
1,026 sq. feet
|
2 baths 3 beds |
show details | |

|
#27
E 113th St
Los Angeles, CA 90059
|
1,085 sq. feet
|
1 baths 3 beds |
show details | |

|
#28
Lavell Dr
Los Angeles, CA 90065
|
- sq. feet
|
4 baths 4 beds |
show details | |

|
#29
West 41st Drive
Los Angeles, CA 90037
|
- sq. feet
|
4 baths 6 beds |
show details | |

|
#30
Denker Ave
Los Angeles, CA 90062
|
1,196 sq. feet
|
1 baths 2 beds |
show details |
| Photo | Address | Area | Beds / Baths | Price | Details |
|---|---|---|---|---|---|

|
#31
E 33rd St
Los Angeles, CA 90011
|
887 sq. feet
|
2 baths 4 beds |
show details | |

|
#32
S Broadway
Los Angeles, CA 90061
|
1,620 sq. feet
|
3 baths 4 beds |
show details | |

|
#33
W 58th Pl
Los Angeles, CA 90043
|
2,417 sq. feet
|
3 baths 4 beds |
show details | |

|
#34
S New England St
Los Angeles, CA 90006
|
1,509 sq. feet
|
4 baths 5 beds |
show details | |

|
#35
And 4308 1/2s Dalton Ave
Los Angeles, CA 90062
|
1,772 sq. feet
|
2 baths 4 beds |
show details | |

|
#36
1123 1 2, 1125 & 1125 1 2 West 18th Street
Los Angeles, CA 90015
|
3,680 sq. feet
|
4 baths 5 beds |
show details | |

|
#37
Maie Ave
Los Angeles, CA 90001
|
860 sq. feet
|
1 baths 2 beds |
show details | |

|
#38
W 70th St
Los Angeles, CA 90044
|
1,102 sq. feet
|
1 baths 2 beds |
show details | |

|
#39
S Budlong Ave
Los Angeles, CA 90044
|
1,201 sq. feet
|
2 baths 4 beds |
show details | |

|
#40
W 60th St
Los Angeles, CA 90043
|
1,638 sq. feet
|
2 baths 4 beds |
show details |
| Photo | Address | Area | Beds / Baths | Price | Details |
|---|---|---|---|---|---|

|
#41
Denrock Ave
Los Angeles, CA 90045
|
3,720 sq. feet
|
5 baths 4 beds |
show details | |

|
#42
W 29th Pl
Los Angeles, CA 90018
|
1,292 sq. feet
|
2 baths 2 beds |
show details | |

|
#43
Lotus St
Los Angeles, CA 90065
|
1,848 sq. feet
|
3 baths 3 beds |
show details | |

|
#44
Lemoyne St
Los Angeles, CA 90026
|
2,210 sq. feet
|
3 baths 3 beds |
show details | |

|
#45
5th Ave
Los Angeles, CA 90043
|
1,315 sq. feet
|
2 baths 3 beds |
show details | |

|
#46
Emmet Ter
Los Angeles, CA 90068
|
1,377 sq. feet
|
1 baths 2 beds |
show details | |

|
#47
W Sunset Blvd
Los Angeles, CA 90049
|
3,627 sq. feet
|
5 baths 4 beds |
show details | |

|
#48
Cook St
Los Angeles, CA 90061
|
1,204 sq. feet
|
2 baths 4 beds |
show details | |

|
#49
W 24th St
Los Angeles, CA 90018
|
1,271 sq. feet
|
2 baths 4 beds |
show details | |

|
Check over 1 million property listings on Foreclosure.com!
|
browse all offers | |||


 | House for median home price in Los Angeles (8 replies) |
| Los Angeles built 20% of all new homes in California in 2018 (13 replies) |
| Apartment hunting in Los Angeles (20 replies) |
| Homes in San Fernando Valley sell a more affordable version of Los Angeles chic (11 replies) |
| An honest opinion of los angeles (69 replies) |
| Baltimore Hotel Apartments (501 S Los Angeles St) - Advice (3 replies) |
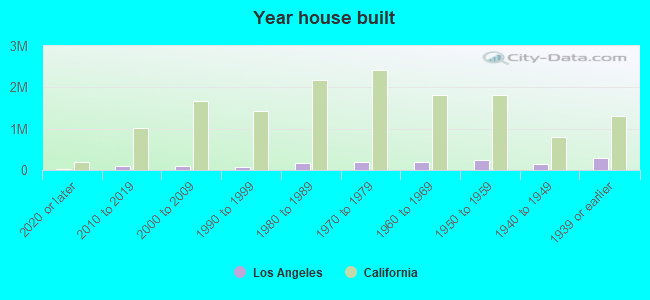
Median year apartment built: 1970
Household type by relationship:
Households: 3,822,224- Male householders: 741,531 (226,951 living alone), Female householders: 698,274 (235,413 living alone)
527,097 spouses (514,209 opposite-sex spouses), 126,664 unmarried partners, (117,080 opposite-sex unmarried partners), 995,673 children (956,497 natural, 14,155 adopted, 25,021 stepchildren), 97,164 grandchildren, 84,052 brothers or sisters, 114,820 parents, 1,984 foster children, 120,314 other relatives, 213,734 non-relatives
- In group quarters: 100,917
Size of family households: 302,613 2-persons, 198,137 3-persons, 165,381 4-persons, 89,338 5-persons, 36,028 6-persons, 32,816 7-or-more-persons.
Size of nonfamily households: 462,364 1-person, 120,999 2-persons, 20,805 3-persons, 7,079 4-persons, 1,817 5-persons, 1,247 6-persons, 1,181 7-or-more-persons.
381,631 married couples with children.
209,451 single-parent households (54,843 men, 154,608 women).
44.0% of residents of Los Angeles speak English at home.
39.4% of residents speak Spanish at home (53% speak English very well, 19% speak English well, 19% speak English not well, 9% don't speak English at all).
7.0% of residents speak other Indo-European language at home (64% speak English very well, 21% speak English well, 11% speak English not well, 4% don't speak English at all).
8.2% of residents speak Asian or Pacific Island language at home (52% speak English very well, 26% speak English well, 16% speak English not well, 5% don't speak English at all).
1.4% of residents speak other language at home (75% speak English very well, 16% speak English well, 6% speak English not well, 3% don't speak English at all).
Foreign born population: 1,366,201 (35.7%)
(49.6% of them are naturalized citizens)
| Here: | 5.7 |
| State: | 6.0 |
| Here: | 3.4 |
| State: | 3.9 |
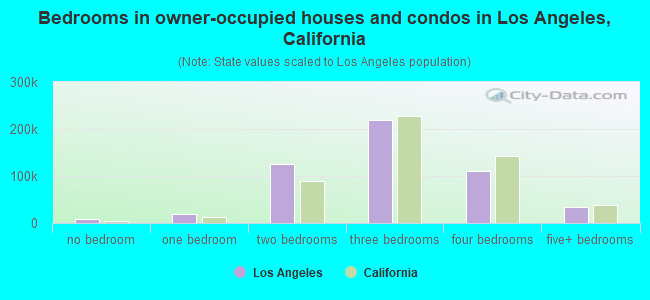
- Bedrooms in owner-occupied houses and condos in Los Angeles, California
- 7,630no bedroom
- 18,8761 bedroom
- 125,6012 bedrooms
- 218,9633 bedrooms
- 109,5984 bedrooms
- 34,4495+ bedrooms
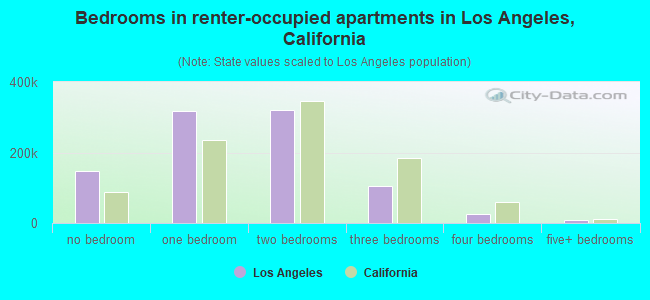
- Bedrooms in renter-occupied apartments in Los Angeles, California
- 148,565no bedroom
- 316,7111 bedroom
- 321,9232 bedrooms
- 103,7643 bedrooms
- 25,9534 bedrooms
- 7,7725+ bedrooms
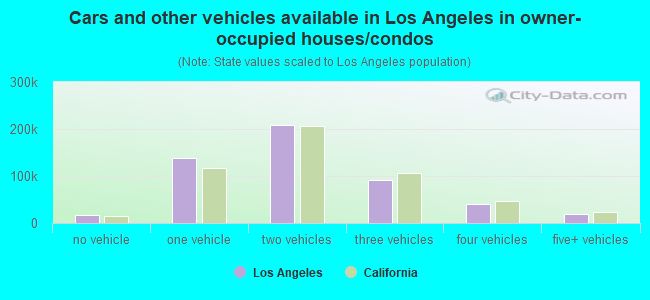
- Cars and other vehicles available in Los Angeles in owner-occupied houses/condos
- 17,902no vehicle
- 137,5051 vehicle
- 207,8322 vehicles
- 91,7623 vehicles
- 39,9724 vehicles
- 20,1445+ vehicles
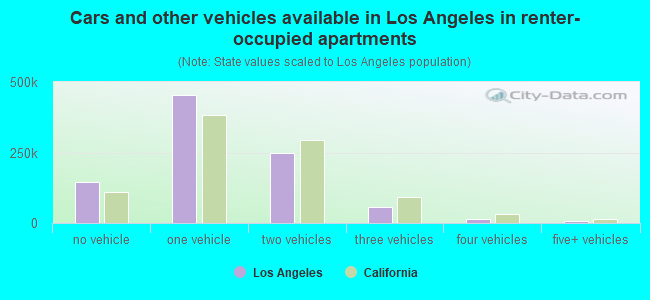
- Cars and other vehicles available in Los Angeles in renter-occupied apartments
- 145,085no vehicle
- 453,0831 vehicle
- 247,2912 vehicles
- 57,4323 vehicles
- 15,3804 vehicles
- 6,4175+ vehicles
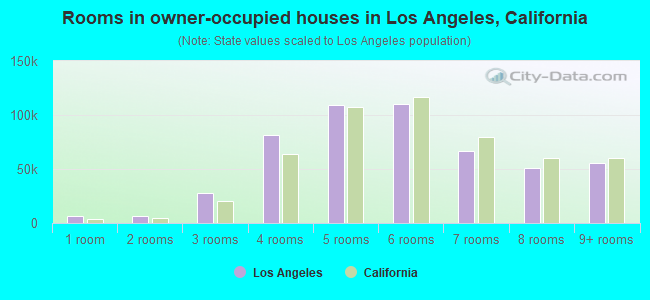
- Rooms in owner-occupied houses in Los Angeles, California
- 6,4511 room
- 6,4732 rooms
- 28,1583 rooms
- 81,5894 rooms
- 109,3475 rooms
- 109,9886 rooms
- 66,5357 rooms
- 50,9928 rooms
- 55,5849+ rooms
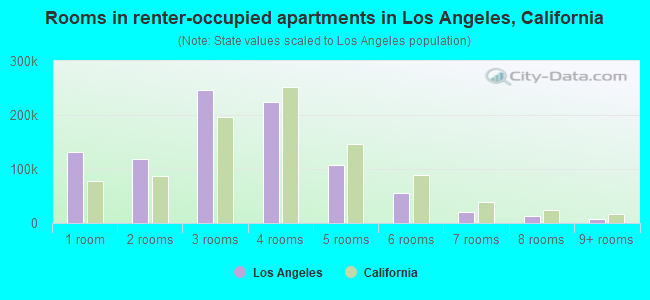
- Rooms in renter-occupied apartments in Los Angeles, California
- 131,4971 room
- 119,3072 rooms
- 245,8363 rooms
- 224,2084 rooms
- 107,2465 rooms
- 55,0216 rooms
- 20,5867 rooms
- 12,6958 rooms
- 8,2929+ rooms
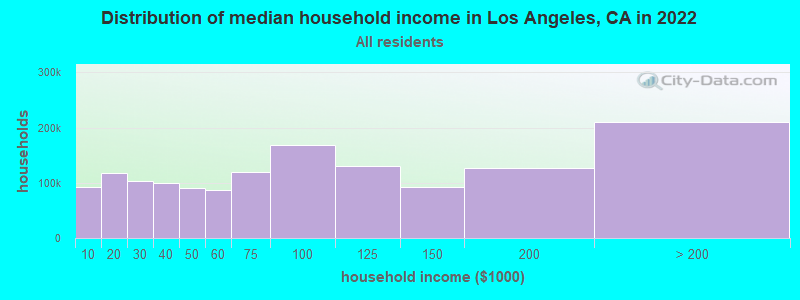
Los Angeles, CA household income distribution

- 91,662Less than $10,000
- 118,425$10,000 to $19,999
- 103,133$20,000 to $29,999
- 99,417$30,000 to $39,999
- 91,389$40,000 to $49,999
- 87,525$50,000 to $59,999
- 119,401$60,000 to $74,999
- 169,010$75,000 to $99,999
- 130,204$100,000 to $124,999
- 93,091$125,000 to $149,999
- 126,560$150,000 to $199,999
- 209,988$200,000 or more
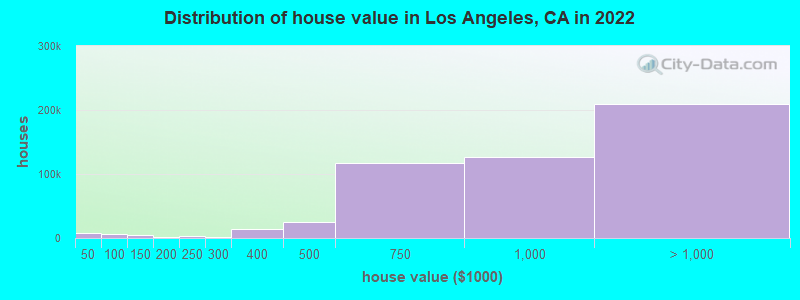
Home value of owner - occupied houses in 2022 in Los Angeles, CA
-
- 5,614Less than $10,000
- 463$10,000 to $14,999
- 258$15,000 to $19,999
- 149$20,000 to $24,999
- 357$25,000 to $29,999
- 338$30,000 to $34,999
- 982$40,000 to $49,999
- 704$50,000 to $59,999
- 1,041$60,000 to $69,999
- 1,629$70,000 to $79,999
- 1,238$80,000 to $89,999
- 1,218$90,000 to $99,999
- 3,117$100,000 to $124,999
- 1,232$125,000 to $149,999
- 1,028$150,000 to $174,999
- 396$175,000 to $199,999
- 2,502$200,000 to $249,999
- 2,142$250,000 to $299,999
- 13,916$300,000 to $399,999
- 24,948$400,000 to $499,999
- 116,798$500,000 to $749,999
- 126,067$750,000 to $999,999
- 94,175$1,000,000 to $1,499,999
- 43,598$1,500,000 to $1,999,999
- 71,207$2,000,000 or more
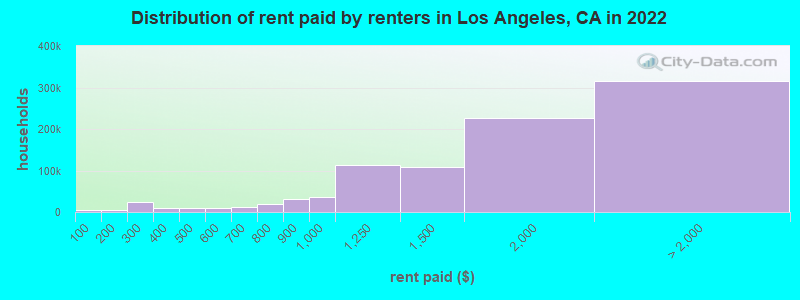
Rent paid by renters in 2022 in Los Angeles, CA
-
- 3,921Less than $100
- 1,724$100 to $149
- 3,833$150 to $199
- 11,339$200 to $249
- 13,299$250 to $299
- 6,698$300 to $349
- 3,320$350 to $399
- 4,797$400 to $449
- 5,238$450 to $499
- 6,413$500 to $549
- 3,471$550 to $599
- 6,500$600 to $649
- 5,550$650 to $699
- 9,394$700 to $749
- 9,076$750 to $799
- 30,353$800 to $899
- 36,376$900 to $999
- 113,424$1,000 to $1,249
- 109,507$1,250 to $1,499
- 225,840$1,500 to $1,999
- 128,803$2,000 to $2,499
- 75,574$2,500 to $2,999
- 36,718$3,000 to $3,499
- 51,343$3,500 or more
- 22,177No cash rent
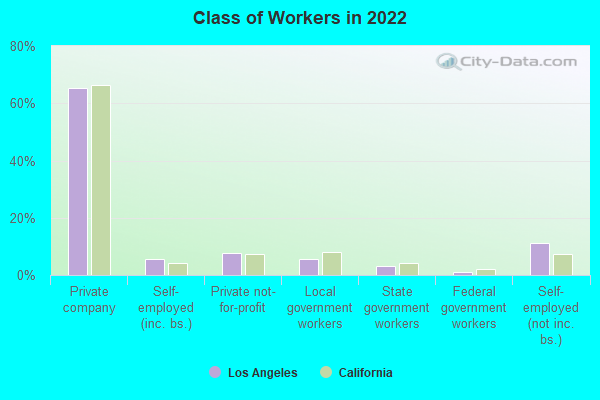
Percentage of workers working in this county: 96.5%
Number of people working at home: 384,360 (19.7% of all workers)
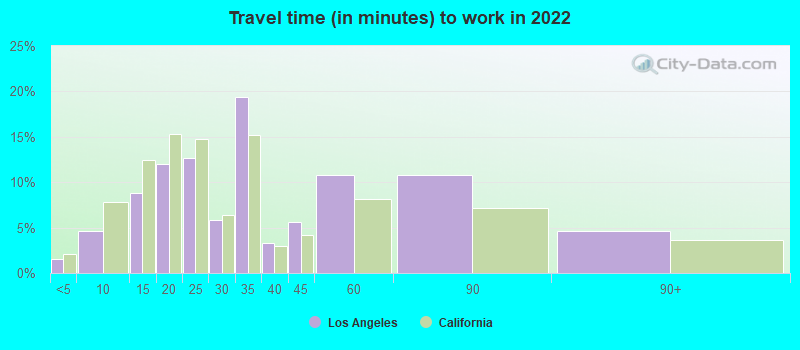
Travel time to work (commute)
- Less than 5 minutes: 26,306
- 5 to 9 minutes: 82,369
- 10 to 14 minutes: 151,523
- 15 to 19 minutes: 206,978
- 20 to 24 minutes: 204,070
- 25 to 29 minutes: 100,848
- 30 to 34 minutes: 311,053
- 35 to 39 minutes: 57,825
- 40 to 44 minutes: 85,289
- 45 to 59 minutes: 154,643
- 60 to 89 minutes: 137,977
- 90 or more minutes: 43,087
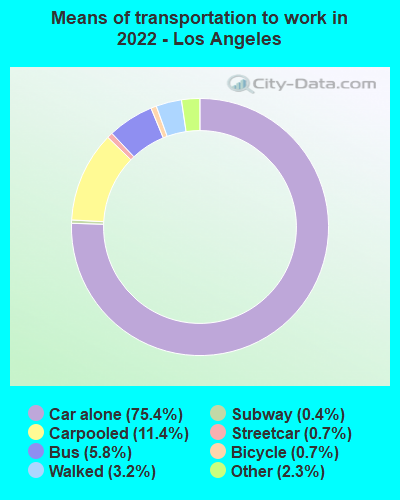
Means of transportation to work:
- Drove a car alone: 1,295,429 (61.6%)
- Carpooled: 196,043 (9.3%)
- Bus: 100,171 (4.8%)
- Subway or elevated rail: 11,463 (0.5%)
- Long-distance train or commuter rail: 6,083 (0.3%)
- Light rail, streetcar or trolley: 1,613 (0.1%)
- Ferryboat: 880 (0.0%)
- Taxi: 38,996 (1.9%)
- Bicycle: 12,297 (0.6%)
- Walked: 55,238 (2.6%)
- Worked at home: 384,360 (18.3%)
- Unemployment by race in 2022
- Unemployment rate for White non-Hispanic residents
- 7.1%Males
- 5.9%Females
- Unemployment rate for Black residents
- 10.6%Males
- 12.3%Females
- Unemployment rate for American Indian and Alaska Native residents
- 7.8%Males
- 4.2%Females
- Unemployment rate for Asian residents
- 5.2%Males
- 4.5%Females
- Unemployment rate for other race residents
- 6.0%Males
- 7.4%Females
- Unemployment rate for two or more race residents
- 6.0%Males
- 7.7%Females
- Unemployment rate for Hispanic or Latino residents
- 5.8%Males
- 7.4%Females
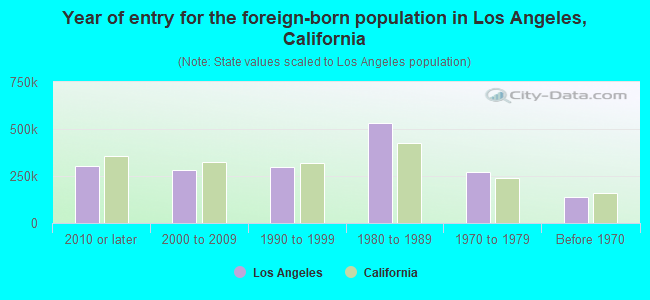
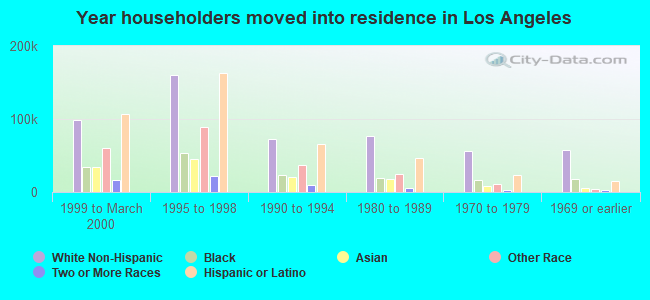
- Year of entry for the foreign-born population in Los Angeles, California
- 304,6352010 or later
- 279,8422000 to 2009
- 297,1341990 to 1999
- 533,9771980 to 1989
- 272,5741970 to 1979
- 136,398Before 1970
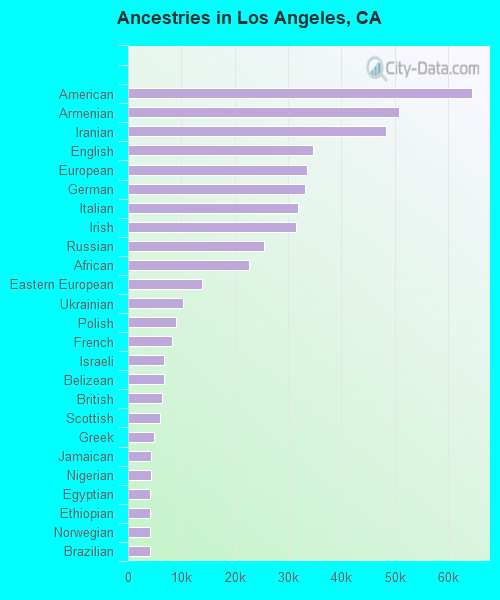
First ancestries reported:
- American: 64,442 (2.7%)
- Armenian: 50,749 (2.1%)
- Iranian: 48,415 (2.0%)
- English: 34,698 (1.4%)
- European: 33,631 (1.4%)
- German: 33,224 (1.4%)
- Italian: 31,935 (1.3%)
- Irish: 31,579 (1.3%)
- Russian: 25,530 (1.1%)
- African: 22,606 (0.9%)
- Eastern European: 13,794 (0.6%)
- Ukrainian: 10,308 (0.4%)
- Polish: 8,977 (0.4%)
- French: 8,205 (0.3%)
- Israeli: 6,689 (0.3%)
- Belizean: 6,661 (0.3%)
- British: 6,409 (0.3%)
- Scottish: 6,029 (0.2%)
- Greek: 4,885 (0.2%)
- Jamaican: 4,362 (0.2%)
- Nigerian: 4,345 (0.2%)
- Egyptian: 4,216 (0.2%)
- Ethiopian: 4,138 (0.2%)
- Norwegian: 4,081 (0.2%)
- Brazilian: 4,058 (0.2%)
- Swedish: 3,827 (0.2%)
- Turkish: 3,355 (0.1%)
- Romanian: 3,313 (0.1%)
- Lebanese: 3,207 (0.1%)
- Hungarian: 2,961 (0.1%)
- Croatian: 2,630 (0.1%)
- South African: 2,560 (0.1%)
- Dutch: 2,402 (0.10%)
- Scotch-Irish: 2,335 (0.10%)
- Portuguese: 2,202 (0.09%)
- Canadian: 1,931 (0.08%)
- Serbian: 1,913 (0.08%)
- Ghanaian: 1,818 (0.08%)
- Haitian: 1,741 (0.07%)
- Lithuanian: 1,685 (0.07%)
- Afghan: 1,670 (0.07%)
- Northern European: 1,539 (0.06%)
- French Canadian: 1,532 (0.06%)
- Moroccan: 1,481 (0.06%)
- Danish: 1,306 (0.05%)
- Syrian: 1,288 (0.05%)
- Assyrian: 1,270 (0.05%)
- Scandinavian: 1,257 (0.05%)
- Austrian: 1,206 (0.05%)
- Finnish: 1,194 (0.05%)
- Welsh: 1,093 (0.05%)
- Czech: 1,086 (0.04%)
- Australian: 1,068 (0.04%)
- Arab: 1,066 (0.04%)
- Palestinian: 971 (0.04%)
- Bulgarian: 906 (0.04%)
- Sudanese: 833 (0.03%)
- West Indian: 829 (0.03%)
- Iraqi: 824 (0.03%)
- Kenyan: 823 (0.03%)
- Slavic: 739 (0.03%)
- Slovak: 572 (0.02%)
- Basque: 563 (0.02%)
- Sierra Leonean: 538 (0.02%)
- Jordanian: 495 (0.02%)
- Belgian: 462 (0.02%)
- Czechoslovakian: 361 (0.01%)
- Cape Verdean: 342 (0.01%)
- New Zealander: 316 (0.01%)
- Yugoslavian: 299 (0.01%)
- Swiss: 284 (0.01%)
- Latvian: 274 (0.01%)
- Cajun: 212 (0.01%)
- Senegalese: 212 (0.01%)
- Albanian: 198 (0.01%)
- Ugandan: 182 (0.01%)
- Trinidadian and Tobagonian: 147 (0.01%)
- Estonian: 131 (0.01%)
Most common places of birth for foreign-born residents (%):
| Los Angeles: | 30.6% (417,964) |
| California: | 36.6% (3,820,641) |
| Los Angeles: | 11.6% (158,484) |
| California: | 4.1% (422,589) |
| Los Angeles: | 9.5% (129,399) |
| California: | 2.9% (306,368) |
| Los Angeles: | 6.2% (85,050) |
| California: | 7.7% (800,706) |
| Los Angeles: | 5.6% (77,034) |
| California: | 3.1% (320,162) |
| Los Angeles: | 4.1% (56,527) |
| California: | 2.1% (216,689) |
| Los Angeles: | 2.8% (38,273) |
| California: | 0.8% (78,648) |
| Los Angeles: | 2.6% (35,873) |
| California: | 6.6% (684,205) |
| Los Angeles: | 1.6% (21,987) |
| California: | 5.6% (579,387) |
| Los Angeles: | 1.6% (21,697) |
| California: | 0.7% (76,638) |
Place of birth for U.S.-born residents:
- This state: 1,792,868
- Other state: 601,509
- Northeast: 186,851
- Midwest: 154,996
- South: 183,130
- West: 76,532
88.7% of Los Angeles residents lived in the same house 1 years ago.
Out of people who lived in different houses, 42.0% lived in this county.
Out of people who lived in different counties, 48.4% lived in California.
| Los Angeles: | 88.7% |
| State average: | 88.9% |
Education attainment for males 25 years and older:
- No schooling: 61,026
- Nursery to 4th grade: 27,055
- 5th and 6th grade: 56,727
- 7th and 8th grade: 19,828
- 9th grade: 34,494
- 10th grade: 14,274
- 11th grade: 24,116
- 12th grade, no diploma: 49,730
- High school graduate (or equivalency): 264,563
- Less than 1 year of college: 58,504
- Some college more than 1 year, no degree: 169,294
- Associate degree: 74,403
- Bachelor's degree: 333,561
- Master's degree: 105,383
- Professional school degree: 47,121
- Doctorate degree: 21,650

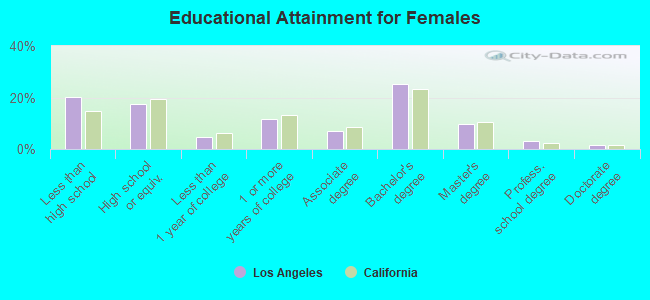
Education attainment for females 25 years and older:
- No schooling: 63,568
- Nursery to 4th grade: 31,652
- 5th and 6th grade: 58,673
- 7th and 8th grade: 23,336
- 9th grade: 29,677
- 10th grade: 14,134
- 11th grade: 18,344
- 12th grade, no diploma: 37,468
- High school graduate (or equivalency): 238,727
- Less than 1 year of college: 62,129
- Some college more than 1 year, no degree: 160,692
- Associate degree: 95,239
- Bachelor's degree: 343,920
- Master's degree: 132,395
- Professional school degree: 40,342
- Doctorate degree: 20,405

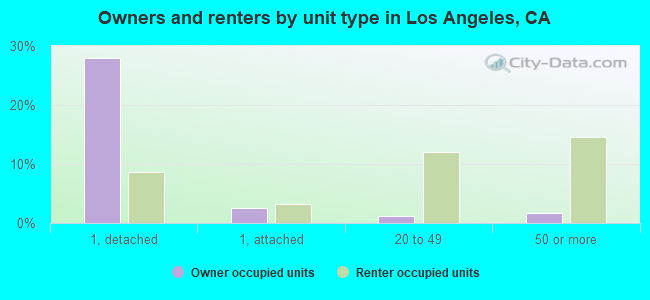
Housing units in structures:
- One, detached: 559,608
- One, attached: 89,014
- Two: 46,807
- 3 or 4: 94,597
- 5 to 9: 136,524
- 10 to 19: 149,526
- 20 to 49: 202,854
- 50 or more: 260,324
- Mobile homes: 9,814
- Boats, RVs, vans, etc.: 821
Median worth of mobile homes: $162,900
Housing units lacking complete kitchen facilities in 2022: 3.0%
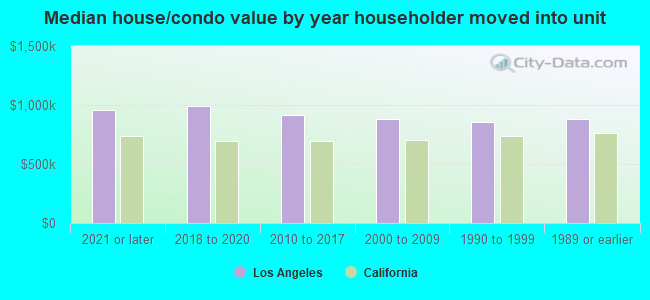
House/condo owner moved in on average 15 years ago
Renter moved in on average 4 years ago
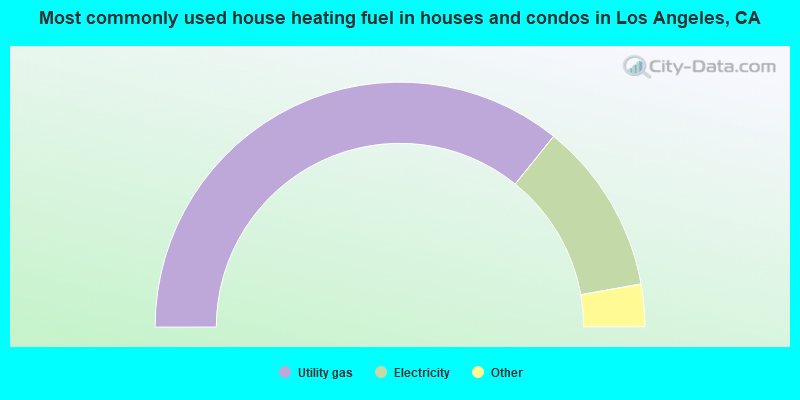
- 71.6%Utility gas
- 22.8%Electricity
- 2.5%No fuel used
- 1.6%Bottled, tank, or LP gas
- 1.3%Solar energy
- 0.1%Other fuel
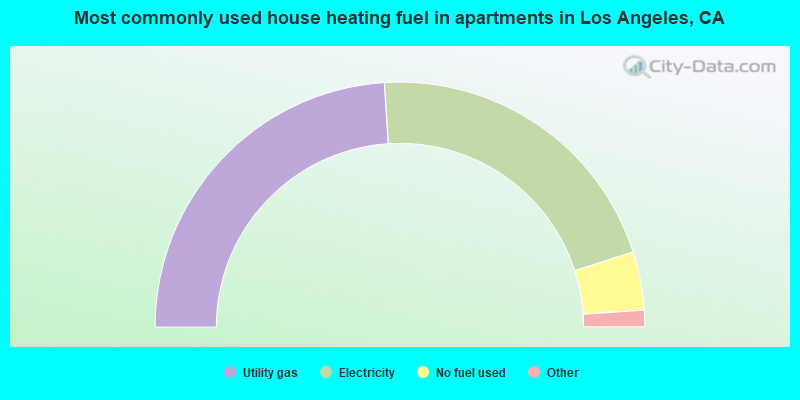
- 48.0%Utility gas
- 42.1%Electricity
- 7.7%No fuel used
- 1.7%Bottled, tank, or LP gas
- 0.2%Other fuel
- 0.1%Fuel oil, kerosene, etc.
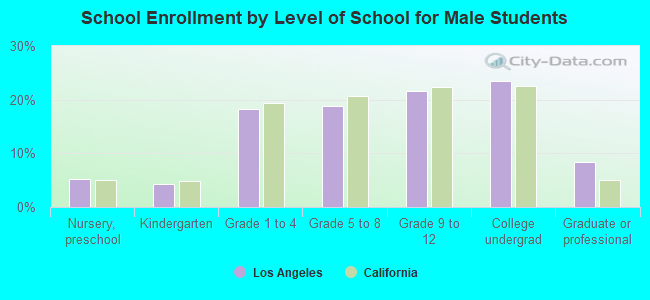
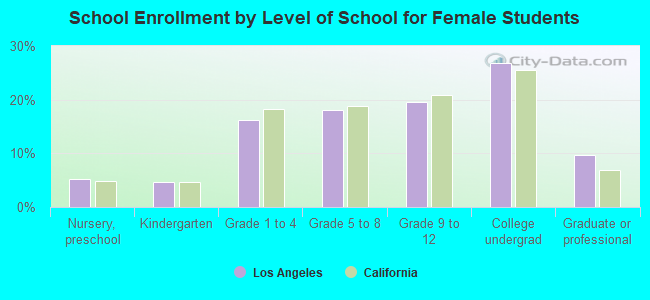
Private vs. public school enrollment:
| Here: | 11.7% |
| California: | 10.5% |
| Here: | 12.2% |
| California: | 8.5% |
| Here: | 24.5% |
| California: | 15.9% |