Louisville, KY (Kentucky) Houses and Residents
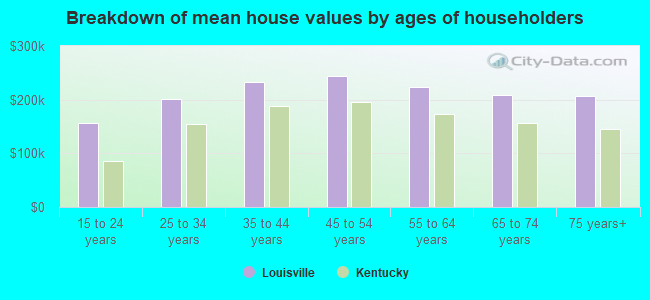
| Louisville: | $197,356 |
| Kentucky: | $196,300 |
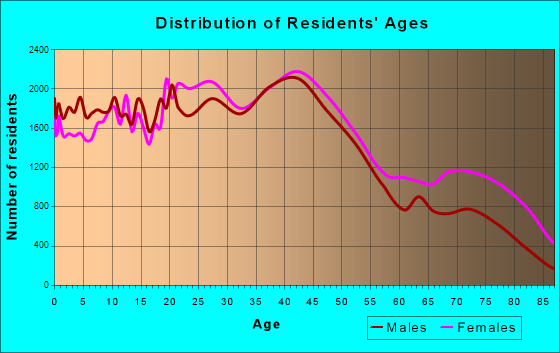
Total population: 262,764 (Urban population: 256,420, Rural population: 0)
Houses: 121,107 (111,354 occupied: 58,481 owner occupied, 52,873 renter occupied)
| % of renters here: | 47% |
| State: | 31% |
Housing density: 1,950 houses/condos per square mile
Median price asked for vacant for-sale houses and condos in 2022 in this county: $108,908.
Median contract rent in 2022: $777 (lower quartile is $556, upper quartile is $1,019)
Median rent asked for vacant for-rent units in 2022: $820
Median gross rent in Louisville, KY in 2022: $947
Housing units in Louisville with a mortgage: 33,359 (4,100 second mortgage, 4,661 home equity loan, 121 both second mortgage and home equity loan)
Houses without a mortgage: 19,560
Compare current foreclosures in Louisville, KY:
| Photo | Address | Area | Beds / Baths | Price | Details |
|---|---|---|---|---|---|

|
#1
Melody Way
Louisville, KY 40299
|
1,242 sq. feet
|
1 baths 3 beds |
$300,000
|
show details |

|
#2
Gullane Ct
Louisville, KY 40222
|
1,945 sq. feet
|
3 baths 3 beds |
$291,650
|
show details |

|
#3
Hazel St
Louisville, KY 40211
|
1,100 sq. feet
|
1 baths 3 beds |
$140,000
|
show details |

|
#4
Denmark St
Louisville, KY 40215
|
858 sq. feet
|
1 baths 2 beds |
show details | |

|
#5
S 5th St
Louisville, KY 40214
|
1,008 sq. feet
|
1 baths 3 beds |
show details | |

|
#6
Leo Ln
Louisville, KY 40299
|
1,785 sq. feet
|
2 baths 1 beds |
show details | |

|
#7
S Campbell St Unit 210
Louisville, KY 40206
|
1,237 sq. feet
|
1 baths 1 beds |
show details | |

|
#8
S 28th St
Louisville, KY 40211
|
1,000 sq. feet
|
1 baths 2 beds |
show details | |

|
#9
Welch Dr
Louisville, KY 40272
|
740 sq. feet
|
1 baths 2 beds |
show details | |

|
#10
S 36th St
Louisville, KY 40211
|
1,766 sq. feet
|
2 baths 3 beds |
show details |
| Photo | Address | Area | Beds / Baths | Price | Details |
|---|---|---|---|---|---|

|
#11
S 37th St
Louisville, KY 40211
|
1,434 sq. feet
|
2 baths 1 beds |
show details | |

|
#12
Prestwood Dr
Louisville, KY 40219
|
1,900 sq. feet
|
1 baths 3 beds |
show details | |

|
#13
Wilmoth Ave
Louisville, KY 40216
|
816 sq. feet
|
1 baths 2 beds |
show details | |

|
#14
Imperial Ter
Louisville, KY 40216
|
1,028 sq. feet
|
1 baths 3 beds |
show details | |

|
#15
Saint Rene Rd
Louisville, KY 40299
|
1,174 sq. feet
|
2 baths 3 beds |
show details | |

|
#16
Garland Ave
Louisville, KY 40211
|
1,414 sq. feet
|
1 baths 3 beds |
show details | |

|
#17
Wurtele Ave
Louisville, KY 40216
|
1,016 sq. feet
|
2 baths 4 beds |
show details | |

|
#18
S 43rd St
Louisville, KY 40212
|
1,444 sq. feet
|
1 baths 1 beds |
show details | |

|
#19
Beecher St
Louisville, KY 40215
|
1,200 sq. feet
|
1 baths 3 beds |
show details | |

|
#20
Tradesmill Dr
Louisville, KY 40291
|
1,564 sq. feet
|
2 baths 3 beds |
show details |
| Photo | Address | Area | Beds / Baths | Price | Details |
|---|---|---|---|---|---|

|
#21
Mae Street Kidd Ct
Louisville, KY 40211
|
1,394 sq. feet
|
3 baths 3 beds |
show details | |

|
#22
Cross Rd
Louisville, KY 40204
|
2,696 sq. feet
|
2 baths 2 beds |
show details | |

|
#23
Dearing Woods Dr
Louisville, KY 40272
|
1,260 sq. feet
|
2 baths 3 beds |
show details | |

|
#24
Overlook Rd
Louisville, KY 40229
|
900 sq. feet
|
1 baths 3 beds |
show details | |

|
#25
Summitt Dr
Louisville, KY 40229
|
1,100 sq. feet
|
1 baths 4 beds |
show details | |

|
#26
Overlook Rd
Louisville, KY 40229
|
900 sq. feet
|
1 baths 3 beds |
show details | |

|
#27
Blossom Rd
Louisville, KY 40229
|
925 sq. feet
|
1 baths 3 beds |
show details | |

|
#28
Starlite Dr
Louisville, KY 40229
|
900 sq. feet
|
1 baths 3 beds |
show details | |

|
#29
Minors Lane
Louisville, KY 40219
|
- sq. feet
|
1 baths 2 beds |
show details | |

|
#30
Prairie Dr
Louisville, KY 40229
|
888 sq. feet
|
1 baths 3 beds |
show details |
| Photo | Address | Area | Beds / Baths | Price | Details |
|---|---|---|---|---|---|

|
#31
Knollwood Cir
Louisville, KY 40229
|
1,054 sq. feet
|
1 baths 3 beds |
show details | |

|
#32
Cody Ln
Louisville, KY 40229
|
1,368 sq. feet
|
1 baths 3 beds |
show details | |

|
#33
Wilma Ave
Louisville, KY 40229
|
2,044 sq. feet
|
1 baths 4 beds |
show details | |

|
#34
Somerset Dr
Louisville, KY 40229
|
1,014 sq. feet
|
1 baths 3 beds |
show details | |

|
#35
Earlywood Way
Louisville, KY 40229
|
1,552 sq. feet
|
2 baths 4 beds |
show details | |

|
#36
Meadowood Rd
Louisville, KY 40229
|
840 sq. feet
|
1 baths 3 beds |
show details | |

|
#37
Blossom Rd
Louisville, KY 40229
|
900 sq. feet
|
1 baths 3 beds |
show details | |

|
#38
Meadowood Rd
Louisville, KY 40229
|
1,176 sq. feet
|
2 baths 3 beds |
show details | |

|
#39
Wise Ct
Louisville, KY 40229
|
900 sq. feet
|
1 baths 3 beds |
show details | |

|
#40
Hillside Ln
Louisville, KY 40229
|
888 sq. feet
|
1 baths 3 beds |
show details |
| Photo | Address | Area | Beds / Baths | Price | Details |
|---|---|---|---|---|---|

|
#41
Tumbleweed Dr
Louisville, KY 40229
|
1,200 sq. feet
|
1 baths 3 beds |
show details | |

|
#42
Summitt Dr
Louisville, KY 40229
|
1,000 sq. feet
|
1 baths 3 beds |
show details | |

|
#43
Jessamine Ln
Louisville, KY 40258
|
1,134 sq. feet
|
1 baths - beds |
show details | |

|
#44
Starlite Ct
Louisville, KY 40229
|
1,788 sq. feet
|
1 baths 3 beds |
show details | |

|
#45
Glenview Rd
Louisville, KY 40229
|
900 sq. feet
|
1 baths 3 beds |
show details | |

|
#46
Rochelle Rd
Louisville, KY 40228
|
- sq. feet
|
1 baths 3 beds |
show details | |

|
#47
Blanton Ln
Louisville, KY 40216
|
- sq. feet
|
1 baths 4 beds |
show details | |

|
#48
Summitt Dr
Louisville, KY 40229
|
1,390 sq. feet
|
1 baths 3 beds |
show details | |

|
#49
Overdale Dr
Louisville, KY 40229
|
1,092 sq. feet
|
1 baths 3 beds |
show details | |

|
Check over 1 million property listings on Foreclosure.com!
|
browse all offers | |||

Latest news about housing in Louisville, KY collected exclusively by city-data.com from local newspapers, TV, and radio stations

 | Homes for rent outside of Louisville (0 replies) |
| Home prices - can we even afford a house in a nice are of Louisville? (22 replies) |
| Eviction Friendly Apartments in Louisville (11 replies) |
| Looking to rent home/condo outside of Louisville (2 replies) |
| Bad credit and need apartment or house in Louisville asap! (11 replies) |
| Louisville Construction/Development (12 replies) |
Household type by relationship:
Households: 726,943- In family households: 580,435 (118,887 male householders, 70,095 female householders)
126,329 spouses, 205,111 children (190,669 natural, 5,126 adopted, 9,316 stepchildren), 18,004 grandchildren, 7,360 brothers or sisters, 5,615 parents, foster children, 8,500 other relatives, 17,409 non-relatives
- In nonfamily households: 146,508 (55,241 male householders (43,300 living alone)), 64,952 female householders (55,543 living alone)), 26,315 nonrelatives
- In group quarters: 14,153 (8,529 institutionalized population)
98,371 married couples with children.
51,135 single-parent households (8,275 men, 42,860 women).
93.8% of residents of Louisville speak English at home.
2.7% of residents speak Spanish at home (50% speak English very well, 20% speak English well, 23% speak English not well, 8% don't speak English at all).
1.9% of residents speak other Indo-European language at home (61% speak English very well, 20% speak English well, 17% speak English not well, 3% don't speak English at all).
1.1% of residents speak Asian or Pacific Island language at home (39% speak English very well, 33% speak English well, 25% speak English not well, 3% don't speak English at all).
0.5% of residents speak other language at home (51% speak English very well, 30% speak English well, 16% speak English not well, 3% don't speak English at all).
Foreign born population: 25,772 (9.0%)
(35.7% of them are naturalized citizens)
| Here: | 5.4 |
| State: | 6.4 |
| Here: | 3.2 |
| State: | 4.4 |
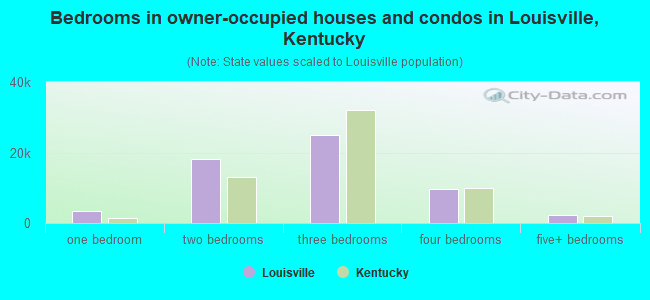
- Bedrooms in owner-occupied houses and condos in Louisville, Kentucky
- 84no bedroom
- 3,2701 bedroom
- 18,2922 bedrooms
- 24,9613 bedrooms
- 9,6364 bedrooms
- 2,2385+ bedrooms
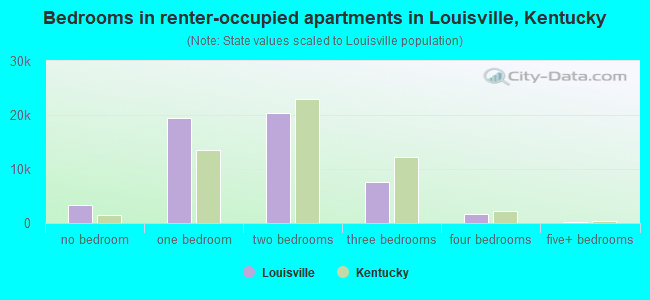
- Bedrooms in renter-occupied apartments in Louisville, Kentucky
- 3,365no bedroom
- 19,5131 bedroom
- 20,3982 bedrooms
- 7,5883 bedrooms
- 1,7414 bedrooms
- 2685+ bedrooms
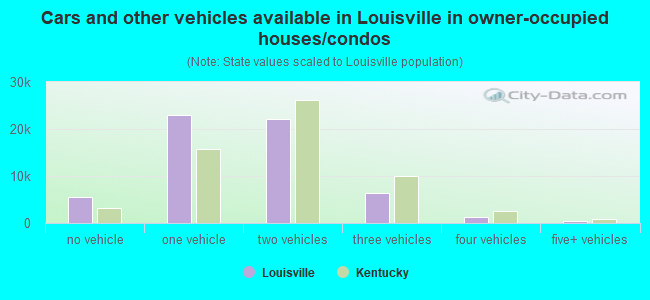
- Cars and other vehicles available in Louisville in owner-occupied houses/condos
- 5,436no vehicle
- 22,8971 vehicle
- 22,0272 vehicles
- 6,3293 vehicles
- 1,3104 vehicles
- 4825+ vehicles
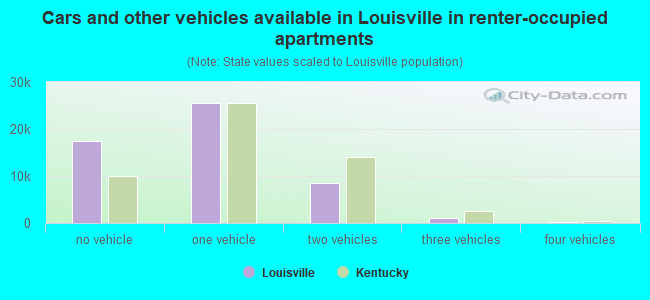
- Cars and other vehicles available in Louisville in renter-occupied apartments
- 17,362no vehicle
- 25,5141 vehicle
- 8,4382 vehicles
- 1,1523 vehicles
- 2484 vehicles
- 1595+ vehicles
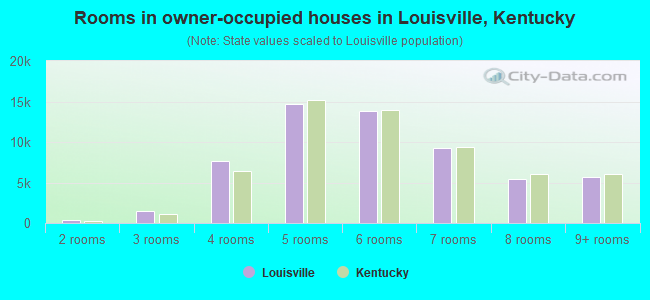
- Rooms in owner-occupied houses in Louisville, Kentucky
- 411 room
- 3412 rooms
- 1,4883 rooms
- 7,6324 rooms
- 14,6815 rooms
- 13,8576 rooms
- 9,2767 rooms
- 5,4748 rooms
- 5,6919+ rooms
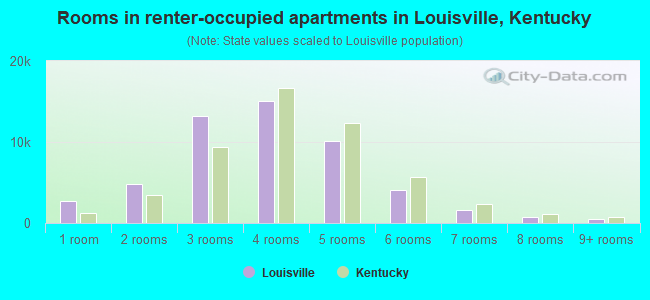
- Rooms in renter-occupied apartments in Louisville, Kentucky
- 2,7391 room
- 4,8422 rooms
- 13,2143 rooms
- 15,0454 rooms
- 10,1065 rooms
- 4,1206 rooms
- 1,6347 rooms
- 7278 rooms
- 4469+ rooms
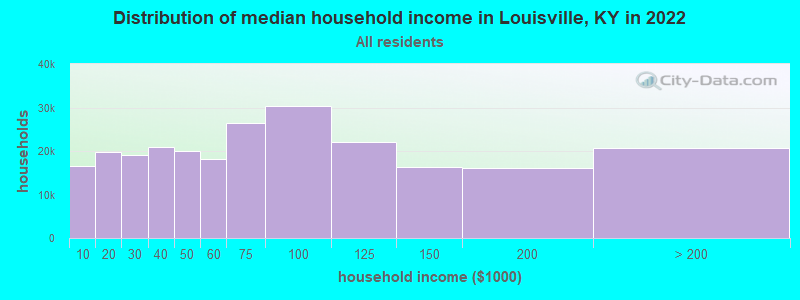
Louisville, KY household income distribution

- 16,617Less than $10,000
- 19,810$10,000 to $19,999
- 19,056$20,000 to $29,999
- 21,017$30,000 to $39,999
- 19,908$40,000 to $49,999
- 18,081$50,000 to $59,999
- 26,398$60,000 to $74,999
- 30,354$75,000 to $99,999
- 22,034$100,000 to $124,999
- 16,331$125,000 to $149,999
- 16,038$150,000 to $199,999
- 20,640$200,000 or more
Percentage of workers working in this county: 91.2%
Number of people working at home: 18,876 (14.4% of all workers)
Travel time to work (commute)
- Less than 5 minutes: 2,885
- 5 to 9 minutes: 11,251
- 10 to 14 minutes: 21,366
- 15 to 19 minutes: 25,953
- 20 to 24 minutes: 20,894
- 25 to 29 minutes: 6,315
- 30 to 34 minutes: 11,058
- 35 to 39 minutes: 1,229
- 40 to 44 minutes: 1,233
- 45 to 59 minutes: 2,762
- 60 to 89 minutes: 2,209
- 90 or more minutes: 1,800
Means of transportation to work:
- Drove a car alone: 81,542 (73.5%)
- Carpooled: 14,016 (12.6%)
- Bus or trolley bus: 7,461 (6.7%)
- Streetcar or trolley car: 62 (0.1%)
- Subway or elevated: 6 (0.0%)
- Ferryboat: 12 (0.0%)
- Taxi: 67 (0.1%)
- Motorcycle: 101 (0.1%)
- Bicycle: 489 (0.4%)
- Walked: 4,539 (4.1%)
- Other means: 660 (0.6%)
- Worked at home: 1,975 (1.8%)
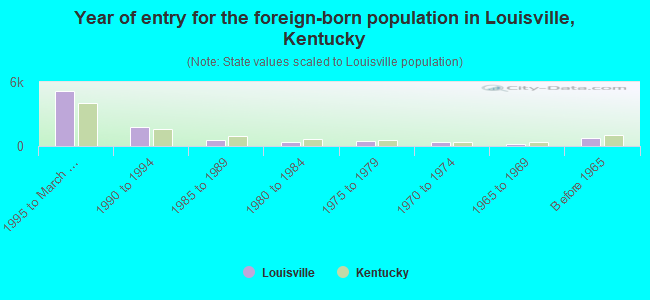
- Year of entry for the foreign-born population in Louisville, Kentucky
- 5,1561995 to March 2000
- 1,7591990 to 1994
- 5891985 to 1989
- 3511980 to 1984
- 4791975 to 1979
- 3421970 to 1974
- 1791965 to 1969
- 795Before 1965
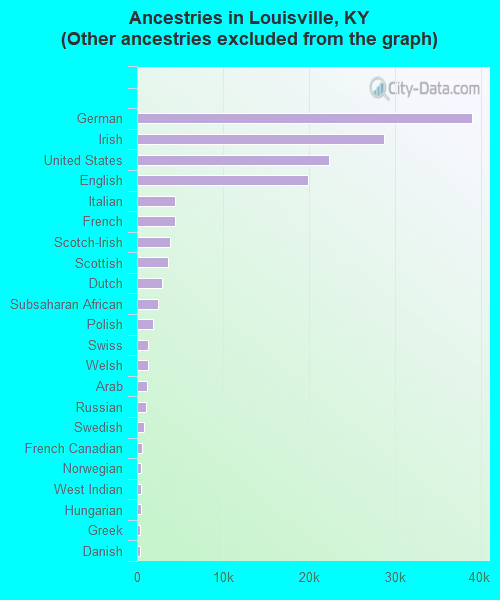
First ancestries reported:
- Other: 94,184 (39.8%)
- German: 38,979 (16.5%)
- Irish: 28,741 (12.1%)
- United States: 22,380 (9.4%)
- English: 19,923 (8.4%)
- Italian: 4,469 (1.9%)
- French: 4,464 (1.9%)
- Scotch-Irish: 3,833 (1.6%)
- Scottish: 3,603 (1.5%)
- Dutch: 2,863 (1.2%)
- Subsaharan African: 2,434 (1.0%)
- Polish: 1,859 (0.8%)
- Swiss: 1,277 (0.5%)
- Welsh: 1,237 (0.5%)
- Arab: 1,203 (0.5%)
- Russian: 1,002 (0.4%)
- Swedish: 845 (0.4%)
- French Canadian: 546 (0.2%)
- Norwegian: 518 (0.2%)
- West Indian: 443 (0.2%)
- Hungarian: 423 (0.2%)
- Greek: 377 (0.2%)
- Danish: 360 (0.2%)
- Czech: 247 (0.1%)
- Lithuanian: 243 (0.1%)
- Ukrainian: 219 (0.09%)
- Portuguese: 166 (0.07%)
- Slovak: 97 (0.04%)
Most common places of birth for foreign-born residents (%):
| Louisville: | 15.5% (1,494) |
| Kentucky: | 3.1% (2,459) |
| Louisville: | 11.1% (1,067) |
| Kentucky: | 3.4% (2,702) |
| Louisville: | 9.3% (895) |
| Kentucky: | 3.4% (2,731) |
| Louisville: | 5.3% (513) |
| Kentucky: | 19.3% (15,511) |
| Louisville: | 4.1% (400) |
| Kentucky: | 4.7% (3,734) |
| Louisville: | 3.8% (365) |
| Kentucky: | 6.2% (4,983) |
| Louisville: | 3.8% (362) |
| Kentucky: | 8.3% (6,658) |
| Louisville: | 3.2% (311) |
| Kentucky: | 4.0% (3,217) |
| Louisville: | 2.8% (270) |
| Kentucky: | 3.5% (2,816) |
| Louisville: | 2.5% (245) |
| Kentucky: | 0.9% (691) |
| Louisville: | 2.4% (236) |
| Kentucky: | 3.2% (2,532) |
| Louisville: | 2.2% (211) |
| Kentucky: | 0.5% (370) |
| Louisville: | 2.1% (199) |
| Kentucky: | 1.2% (925) |
| Louisville: | 1.9% (183) |
| Kentucky: | 4.3% (3,464) |
| Louisville: | 1.8% (174) |
| Kentucky: | 1.5% (1,174) |
| Louisville: | 1.7% (167) |
| Kentucky: | 0.7% (575) |
| Louisville: | 1.7% (166) |
| Kentucky: | 0.7% (580) |
| Louisville: | 1.6% (150) |
| Kentucky: | 0.4% (291) |
Place of birth for U.S.-born residents:
- This state: 193,908
- Other state: 51,480
- Northeast: 6,421
- Midwest: 20,494
- South: 20,486
- West: 4,079
53% of Louisville residents lived in the same house 5 years ago.
Out of people who lived in different houses, 75% lived in this county.
Out of people who lived in different counties, 35% lived in Kentucky.
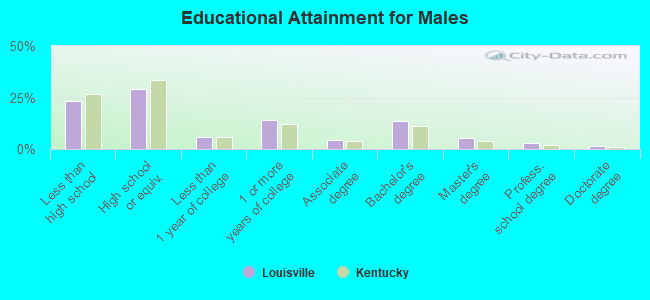
Education attainment for males 25 years and older:
- No schooling: 922
- Nursery to 4th grade: 403
- 5th and 6th grade: 923
- 7th and 8th grade: 3,235
- 9th grade: 2,808
- 10th grade: 3,300
- 11th grade: 2,974
- 12th grade, no diploma: 3,575
- High school graduate (or equivalency): 22,479
- Less than 1 year of college: 4,606
- Some college more than 1 year, no degree: 10,944
- Associate degree: 3,360
- Bachelor's degree: 10,331
- Master's degree: 3,949
- Professional school degree: 2,408
- Doctorate degree: 992
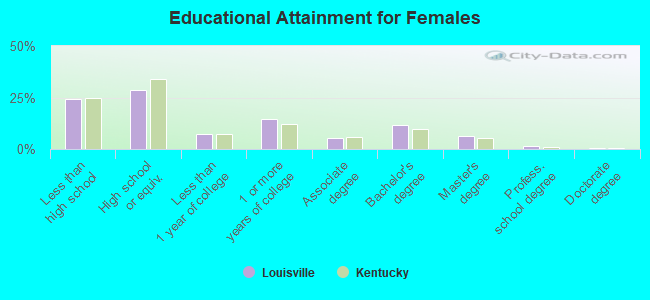
Education attainment for females 25 years and older:
- No schooling: 855
- Nursery to 4th grade: 363
- 5th and 6th grade: 968
- 7th and 8th grade: 4,556
- 9th grade: 3,489
- 10th grade: 4,232
- 11th grade: 3,896
- 12th grade, no diploma: 4,074
- High school graduate (or equivalency): 26,458
- Less than 1 year of college: 6,875
- Some college more than 1 year, no degree: 13,299
- Associate degree: 4,758
- Bachelor's degree: 10,940
- Master's degree: 5,663
- Professional school degree: 1,378
- Doctorate degree: 429
Housing units in structures:
- One, detached: 71,200
- One, attached: 2,159
- Two: 6,409
- 3 or 4: 12,220
- 5 to 9: 9,122
- 10 to 19: 8,246
- 20 to 49: 4,701
- 50 or more: 6,716
- Mobile homes: 317
- Boats, RVs, vans, etc.: 17
Median worth of mobile homes: $32,698
Housing units lacking complete kitchen facilities: 1.1%

- 89.7%Utility gas
- 9.2%Electricity
- 0.6%Bottled, tank, or LP gas
- 0.2%Fuel oil, kerosene, etc.
- 0.1%Other fuel
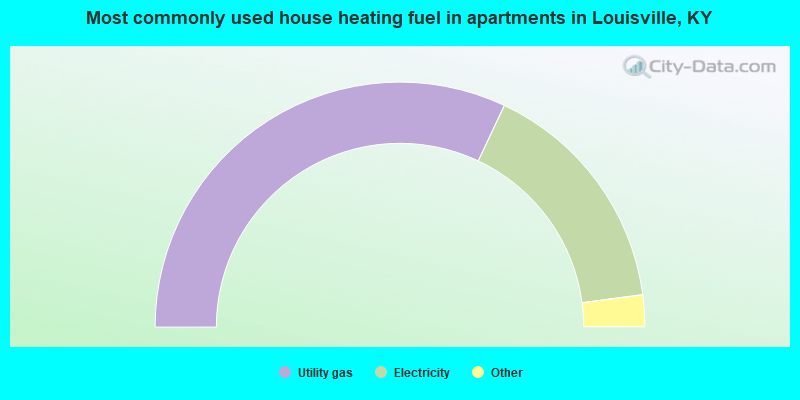
- 64.1%Utility gas
- 31.8%Electricity
- 1.5%Other fuel
- 1.3%Bottled, tank, or LP gas
- 1.1%No fuel used
- 0.2%Fuel oil, kerosene, etc.
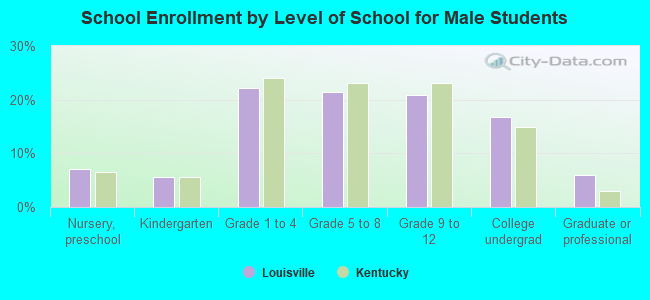
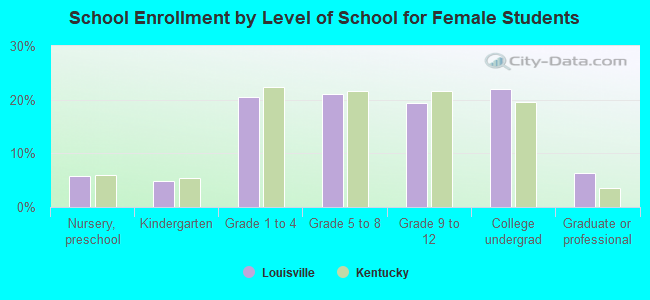
Private vs. public school enrollment:
| Here: | 15.7% |
| Kentucky: | 11.9% |
| Here: | 15.1% |
| Kentucky: | 10.6% |
| Here: | 22.9% |
| Kentucky: | 18.1% |