Milwaukee, WI (Wisconsin) Houses and Residents
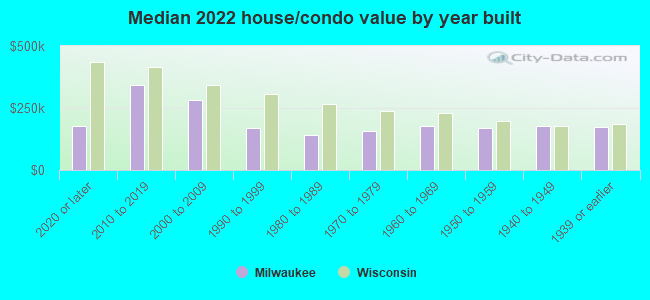
| Milwaukee: | $174,600 |
| Wisconsin: | $252,800 |
Mean price in 2022:
Detached houses: $191,674
Here: $191,674 State: $308,468 Townhouses or other attached units: $212,431
Here: $212,431 State: $265,873 In 2-unit structures: $182,980
Here: $182,980 State: $203,667 In 3-to-4-unit structures: $171,588
Here: $171,588 State: $216,833 In 5-or-more-unit structures: $291,955
Here: $291,955 State: $280,537 Mobile homes: $39,995
Here: $39,995 State: $79,042
Total population: 599,642 (Urban population: 596,956, Rural population: 0)
Houses: 261,223 (233,854 occupied: 95,982 owner occupied, 137,872 renter occupied)
| % of renters here: | 59% |
| State: | 32% |
Housing density: 2,719 houses/condos per square mile
Median price asked for vacant for-sale houses and condos in 2022: $184,182.
Median contract rent in 2022: $812 (lower quartile is $651, upper quartile is $1,026)
Median rent asked for vacant for-rent units in 2022: $814
Median gross rent in Milwaukee, WI in 2022: $962
Housing units in Milwaukee with a mortgage: 62,258 (5,634 second mortgage, 310 home equity loan, 4,469 both second mortgage and home equity loan)
Houses without a mortgage: 1,957
Median household income for houses/condos with a mortgage: $81,438
Median household income for apartments without a mortgage: $55,261
Median monthly housing costs: $1,016
Compare current foreclosures in Milwaukee, WI:
| Photo | Address | Area | Beds / Baths | Price | Details |
|---|---|---|---|---|---|

|
#1
S 47th St
Milwaukee, WI 53219
|
826 sq. feet
|
1 baths 2 beds |
$167,000
|
show details |

|
#2
N 25th St
Milwaukee, WI 53206
|
854 sq. feet
|
1 baths 2 beds |
$129,900
|
show details |

|
#3
N Deer Ct
Milwaukee, WI 53223
|
1,641 sq. feet
|
1 baths 3 beds |
$339,900
|
show details |

|
#4
N 44th St
Milwaukee, WI 53210
|
1,885 sq. feet
|
2 baths 4 beds |
$89,900
|
show details |

|
#5
N 62nd St
Milwaukee, WI 53218
|
991 sq. feet
|
2 baths 3 beds |
$155,000
|
show details |

|
#6
N 36th St
Milwaukee, WI 53216
|
1,169 sq. feet
|
1 baths 2 beds |
$145,000
|
show details |

|
#7
N 44th St
Milwaukee, WI 53218
|
- sq. feet
|
1 baths 2 beds |
$43,050
|
show details |

|
#8
N 38th St
Milwaukee, WI 53210
|
- sq. feet
|
2 baths 4 beds |
$41,600
|
show details |

|
#9
S 15th Pl
Milwaukee, WI 53215
|
- sq. feet
|
2 baths 5 beds |
$86,300
|
show details |

|
#10
N 6th St
Milwaukee, WI 53212
|
972 sq. feet
|
1 baths 2 beds |
show details |
| Photo | Address | Area | Beds / Baths | Price | Details |
|---|---|---|---|---|---|

|
#11
W Cleveland Ave
Milwaukee, WI 53219
|
1,263 sq. feet
|
1 baths 3 beds |
show details | |

|
#12
N 65th St
Milwaukee, WI 53213
|
1,575 sq. feet
|
1 baths 3 beds |
show details | |

|
#13
N 74th St
Milwaukee, WI 53218
|
1,110 sq. feet
|
1 baths 4 beds |
show details | |

|
#14
N 50th St
Milwaukee, WI 53216
|
1,417 sq. feet
|
1 baths 4 beds |
show details | |

|
#15
W Wells St
Milwaukee, WI 53213
|
1,984 sq. feet
|
2 baths 6 beds |
show details | |

|
#16
N 29th St
Milwaukee, WI 53216
|
1,713 sq. feet
|
2 baths 4 beds |
show details | |

|
#17
N 70th St
Milwaukee, WI 53223
|
1,252 sq. feet
|
2 baths 3 beds |
show details | |

|
#18
N 50th St
Milwaukee, WI 53210
|
2,371 sq. feet
|
2 baths 4 beds |
show details | |

|
#19
N 56th St
Milwaukee, WI 53218
|
914 sq. feet
|
1 baths 3 beds |
show details | |

|
#20
W Keefe Ave
Milwaukee, WI 53212
|
1,788 sq. feet
|
2 baths 4 beds |
show details |
| Photo | Address | Area | Beds / Baths | Price | Details |
|---|---|---|---|---|---|

|
#21
W Chambers St
Milwaukee, WI 53212
|
1,067 sq. feet
|
1 baths 3 beds |
show details | |

|
#22
N 91st St
Milwaukee, WI 53224
|
1,331 sq. feet
|
1 baths 4 beds |
show details | |

|
#23
N 20th St
Milwaukee, WI 53206
|
1,844 sq. feet
|
2 baths 4 beds |
show details | |

|
#24
N 53rd St
Milwaukee, WI 53216
|
2,323 sq. feet
|
2 baths 4 beds |
show details | |

|
#25
S 77th St
Milwaukee, WI 53219
|
549 sq. feet
|
1 baths 2 beds |
show details | |

|
#26
W Hope Ave
Milwaukee, WI 53222
|
1,120 sq. feet
|
1 baths 3 beds |
show details | |

|
#27
N 47th St
Milwaukee, WI 53208
|
1,988 sq. feet
|
2 baths 5 beds |
show details | |

|
#28
N 42nd St
Milwaukee, WI 53216
|
- sq. feet
|
1 baths 4 beds |
show details | |

|
#29
N 64th St
Milwaukee, WI 53218
|
1,214 sq. feet
|
1 baths 2 beds |
show details | |

|
#30
S Pine Ave
Milwaukee, WI 53207
|
1,901 sq. feet
|
1 baths 5 beds |
show details |
| Photo | Address | Area | Beds / Baths | Price | Details |
|---|---|---|---|---|---|

|
#31
W Melvina St
Milwaukee, WI 53222
|
1,064 sq. feet
|
1 baths 3 beds |
show details | |

|
#32
Glenview Ave
Milwaukee, WI 53213
|
6,356 sq. feet
|
3 baths 7 beds |
show details | |

|
#33
N 51st Blvd
Milwaukee, WI 53218
|
1,244 sq. feet
|
2 baths 2 beds |
show details | |

|
#34
N Palmer St
Milwaukee, WI 53212
|
1,217 sq. feet
|
1 baths 4 beds |
show details | |

|
#35
N 99th St
Milwaukee, WI 53222
|
1,286 sq. feet
|
1 baths 5 beds |
show details | |

|
#36
W Denver Ave
Milwaukee, WI 53224
|
1,376 sq. feet
|
1 baths 3 beds |
show details | |

|
#37
W Lawn Ave
Milwaukee, WI 53225
|
1,060 sq. feet
|
1 baths 3 beds |
show details | |

|
#38
N 36th St
Milwaukee, WI 53216
|
1,977 sq. feet
|
2 baths 4 beds |
show details | |

|
#39
W Villard Ave
Milwaukee, WI 53218
|
936 sq. feet
|
1 baths 3 beds |
show details | |

|
#40
N 56th St
Milwaukee, WI 53218
|
- sq. feet
|
1 baths 2 beds |
show details |
| Photo | Address | Area | Beds / Baths | Price | Details |
|---|---|---|---|---|---|

|
#41
S 56th St
Milwaukee, WI 53220
|
- sq. feet
|
1 baths 3 beds |
show details | |

|
#42
S 124th St
Milwaukee, WI 53227
|
1,193 sq. feet
|
1 baths 2 beds |
show details | |

|
#43
W Linwal Ln
Milwaukee, WI 53209
|
- sq. feet
|
1 baths 3 beds |
show details | |

|
#44
N 21st St
Milwaukee, WI 53206
|
- sq. feet
|
1 baths 5 beds |
show details | |

|
#45
W College Ave
Milwaukee, WI 53221
|
- sq. feet
|
1 baths 3 beds |
show details | |

|
#46
N 60th St
Milwaukee, WI 53210
|
2,241 sq. feet
|
- baths - beds |
show details | |

|
#47
N 65th St
Milwaukee, WI 53218
|
- sq. feet
|
1 baths 3 beds |
show details | |

|
#48
S Taylor Ave
Milwaukee, WI 53207
|
- sq. feet
|
1 baths 3 beds |
show details | |

|
#49
W Ring St
Milwaukee, WI 53212
|
- sq. feet
|
2 baths 6 beds |
show details | |

|
Check over 1 million property listings on Foreclosure.com!
|
browse all offers | |||

Latest news about housing in Milwaukee, WI collected exclusively by city-data.com from local newspapers, TV, and radio stations


Median year apartment built: 1956
Household type by relationship:
Households: 563,306- Male householders: 104,081 (48,365 living alone), Female householders: 129,773 (46,818 living alone)
58,321 spouses (57,141 opposite-sex spouses), 22,819 unmarried partners, (21,362 opposite-sex unmarried partners), 167,783 children (159,758 natural, 3,580 adopted, 4,445 stepchildren), 12,592 grandchildren, 9,498 brothers or sisters, 7,337 parents, 783 foster children, 13,421 other relatives, 22,723 non-relatives
- In group quarters: 14,175
Size of family households: 46,361 2-persons, 29,778 3-persons, 19,604 4-persons, 10,980 5-persons, 3,269 6-persons, 4,004 7-or-more-persons.
Size of nonfamily households: 95,183 1-person, 20,543 2-persons, 3,401 3-persons, 613 4-persons, 118 5-persons.
48,656 married couples with children.
72,923 single-parent households (14,993 men, 57,930 women).
78.5% of residents of Milwaukee speak English at home.
15.3% of residents speak Spanish at home (55% speak English very well, 16% speak English well, 21% speak English not well, 7% don't speak English at all).
1.6% of residents speak other Indo-European language at home (81% speak English very well, 11% speak English well, 7% speak English not well).
3.5% of residents speak Asian or Pacific Island language at home (55% speak English very well, 20% speak English well, 20% speak English not well, 5% don't speak English at all).
1.1% of residents speak other language at home (73% speak English very well, 15% speak English well, 8% speak English not well, 5% don't speak English at all).
Foreign born population: 62,833 (11.2%)
(38.5% of them are naturalized citizens)
| Here: | 5.8 |
| State: | 6.5 |
| Here: | 4.2 |
| State: | 4.1 |
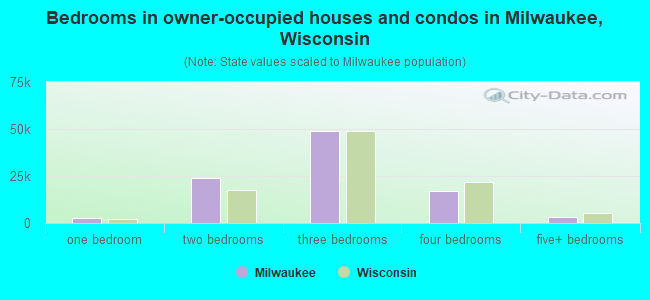
- Bedrooms in owner-occupied houses and condos in Milwaukee, Wisconsin
- 325no bedroom
- 2,7551 bedroom
- 23,7682 bedrooms
- 48,8303 bedrooms
- 16,9214 bedrooms
- 3,3835+ bedrooms
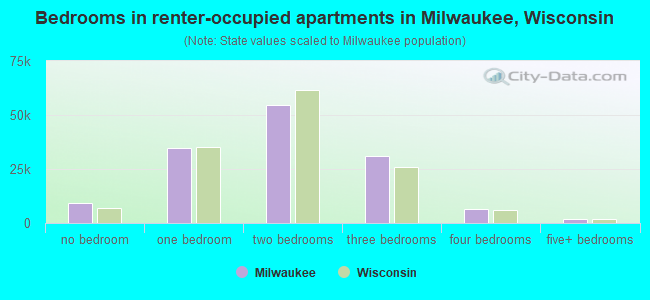
- Bedrooms in renter-occupied apartments in Milwaukee, Wisconsin
- 9,187no bedroom
- 34,7041 bedroom
- 54,6632 bedrooms
- 30,8123 bedrooms
- 6,6794 bedrooms
- 1,8275+ bedrooms
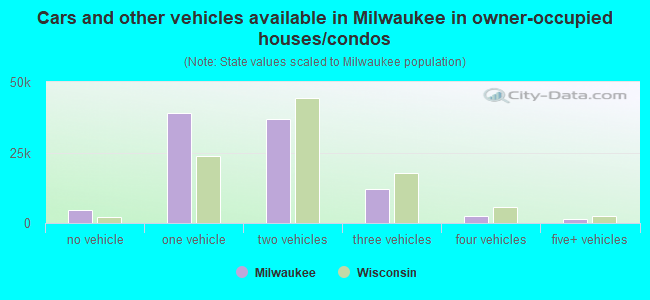
- Cars and other vehicles available in Milwaukee in owner-occupied houses/condos
- 4,522no vehicle
- 38,8741 vehicle
- 36,9452 vehicles
- 11,8883 vehicles
- 2,5074 vehicles
- 1,2465+ vehicles
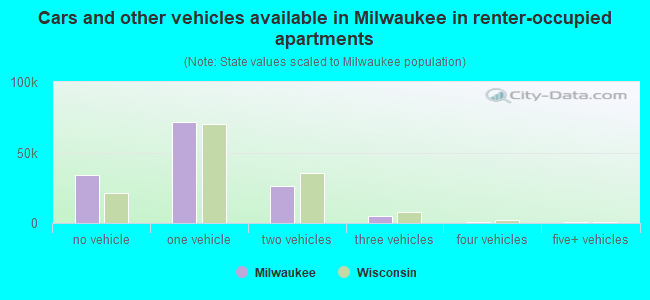
- Cars and other vehicles available in Milwaukee in renter-occupied apartments
- 33,976no vehicle
- 71,7991 vehicle
- 26,1632 vehicles
- 4,7723 vehicles
- 6274 vehicles
- 5355+ vehicles
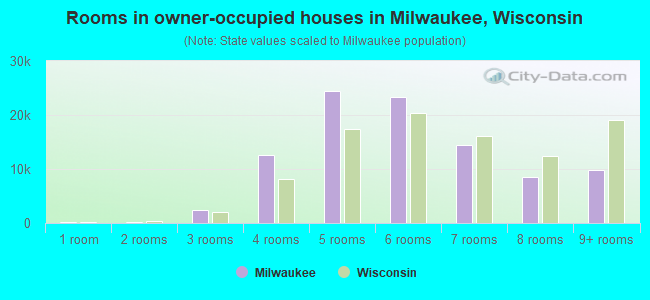
- Rooms in owner-occupied houses in Milwaukee, Wisconsin
- 2381 room
- 1632 rooms
- 2,3683 rooms
- 12,6804 rooms
- 24,4255 rooms
- 23,3606 rooms
- 14,3557 rooms
- 8,5288 rooms
- 9,8659+ rooms
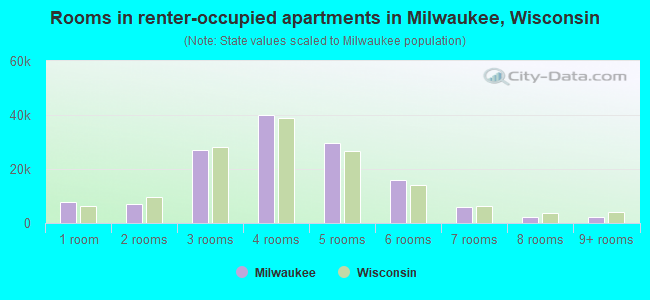
- Rooms in renter-occupied apartments in Milwaukee, Wisconsin
- 7,6371 room
- 6,9792 rooms
- 27,0483 rooms
- 40,1424 rooms
- 29,7735 rooms
- 15,9866 rooms
- 5,8597 rooms
- 2,4038 rooms
- 2,0459+ rooms
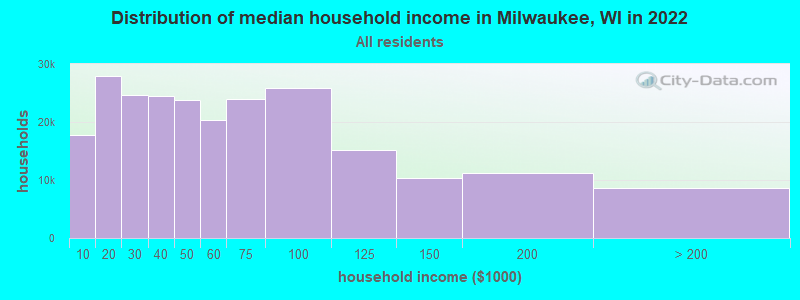
Milwaukee, WI household income distribution

- 17,677Less than $10,000
- 27,848$10,000 to $19,999
- 24,598$20,000 to $29,999
- 24,414$30,000 to $39,999
- 23,729$40,000 to $49,999
- 20,370$50,000 to $59,999
- 23,971$60,000 to $74,999
- 25,811$75,000 to $99,999
- 15,201$100,000 to $124,999
- 10,321$125,000 to $149,999
- 11,219$150,000 to $199,999
- 8,695$200,000 or more
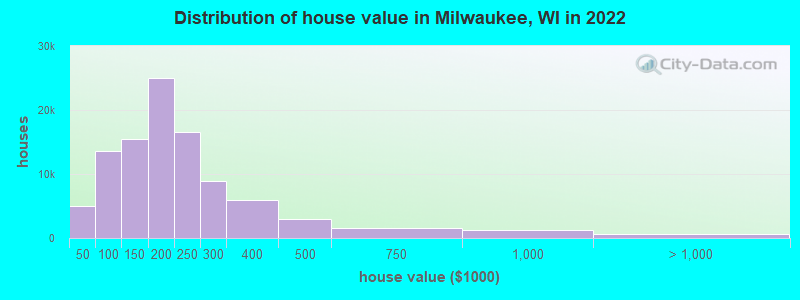
Home value of owner - occupied houses in 2022 in Milwaukee, WI
-
- 1,152Less than $10,000
- 379$10,000 to $14,999
- 653$15,000 to $19,999
- 649$20,000 to $24,999
- 280$25,000 to $29,999
- 632$30,000 to $34,999
- 362$35,000 to $39,999
- 911$40,000 to $49,999
- 1,603$50,000 to $59,999
- 1,769$60,000 to $69,999
- 3,222$70,000 to $79,999
- 2,902$80,000 to $89,999
- 3,115$90,000 to $99,999
- 7,688$100,000 to $124,999
- 7,834$125,000 to $149,999
- 15,081$150,000 to $174,999
- 9,915$175,000 to $199,999
- 16,521$200,000 to $249,999
- 8,856$250,000 to $299,999
- 6,015$300,000 to $399,999
- 3,015$400,000 to $499,999
- 1,507$500,000 to $749,999
- 1,233$750,000 to $999,999
- 615$1,000,000 to $1,499,999
- 73$2,000,000 or more
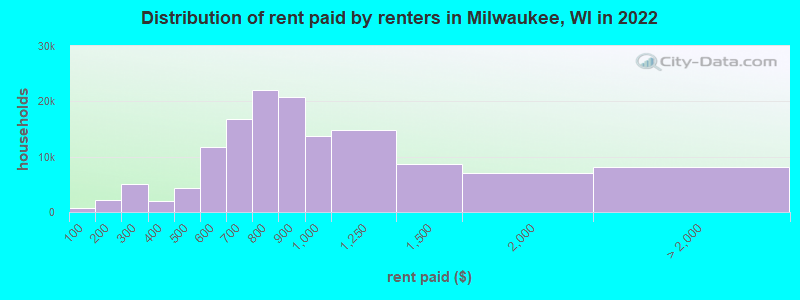
Rent paid by renters in 2022 in Milwaukee, WI
-
- 656Less than $100
- 684$100 to $149
- 1,413$150 to $199
- 2,630$200 to $249
- 2,502$250 to $299
- 988$300 to $349
- 960$350 to $399
- 1,980$400 to $449
- 2,307$450 to $499
- 6,481$500 to $549
- 5,207$550 to $599
- 7,659$600 to $649
- 9,156$650 to $699
- 11,189$700 to $749
- 10,887$750 to $799
- 20,815$800 to $899
- 13,694$900 to $999
- 14,900$1,000 to $1,249
- 8,598$1,250 to $1,499
- 7,103$1,500 to $1,999
- 2,555$2,000 to $2,499
- 903$2,500 to $2,999
- 383$3,000 to $3,499
- 726$3,500 or more
- 3,496No cash rent

Percentage of workers working in this county: 81.4%
Number of people working at home: 32,590 (12.1% of all workers)

Travel time to work (commute)
- Less than 5 minutes: 4,899
- 5 to 9 minutes: 20,757
- 10 to 14 minutes: 38,649
- 15 to 19 minutes: 50,454
- 20 to 24 minutes: 44,382
- 25 to 29 minutes: 18,929
- 30 to 34 minutes: 32,385
- 35 to 39 minutes: 4,534
- 40 to 44 minutes: 4,786
- 45 to 59 minutes: 8,309
- 60 to 89 minutes: 5,739
- 90 or more minutes: 3,228

Means of transportation to work:
- Drove a car alone: 188,421 (69.7%)
- Carpooled: 25,311 (9.4%)
- Bus: 7,446 (2.8%)
- Long-distance train or commuter rail: 74 (0.0%)
- Light rail, streetcar or trolley: 202 (0.1%)
- Taxi: 3,352 (1.2%)
- Bicycle: 1,738 (0.6%)
- Walked: 11,344 (4.2%)
- Worked at home: 32,590 (12.0%)
- Unemployment by race in 2022
- Unemployment rate for White non-Hispanic residents
- 2.2%Males
- 1.6%Females
- Unemployment rate for Black residents
- 8.9%Males
- 9.6%Females
- Unemployment rate for American Indian and Alaska Native residents
- 1.7%Males
- 2.1%Females
- Unemployment rate for Asian residents
- 3.6%Males
- 2.3%Females
- Unemployment rate for other race residents
- 5.8%Males
- 3.8%Females
- Unemployment rate for two or more race residents
- 5.3%Males
- 4.3%Females
- Unemployment rate for Hispanic or Latino residents
- 3.9%Males
- 3.7%Females
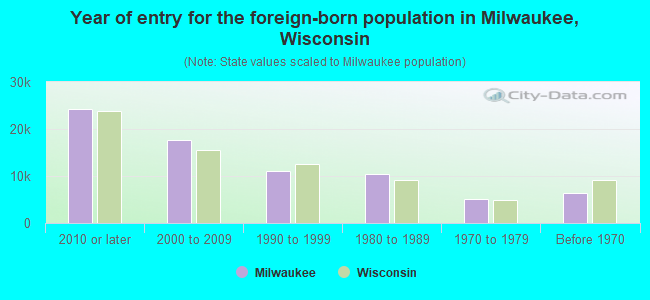
- Year of entry for the foreign-born population in Milwaukee, Wisconsin
- 24,1862010 or later
- 17,6592000 to 2009
- 10,9811990 to 1999
- 10,4861980 to 1989
- 5,1091970 to 1979
- 6,454Before 1970
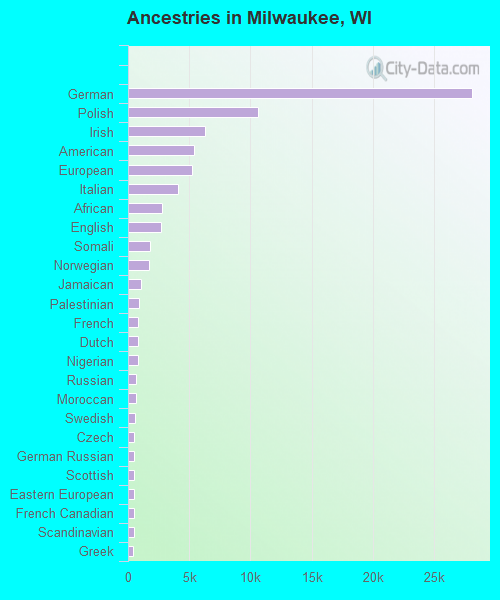
First ancestries reported:
- German: 28,090 (7.5%)
- Polish: 10,654 (2.9%)
- Irish: 6,270 (1.7%)
- American: 5,418 (1.5%)
- European: 5,239 (1.4%)
- Italian: 4,071 (1.1%)
- African: 2,751 (0.7%)
- English: 2,725 (0.7%)
- Somali: 1,821 (0.5%)
- Norwegian: 1,713 (0.5%)
- Jamaican: 1,075 (0.3%)
- Palestinian: 879 (0.2%)
- French: 823 (0.2%)
- Dutch: 808 (0.2%)
- Nigerian: 793 (0.2%)
- Russian: 675 (0.2%)
- Moroccan: 626 (0.2%)
- Swedish: 566 (0.2%)
- Czech: 526 (0.1%)
- German Russian: 514 (0.1%)
- Scottish: 474 (0.1%)
- Eastern European: 467 (0.1%)
- French Canadian: 464 (0.1%)
- Scandinavian: 463 (0.1%)
- Greek: 435 (0.1%)
- Arab: 369 (0.10%)
- Serbian: 364 (0.10%)
- Iraqi: 351 (0.09%)
- Danish: 342 (0.09%)
- Hungarian: 335 (0.09%)
- Croatian: 310 (0.08%)
- Slovene: 288 (0.08%)
- Scotch-Irish: 275 (0.07%)
- Belgian: 269 (0.07%)
- British: 268 (0.07%)
- West Indian: 266 (0.07%)
- Ukrainian: 264 (0.07%)
- Syrian: 252 (0.07%)
- Iranian: 237 (0.06%)
- Finnish: 211 (0.06%)
- Austrian: 166 (0.04%)
- Lithuanian: 160 (0.04%)
- Ethiopian: 160 (0.04%)
- Romanian: 157 (0.04%)
- Ghanaian: 142 (0.04%)
- Yugoslavian: 124 (0.03%)
- Slovak: 121 (0.03%)
- Swiss: 116 (0.03%)
- Canadian: 114 (0.03%)
- Haitian: 99 (0.03%)
- Northern European: 94 (0.03%)
- Czechoslovakian: 79 (0.02%)
- Kenyan: 75 (0.02%)
- Latvian: 71 (0.02%)
- Egyptian: 62 (0.02%)
- Jordanian: 57 (0.02%)
- Macedonian: 54 (0.01%)
- Albanian: 54 (0.01%)
- Lebanese: 53 (0.01%)
- Slavic: 42 (0.01%)
- Bulgarian: 41 (0.01%)
- Welsh: 40 (0.01%)
- South African: 39 (0.01%)
- Sierra Leonean: 37 (0.01%)
- Ugandan: 37 (0.01%)
- Armenian: 34 (0.01%)
- Senegalese: 32 (0.01%)
- Turkish: 30 (0.01%)
- Belizean: 26 (0.01%)
- Luxembourger: 22 (0.01%)
- Icelander: 21 (0.01%)
- Cajun: 21 (0.01%)
Most common places of birth for foreign-born residents (%):
| Milwaukee: | 45.5% (26,946) |
| Wisconsin: | 29.5% (87,182) |
| Milwaukee: | 6.8% (4,016) |
| Wisconsin: | 1.4% (4,016) |
| Milwaukee: | 4.2% (2,478) |
| Wisconsin: | 3.3% (9,655) |
| Milwaukee: | 3.2% (1,901) |
| Wisconsin: | 4.3% (12,681) |
| Milwaukee: | 2.8% (1,638) |
| Wisconsin: | 8.0% (23,594) |
| Milwaukee: | 2.1% (1,242) |
| Wisconsin: | 1.1% (3,231) |
| Milwaukee: | 2.0% (1,186) |
| Wisconsin: | 0.5% (1,537) |
| Milwaukee: | 1.9% (1,150) |
| Wisconsin: | 5.1% (15,165) |
| Milwaukee: | 1.7% (994) |
| Wisconsin: | 0.3% (933) |
| Milwaukee: | 1.6% (942) |
| Wisconsin: | 0.5% (1,621) |
Place of birth for U.S.-born residents:
- This state: 362,819
- Other state: 124,068
- Northeast: 9,212
- Midwest: 61,650
- South: 39,611
- West: 13,595
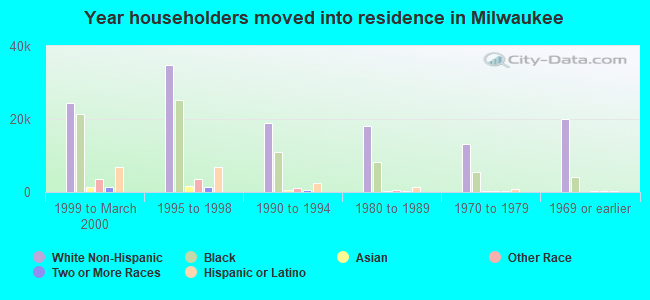
84.6% of Milwaukee residents lived in the same house 1 years ago.
Out of people who lived in different houses, 41.5% lived in this county.
Out of people who lived in different counties, 47.7% lived in Wisconsin.
| Milwaukee: | 84.6% |
| State average: | 87.7% |
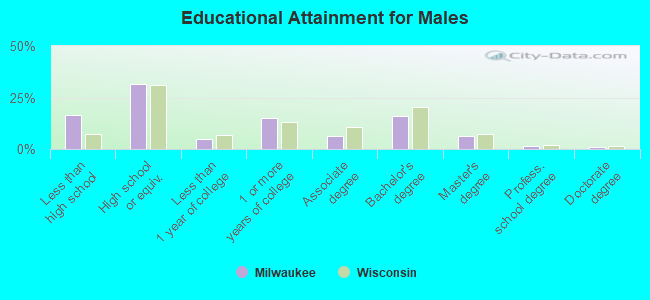
Education attainment for males 25 years and older:
- No schooling: 4,538
- Nursery to 4th grade: 1,962
- 5th and 6th grade: 3,308
- 7th and 8th grade: 2,795
- 9th grade: 2,764
- 10th grade: 2,598
- 11th grade: 6,026
- 12th grade, no diploma: 4,070
- High school graduate (or equivalency): 54,063
- Less than 1 year of college: 8,623
- Some college more than 1 year, no degree: 25,889
- Associate degree: 11,135
- Bachelor's degree: 27,571
- Master's degree: 10,441
- Professional school degree: 2,429
- Doctorate degree: 1,917
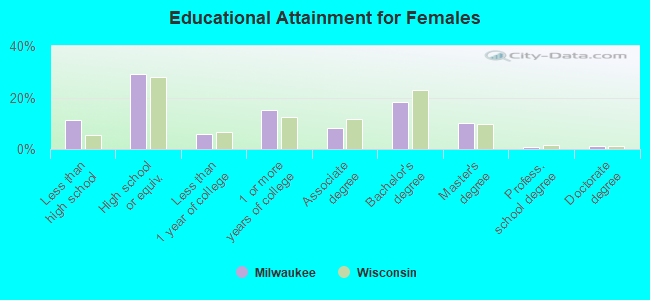
Education attainment for females 25 years and older:
- No schooling: 5,493
- Nursery to 4th grade: 674
- 5th and 6th grade: 1,622
- 7th and 8th grade: 1,306
- 9th grade: 1,983
- 10th grade: 3,036
- 11th grade: 4,038
- 12th grade, no diploma: 2,726
- High school graduate (or equivalency): 54,695
- Less than 1 year of college: 11,225
- Some college more than 1 year, no degree: 28,419
- Associate degree: 15,187
- Bachelor's degree: 34,002
- Master's degree: 18,665
- Professional school degree: 1,746
- Doctorate degree: 2,034
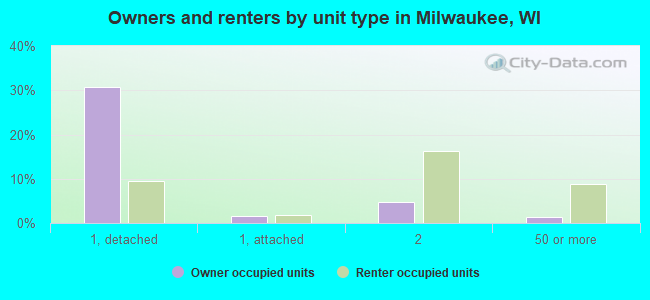
Housing units in structures:
- One, detached: 100,625
- One, attached: 10,695
- Two: 56,153
- 3 or 4: 19,176
- 5 to 9: 16,523
- 10 to 19: 9,281
- 20 to 49: 19,079
- 50 or more: 28,485
- Mobile homes: 1,111
- Boats, RVs, vans, etc.: 95
Median worth of mobile homes: $16,700
Housing units lacking complete kitchen facilities in 2022: 3.8%
House/condo owner moved in on average 13 years ago
Renter moved in on average 2 years ago
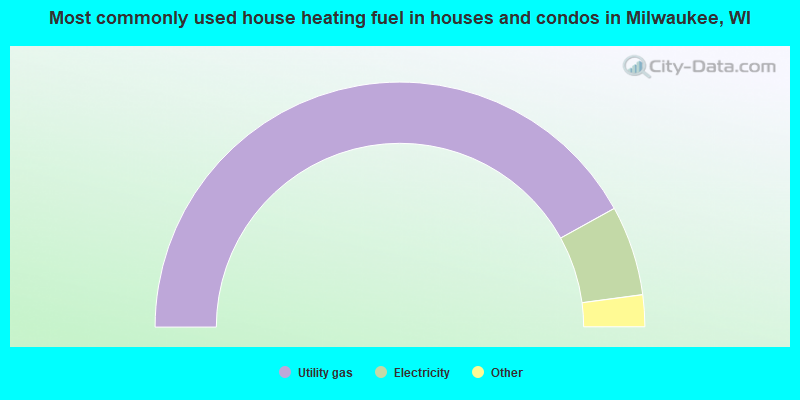
- 84.0%Utility gas
- 11.9%Electricity
- 1.6%Bottled, tank, or LP gas
- 1.0%No fuel used
- 0.8%Fuel oil, kerosene, etc.
- 0.4%Other fuel
- 0.2%Wood
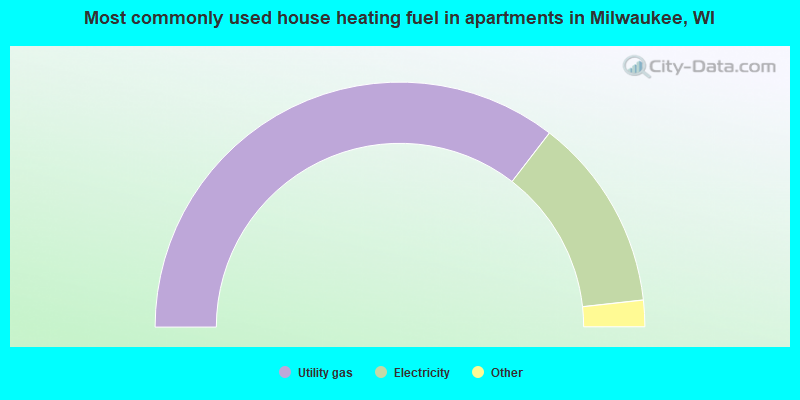
- 70.9%Utility gas
- 25.6%Electricity
- 1.2%Bottled, tank, or LP gas
- 1.1%Other fuel
- 0.9%No fuel used
- 0.2%Fuel oil, kerosene, etc.
- 0.1%Solar energy
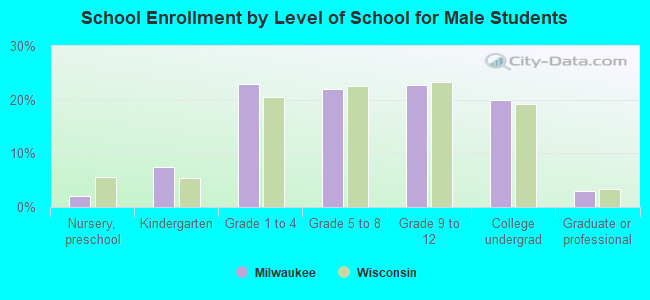
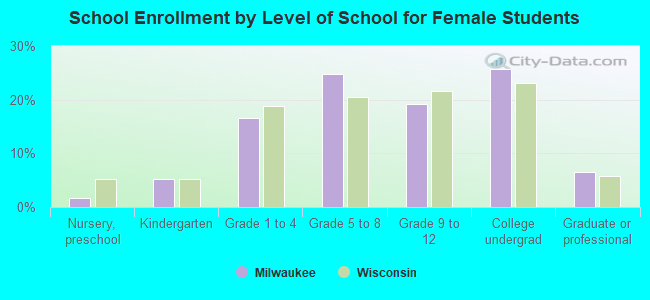
Private vs. public school enrollment:
| Here: | 25.4% |
| Wisconsin: | 16.7% |
| Here: | 27.2% |
| Wisconsin: | 12.5% |
| Here: | 34.5% |
| Wisconsin: | 17.5% |