Races in Milwaukee, Wisconsin (WI) Detailed Stats
Data:
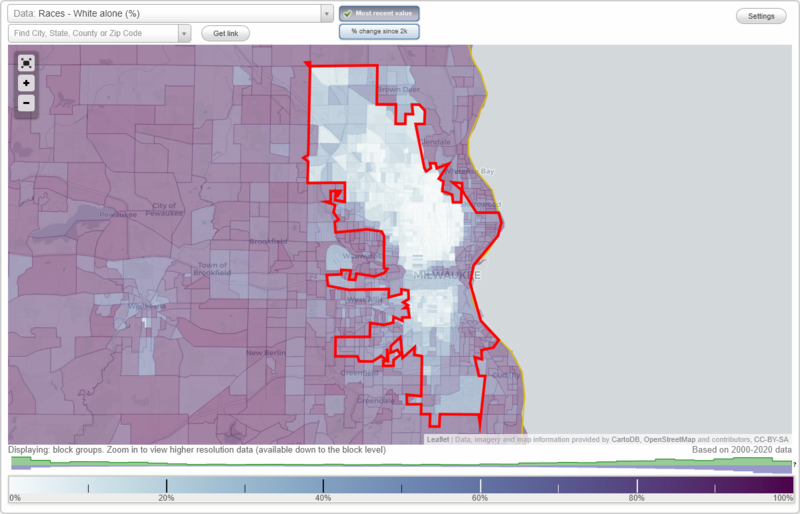
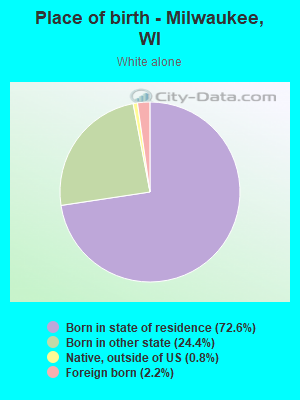
Races - White alone (%)
Races - White alone (% change since 2000)
Races - Black alone (%)
Races - Black alone (% change since 2000)
Races - American Indian alone (%)
Races - American Indian alone (% change since 2000)
Races - Asian alone (%)
Races - Asian alone (% change since 2000)
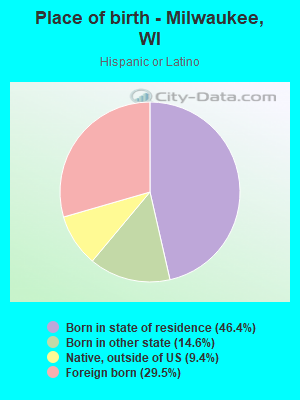
Races - Hispanic (%)
Races - Hispanic (% change since 2000)
Races - Native Hawaiian and Other Pacific Islander alone (%)
Races - Native Hawaiian and Other Pacific Islander alone (% change since 2000)
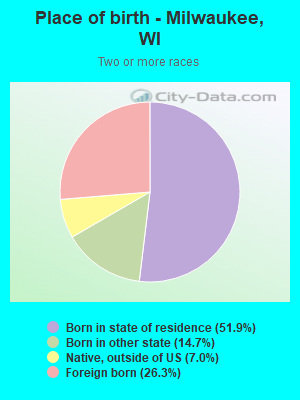
Races - Two or more races(%)
Races - Two or more races(% change since 2000)
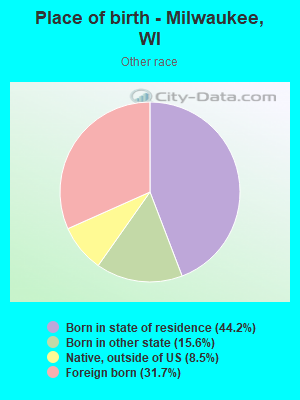
Races - Other race alone (%)
Races - Other race alone (% change since 2000)
Racial diversity
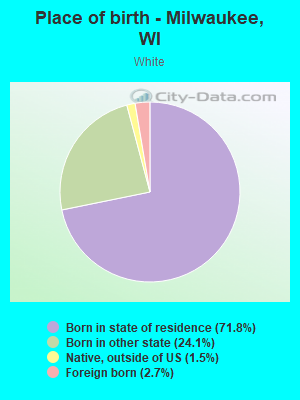
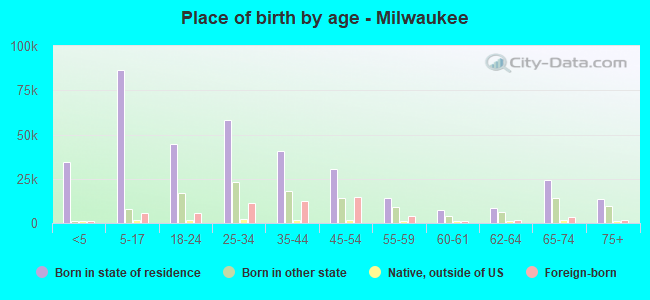
Place of birth - Born in state of residence (%)
Place of birth - Born in state of residence (%) - White
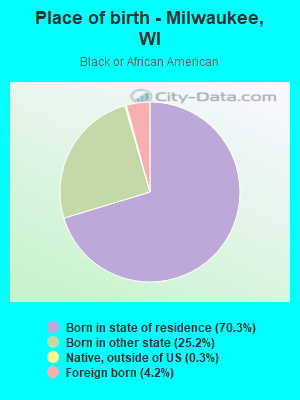
Place of birth - Born in state of residence (%) - Black or African American
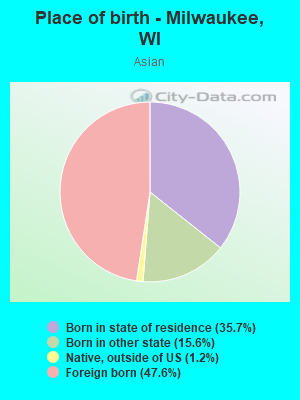
Place of birth - Born in state of residence (%) - Asian
Place of birth - Born in state of residence (%) - Hispanic or Latino
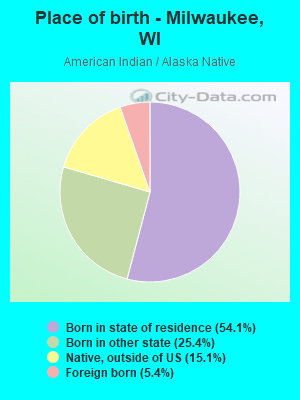
Place of birth - Born in state of residence (%) - American Indian and Alaska Native
Place of birth - Born in state of residence (%) - Multirace
Place of birth - Born in state of residence (%) - Other Race
Place of birth - Born in other state (%)
Place of birth - Born in other state (%) - White
Place of birth - Born in other state (%) - Black or African American
Place of birth - Born in other state (%) - Asian
Place of birth - Born in other state (%) - Hispanic or Latino
Place of birth - Born in other state (%) - American Indian and Alaska Native
Place of birth - Born in other state (%) - Multirace
Place of birth - Born in other state (%) - Other Race
Place of birth - Native, outside of US (%)
Place of birth - Native, outside of US (%) - White
Place of birth - Native, outside of US (%) - Black or African American
Place of birth - Native, outside of US (%) - Asian
Place of birth - Native, outside of US (%) - Hispanic or Latino
Place of birth - Native, outside of US (%) - American Indian and Alaska Native
Place of birth - Native, outside of US (%) - Multirace
Place of birth - Native, outside of US (%) - Other Race
Place of birth - Foreign born (%)
Place of birth - Foreign born (%) - White
Place of birth - Foreign born (%) - Black or African American
Place of birth - Foreign born (%) - Asian
Place of birth - Foreign born (%) - Hispanic or Latino
Place of birth - Foreign born (%) - American Indian and Alaska Native
Place of birth - Foreign born (%) - Multirace
Place of birth - Foreign born (%) - Other Race
Residents speaking English at home (%)
Residents speaking English at home - Born in the United States (%)
Residents speaking English at home - Native, born elsewhere (%)
Residents speaking English at home - Foreign born (%)
Residents speaking Spanish at home (%)
Residents speaking Spanish at home - Born in the United States (%)
Residents speaking Spanish at home - Native, born elsewhere (%)
Residents speaking Spanish at home - Foreign born (%)
Residents speaking other language at home (%)
Residents speaking other language at home - Born in the United States (%)
Residents speaking other language at home - Native, born elsewhere (%)
Residents speaking other language at home - Foreign born (%)
Marital status - Never married (%)
Marital status - Now married (%)
Marital status - Separated (%)
Marital status - Widowed (%)
Marital status - Divorced (%)
Ancestries Reported - Arab (%)
Ancestries Reported - Czech (%)
Ancestries Reported - Danish (%)
Ancestries Reported - Dutch (%)
Ancestries Reported - English (%)
Ancestries Reported - French (%)
Ancestries Reported - French Canadian (%)
Ancestries Reported - German (%)
Ancestries Reported - Greek (%)
Ancestries Reported - Hungarian (%)
Ancestries Reported - Irish (%)
Ancestries Reported - Italian (%)
Ancestries Reported - Lithuanian (%)
Ancestries Reported - Norwegian (%)
Ancestries Reported - Polish (%)
Ancestries Reported - Portuguese (%)
Ancestries Reported - Russian (%)
Ancestries Reported - Scotch-Irish (%)
Ancestries Reported - Scottish (%)
Ancestries Reported - Slovak (%)
Ancestries Reported - Subsaharan African (%)
Ancestries Reported - Swedish (%)
Ancestries Reported - Swiss (%)
Ancestries Reported - Ukrainian (%)
Ancestries Reported - United States (%)
Ancestries Reported - Welsh (%)
Ancestries Reported - West Indian (%)
Ancestries Reported - Other (%)
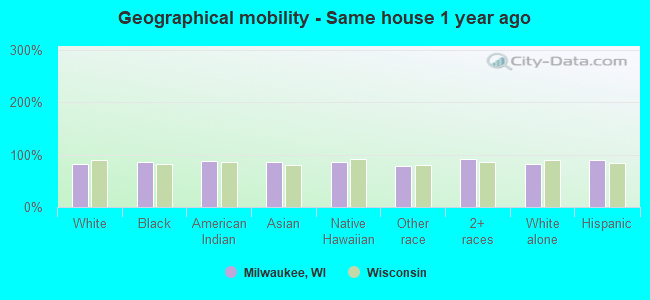
Geographical mobility - Same house 1 year ago (%)
Geographical mobility - Same house 1 year ago (%) - White
Geographical mobility - Same house 1 year ago (%) - Black or African American
Geographical mobility - Same house 1 year ago (%) - Asian
Geographical mobility - Same house 1 year ago (%) - Hispanic or Latino
Geographical mobility - Same house 1 year ago (%) - American Indian and Alaska Native
Geographical mobility - Same house 1 year ago (%) - Multirace
Geographical mobility - Same house 1 year ago (%) - Other Race
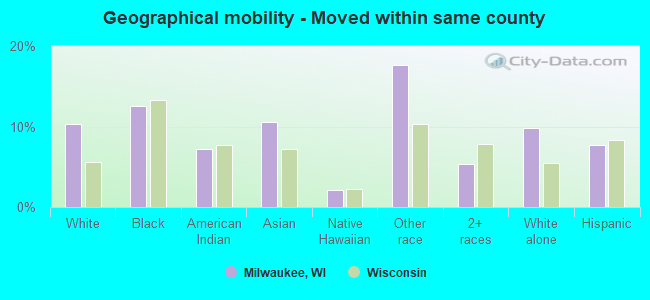
Geographical mobility - Moved within same county (%)
Geographical mobility - Moved within same county (%) - White
Geographical mobility - Moved within same county (%) - Black or African American
Geographical mobility - Moved within same county (%) - Asian
Geographical mobility - Moved within same county (%) - Hispanic or Latino
Geographical mobility - Moved within same county (%) - American Indian and Alaska Native
Geographical mobility - Moved within same county (%) - Multirace
Geographical mobility - Moved within same county (%) - Other Race
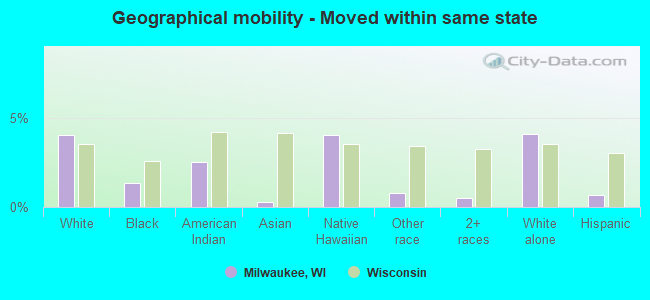
Geographical mobility - Moved from different county within same state (%)
Geographical mobility - Moved from different county within same state (%) - White
Geographical mobility - Moved from different county within same state (%) - Black or African American
Geographical mobility - Moved from different county within same state (%) - Asian
Geographical mobility - Moved from different county within same state (%) - Hispanic or Latino
Geographical mobility - Moved from different county within same state (%) - American Indian and Alaska Native
Geographical mobility - Moved from different county within same state (%) - Multirace
Geographical mobility - Moved from different county within same state (%) - Other Race
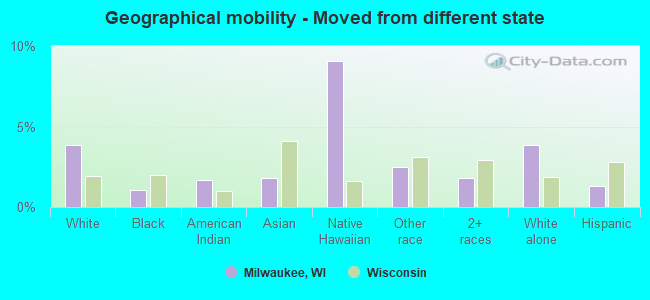
Geographical mobility - Moved from different state (%)
Geographical mobility - Moved from different state (%) - White
Geographical mobility - Moved from different state (%) - Black or African American
Geographical mobility - Moved from different state (%) - Asian
Geographical mobility - Moved from different state (%) - Hispanic or Latino
Geographical mobility - Moved from different state (%) - American Indian and Alaska Native
Geographical mobility - Moved from different state (%) - Multirace
Geographical mobility - Moved from different state (%) - Other Race
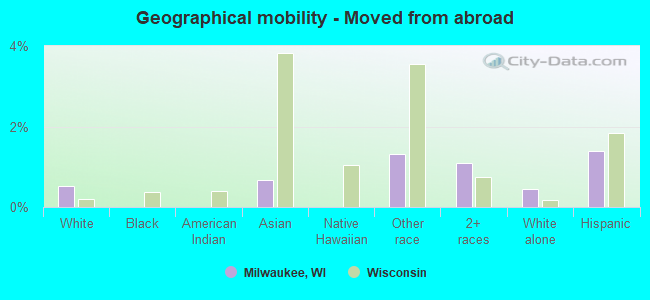
Geographical mobility - Moved from abroad (%)
Geographical mobility - Moved from abroad (%) - White
Geographical mobility - Moved from abroad (%) - Black or African American
Geographical mobility - Moved from abroad (%) - Asian
Geographical mobility - Moved from abroad (%) - Hispanic or Latino
Geographical mobility - Moved from abroad (%) - American Indian and Alaska Native
Geographical mobility - Moved from abroad (%) - Multirace
Geographical mobility - Moved from abroad (%) - Other Race
Place of birth for the foreign-born population - Ireland (%)
Place of birth for the foreign-born population - Denmark (%)
Place of birth for the foreign-born population - Norway (%)
Place of birth for the foreign-born population - Sweden (%)
Place of birth for the foreign-born population - United Kingdom (%)
Place of birth for the foreign-born population - England (%)
Place of birth for the foreign-born population - Scotland (%)
Place of birth for the foreign-born population - Other Northern Europe (%)
Place of birth for the foreign-born population - Austria (%)
Place of birth for the foreign-born population - Belgium (%)
Place of birth for the foreign-born population - France (%)
Place of birth for the foreign-born population - Germany (%)
Place of birth for the foreign-born population - Netherlands (%)
Place of birth for the foreign-born population - Switzerland (%)
Place of birth for the foreign-born population - Other Western Europe (%)
Place of birth for the foreign-born population - Greece (%)
Place of birth for the foreign-born population - Italy (%)
Place of birth for the foreign-born population - Portugal (%)
Place of birth for the foreign-born population - Spain (%)
Place of birth for the foreign-born population - Other Southern Europe (%)
Place of birth for the foreign-born population - Albania (%)
Place of birth for the foreign-born population - Belarus (%)
Place of birth for the foreign-born population - Bosnia and Herzegovina (%)
Place of birth for the foreign-born population - Bulgaria (%)
Place of birth for the foreign-born population - Croatia (%)
Place of birth for the foreign-born population - Czechoslovakia (%)
Place of birth for the foreign-born population - Hungary (%)
Place of birth for the foreign-born population - Latvia (%)
Place of birth for the foreign-born population - Lithuania (%)
Place of birth for the foreign-born population - North Macedonia (Macedonia) (%)
Place of birth for the foreign-born population - Moldova (%)
Place of birth for the foreign-born population - Poland (%)
Place of birth for the foreign-born population - Romania (%)
Place of birth for the foreign-born population - Russia (%)
Place of birth for the foreign-born population - Serbia (%)
Place of birth for the foreign-born population - Ukraine (%)
Place of birth for the foreign-born population - Other Eastern Europe (%)
Place of birth for the foreign-born population - China (%)
Place of birth for the foreign-born population - Hong Kong (%)
Place of birth for the foreign-born population - Taiwan (%)
Place of birth for the foreign-born population - Japan (%)
Place of birth for the foreign-born population - Korea (%)
Place of birth for the foreign-born population - Other Eastern Asia (%)
Place of birth for the foreign-born population - Afghanistan (%)
Place of birth for the foreign-born population - Bangladesh (%)
Place of birth for the foreign-born population - India (%)
Place of birth for the foreign-born population - Iran (%)
Place of birth for the foreign-born population - Kazakhstan (%)
Place of birth for the foreign-born population - Nepal (%)
Place of birth for the foreign-born population - Pakistan (%)
Place of birth for the foreign-born population - Sri Lanka (%)
Place of birth for the foreign-born population - Uzbekistan (%)
Place of birth for the foreign-born population - Other South Central Asia (%)
Place of birth for the foreign-born population - Burma (%)
Place of birth for the foreign-born population - Cambodia (%)
Place of birth for the foreign-born population - Indonesia (%)
Place of birth for the foreign-born population - Laos (%)
Place of birth for the foreign-born population - Malaysia (%)
Place of birth for the foreign-born population - Philippines (%)
Place of birth for the foreign-born population - Singapore (%)
Place of birth for the foreign-born population - Thailand (%)
Place of birth for the foreign-born population - Vietnam (%)
Place of birth for the foreign-born population - Other South Eastern Asia (%)
Place of birth for the foreign-born population - Armenia (%)
Place of birth for the foreign-born population - Iraq (%)
Place of birth for the foreign-born population - Israel (%)
Place of birth for the foreign-born population - Jordan (%)
Place of birth for the foreign-born population - Kuwait (%)
Place of birth for the foreign-born population - Lebanon (%)
Place of birth for the foreign-born population - Saudi Arabia (%)
Place of birth for the foreign-born population - Syria (%)
Place of birth for the foreign-born population - Turkey (%)
Place of birth for the foreign-born population - Yemen (%)
Place of birth for the foreign-born population - Other Western Asia (%)
Place of birth for the foreign-born population - Eritrea (%)
Place of birth for the foreign-born population - Ethiopia (%)
Place of birth for the foreign-born population - Kenya (%)
Place of birth for the foreign-born population - Somalia (%)
Place of birth for the foreign-born population - Uganda (%)
Place of birth for the foreign-born population - Zimbabwe (%)
Place of birth for the foreign-born population - Other Eastern Africa (%)
Place of birth for the foreign-born population - Cameroon (%)
Place of birth for the foreign-born population - Congo (%)
Place of birth for the foreign-born population - Democratic Republic of Congo (Zaire) (%)
Place of birth for the foreign-born population - Other Middle Africa (%)
Place of birth for the foreign-born population - Egypt (%)
Place of birth for the foreign-born population - Morocco (%)
Place of birth for the foreign-born population - Sudan (%)
Place of birth for the foreign-born population - Other Northern Africa (%)
Place of birth for the foreign-born population - South Africa (%)
Place of birth for the foreign-born population - Other Southern Africa (%)
Place of birth for the foreign-born population - Cabo Verde (%)
Place of birth for the foreign-born population - Ghana (%)
Place of birth for the foreign-born population - Liberia (%)
Place of birth for the foreign-born population - Nigeria (%)
Place of birth for the foreign-born population - Senegal (%)
Place of birth for the foreign-born population - Sierra Leone (%)
Place of birth for the foreign-born population - Other Western Africa (%)
Place of birth for the foreign-born population - Australia (%)
Place of birth for the foreign-born population - New Zealand (%)
Place of birth for the foreign-born population - Fiji (%)
Place of birth for the foreign-born population - Micronesia (%)
Place of birth for the foreign-born population - Bahamas (%)
Place of birth for the foreign-born population - Barbados (%)
Place of birth for the foreign-born population - Cuba (%)
Place of birth for the foreign-born population - Dominica (%)
Place of birth for the foreign-born population - Dominican Republic (%)
Place of birth for the foreign-born population - Grenada (%)
Place of birth for the foreign-born population - Haiti (%)
Place of birth for the foreign-born population - Jamaica (%)
Place of birth for the foreign-born population - St. Vincent and the Grenadines (%)
Place of birth for the foreign-born population - Trinidad and Tobago (%)
Place of birth for the foreign-born population - West Indies (%)
Place of birth for the foreign-born population - Other Caribbean (%)
Place of birth for the foreign-born population - Belize (%)
Place of birth for the foreign-born population - Costa Rica (%)
Place of birth for the foreign-born population - El Salvador (%)
Place of birth for the foreign-born population - Guatemala (%)
Place of birth for the foreign-born population - Honduras (%)
Place of birth for the foreign-born population - Mexico (%)
Place of birth for the foreign-born population - Nicaragua (%)
Place of birth for the foreign-born population - Panama (%)
Place of birth for the foreign-born population - Other Central America (%)
Place of birth for the foreign-born population - Argentina (%)
Place of birth for the foreign-born population - Bolivia (%)
Place of birth for the foreign-born population - Brazil (%)
Place of birth for the foreign-born population - Chile (%)
Place of birth for the foreign-born population - Colombia (%)
Place of birth for the foreign-born population - Ecuador (%)
Place of birth for the foreign-born population - Guyana (%)
Place of birth for the foreign-born population - Peru (%)
Place of birth for the foreign-born population - Uruguay (%)
Place of birth for the foreign-born population - Venezuela (%)
Place of birth for the foreign-born population - Other South America (%)
Place of birth for the foreign-born population - Canada (%)
Place of birth for the foreign-born population - Other Northern America (%)
Place of birth for the foreign-born population - Other (%)
Latest news about races in Milwaukee, WI collected exclusively by city-data.com from local newspapers, TV, and radio stations
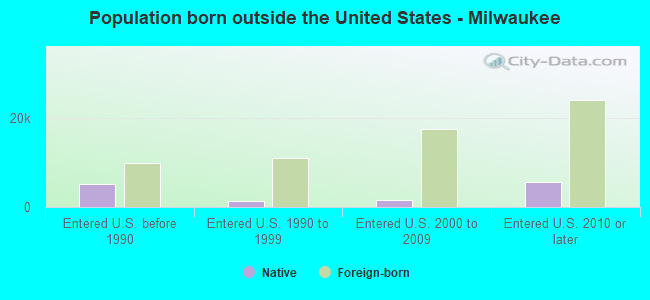
According to 2022 data, the most numerous races in Milwaukee, WI are White alone (180,956 residents), Hispanic (116,771 residents), and Black alone (207,255 residents). 78.5% of Milwaukee residents speak English at home. 10.5% of Milwaukee, WI residents are foreign-born (5.8% born in Latin America, 2.8% born in Asia), which is 52.3% greater than the foreign-born rate of 5.0% across the entire state of Wisconsin.
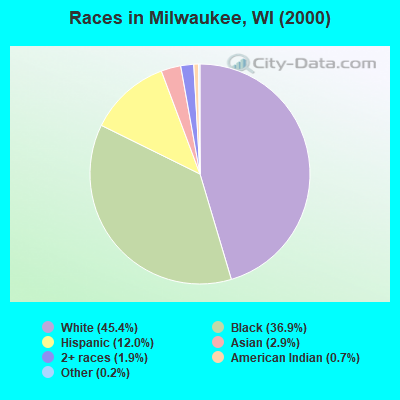
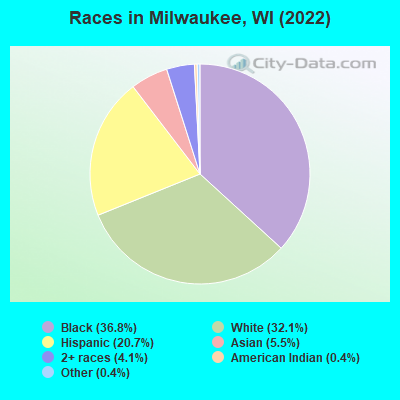
Race distribution in Milwaukee
2000 2022
270,989 45.4% White alone 220,432 36.9% Black alone 71,646 12.0% Hispanic 17,339 2.9% Asian alone 11,055 1.9% Two or more races 4,313 0.7% American Indian alone 978 0.2% Other race alone 222 0.04% Native Hawaiian and Other
207,255 36.8% Black alone 180,956 32.1% White alone 116,771 20.7% Hispanic 31,007 5.5% Asian alone 22,984 4.1% Two or more races 2,206 0.4% American Indian alone 2,003 0.4% Other race alone 124 0.02% Native Hawaiian and Other
2000 2022
4,681,630 87.3% White alone 300,245 5.6% Black alone 192,921 3.6% Hispanic 87,995 1.6% Asian alone 51,921 1.0% Two or more races 43,980 0.8% American Indian alone 3,637 0.07% Other race alone 1,346 0.03% Native Hawaiian and Other
4,654,031 79.0% White alone 447,022 7.6% Hispanic 345,678 5.9% Black alone 217,532 3.7% Two or more races 172,242 2.9% Asian alone 33,762 0.6% American Indian alone 19,680 0.3% Other race alone 2,592 0.04% Native Hawaiian and Other
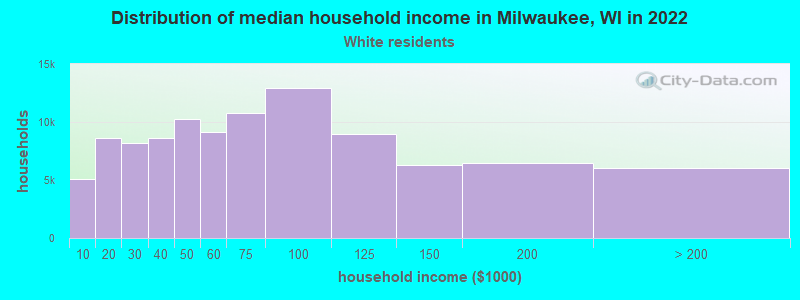
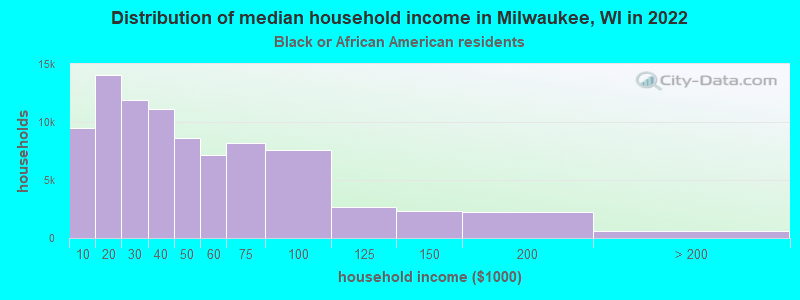
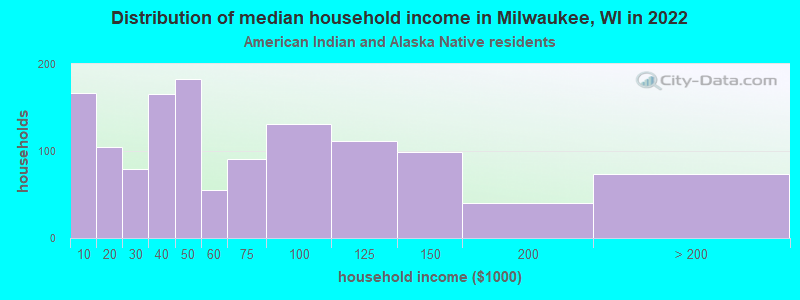
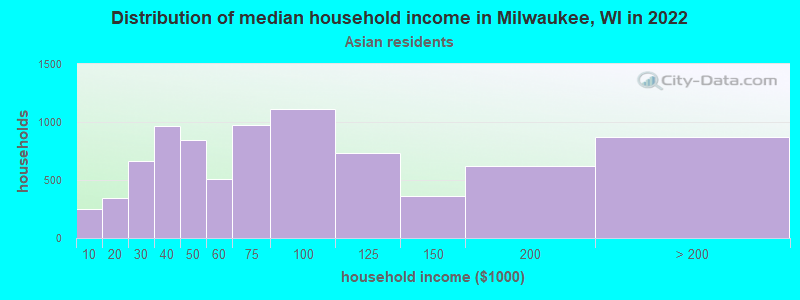
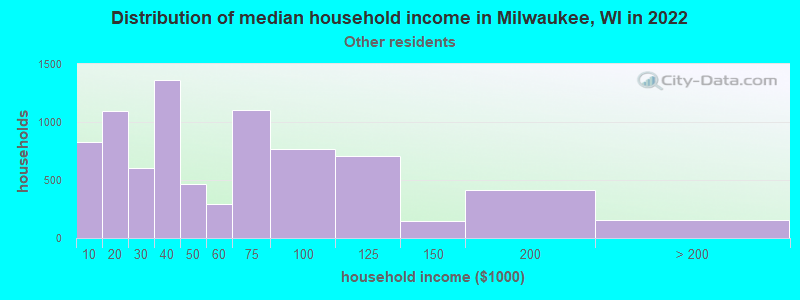
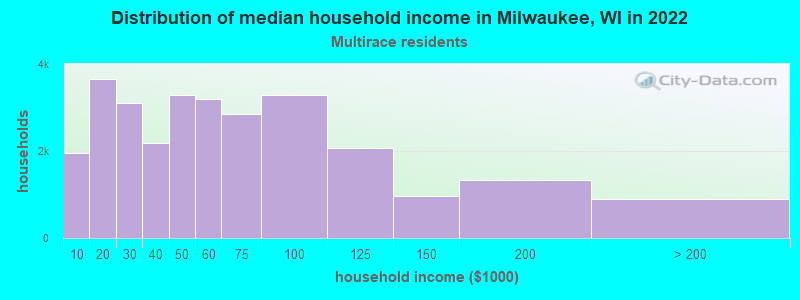
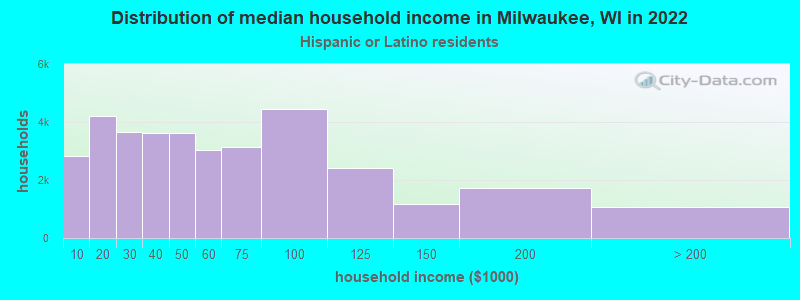
Income and house value in Milwaukee Median household income in 2022 $60,855 White non-Hispanic householders$36,700 Black householders$48,927 American Indian and Alaska Native householders$69,127 Asian householders$42,284 Some other race householders$51,293 Two or more races householders$47,421 Hispanic or Latino race householdersMedian 2022 house value $193,025 White Non-Hispanic householders$121,737 Black or African American householders$177,012 American Indian or Alaska Native householders $154,639 Asian householders$285,150 Native Hawaiian and other Pacific Islander householders$138,188 Some other race householders$157,052 Two or more races householders$143,452 Hispanic or Latino householders
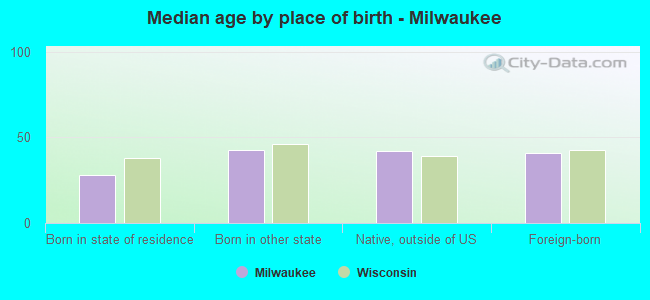
Median age by race in Milwaukee
39.9 Median age for White residents39.7 40.0 30.9 Median age for Black or African American residents28.3 33.4 37.8 Median age for American Indian / Alaska Native residents37.7 39.5 27.7 Median age for Asian residents26.2 29.0 -666,666,666.0 Median age for Native Hawaiian / Pacific Islander residents-666,666,666.0 -666,666,666.0 31.5 Median age for Other race residents32.0 30.5 25.2 Median age for Two or more races residents25.5 24.9 41.5 Median age for White alone residents41.4 41.6 27.1 Median age for Hispanic or Latino residents27.2 27.1
Owner/renter occupied households by race in Milwaukee
House owners and renters - White residents 54,975 54.2% Owner occupied46,453 45.8% Renter occupiedHouse owners and renters - Black or African American residents 22,493 26.2% Owner occupied63,514 73.8% Renter occupiedHouse owners and renters - American Indian / Alaska Native residents 670 48.1% Owner occupied722 51.9% Renter occupiedHouse owners and renters - Asian residents 4,346 52.7% Owner occupied3,906 47.3% Renter occupiedHouse owners and renters - Native Hawaiian / Pacific Islander residents 26 84.2% Owner occupied5 15.8% Renter occupiedHouse owners and renters - Other race residents 3,474 43.8% Owner occupied4,462 56.2% Renter occupiedHouse owners and renters - Two or more races residents 9,950 34.6% Owner occupied18,815 65.4% Renter occupiedHouse owners and renters - White alone residents 52,891 54.6% Owner occupied43,955 45.4% Renter occupiedHouse owners and renters - Hispanic or Latino residents 13,409 38.4% Owner occupied21,502 61.6% Renter occupied
Language usage in Milwaukee
English speakers - Total 78.5% of residents of Milwaukee speak English at home.
15.3% of residents speak Spanish at home 44,681 55.3% Speak English very well36,141 44.7% Speak English less than very well6.2% of residents speak other language at home 21,227 64.7% Speak English very well11,588 35.3% Speak English less than very well
English speakers - Born in the United States 87.5% of residents of Milwaukee speak English at home.
8.9% of residents speak Spanish at home 9,270 84.5% Speak English very well1,697 15.5% Speak English less than very well3.6% of residents speak other language at home 3,292 74.5% Speak English very well1,127 25.5% Speak English less than very well
English speakers - Native, born elsewhere 19.7% of residents of Milwaukee speak English at home.
77.8% of residents speak Spanish at home 5,179 49.0% Speak English very well5,395 51.0% Speak English less than very well2.4% of residents speak other language at home 181 55.0% Speak English very well148 45.0% Speak English less than very well
English speakers - Foreign-born 14.5% of residents of Milwaukee speak English at home.
52.2% of residents speak Spanish at home 6,493 19.9% Speak English very well26,176 80.1% Speak English less than very well33.3% of residents speak other language at home 11,208 53.8% Speak English very well9,639 46.2% Speak English less than very well
White (Caucasian) - Speak only English Native:
95.2% (175,375)Foreign-born:
31.1% (1,604)
White (Caucasian) - Speak another language Native:
4.8% (8,842)Foreign-born:
68.9% (3,554)
Black or African American - Speak only English Native:
99.2% (183,597)Foreign-born:
33.7% (2,922)
Black or African American - Speak another language Native:
0.8% (1,472)Foreign-born:
66.3% (5,742)
American Indian / Alaska Native - Speak only English Native:
75.3% (2,335)Foreign-born:
10.5% (27)
American Indian / Alaska Native - Speak another language Native:
30.1% (934)Foreign-born:
90.3% (233)
Asian - Speak only English Native:
39.6% (5,225)Foreign-born:
16.1% (2,384)
Asian - Speak another language Native:
60.4% (7,970)Foreign-born:
83.9% (12,428)
Native Hawaiian / Pacific Islander - Speak only English Native:
97.8% (121)Foreign-born:
45.3% (8)
Native Hawaiian / Pacific Islander - Speak another language Native:
1.8% (2)Foreign-born:
53.4% (9)
Other race - Speak only English Native:
48.7% (7,008)Foreign-born:
10.4% (786)
Other race - Speak another language Native:
51.3% (7,369)Foreign-born:
89.6% (6,774)
Two or more races - Speak only English Native:
49.0% (31,337)Foreign-born:
4.8% (1,263)
Two or more races - Speak another language Native:
51.0% (32,626)Foreign-born:
95.2% (24,855)
White alone - Speak only English Native:
98.1% (169,963)Foreign-born:
38.9% (1,559)
White alone - Speak another language Native:
1.9% (3,217)Foreign-born:
61.1% (2,444)
Hispanic or Latino - Speak only English Native:
36.3% (26,269)Foreign-born:
4.9% (1,695)
Hispanic or Latino - Speak another language Native:
63.7% (46,081)Foreign-born:
95.1% (32,625)
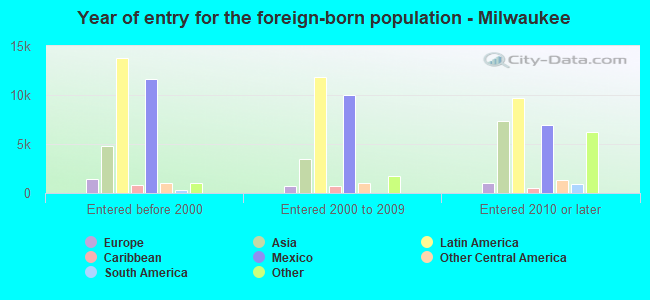
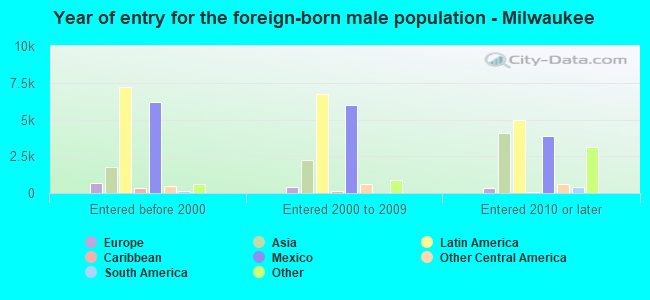
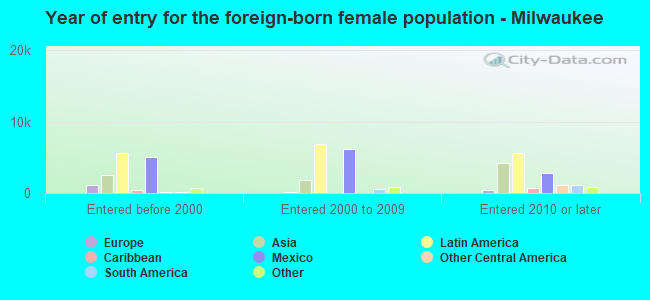
Foreign-born residents in Milwaukee 59,203 residents are foreign born (5.8% Latin America , 2.8% Asia ).
This city:
10.5%Wisconsin:
5.0%
Marital status for residents in Milwaukee Marital status - White (Caucasian) population 15 years and over
Males 52.2% Never married31.4% Now married1.1% Separated2.3% Widowed13.1% DivorcedFemales 45.1% Never married33.2% Now married0.5% Separated8.4% Widowed12.8% DivorcedWomen who gave birth in the past 12 months Now married:
91.8% (1,185)Unmarried:
8.2% (106)
Women who did not give birth in the past 12 months Now married:
27.4% (14,265)Unmarried:
72.6% (37,822)
Marital status - Black or African American population 15 years and over
Males 67.0% Never married19.5% Now married2.1% Separated2.4% Widowed8.9% DivorcedFemales 62.9% Never married16.3% Now married3.3% Separated5.9% Widowed11.6% DivorcedWomen who gave birth in the past 12 months Now married:
17.5% (316)Unmarried:
82.5% (1,493)
Women who did not give birth in the past 12 months Now married:
15.9% (8,763)Unmarried:
84.1% (46,286)
Marital status - American Indian / Alaska Native population 15 years and over
Males 61.6% Never married26.3% Now married0.0% Separated0.0% Widowed12.1% DivorcedFemales 71.3% Never married18.8% Now married0.0% Separated6.9% Widowed3.0% DivorcedWomen who gave birth in the past 12 months Now married:
34.6% (25)Unmarried:
65.4% (47)
Women who did not give birth in the past 12 months Now married:
30.2% (370)Unmarried:
69.8% (855)
Marital status - Asian population 15 years and over
Males 47.6% Never married50.5% Now married1.3% Separated0.3% Widowed0.3% DivorcedFemales 42.5% Never married46.1% Now married1.4% Separated5.2% Widowed4.8% DivorcedWomen who gave birth in the past 12 months Now married:
85.7% (282)Unmarried:
14.3% (47)
Women who did not give birth in the past 12 months Now married:
41.8% (3,688)Unmarried:
58.2% (5,135)
Marital status - Native Hawaiian / Pacific Islander population 15 years and over
Males 46.2% Never married46.2% Now married0.0% Separated0.0% Widowed7.7% DivorcedFemales 7.1% Never married75.0% Now married0.0% Separated0.0% Widowed17.9% DivorcedWomen who gave birth in the past 12 months Now married:
0.0% (0)Unmarried:
100.0% (2)
Women who did not give birth in the past 12 months Now married:
100.0% (11)Unmarried:
0.0% (0)
Marital status - Other race population 15 years and over
Males 55.1% Never married35.3% Now married1.2% Separated0.4% Widowed8.1% DivorcedFemales 48.4% Never married35.8% Now married4.1% Separated3.8% Widowed7.9% DivorcedWomen who gave birth in the past 12 months Now married:
78.8% (164)Unmarried:
21.2% (44)
Women who did not give birth in the past 12 months Now married:
35.6% (2,139)Unmarried:
64.4% (3,872)
Marital status - Two or more races population 15 years and over
Males 54.6% Never married35.1% Now married2.7% Separated1.2% Widowed6.4% DivorcedFemales 47.7% Never married35.7% Now married4.5% Separated4.4% Widowed7.6% DivorcedWomen who gave birth in the past 12 months Now married:
12.0% (122)Unmarried:
88.0% (896)
Women who did not give birth in the past 12 months Now married:
37.1% (9,000)Unmarried:
62.9% (15,284)
Marital status - White alone, not Hispanic / Latino population 15 years and over
Males 51.1% Never married32.1% Now married0.9% Separated2.4% Widowed13.4% DivorcedFemales 44.3% Never married33.9% Now married0.6% Separated8.7% Widowed12.6% DivorcedWomen who gave birth in the past 12 months Now married:
96.1% (1,092)Unmarried:
3.9% (44)
Women who did not give birth in the past 12 months Now married:
28.0% (13,460)Unmarried:
72.0% (34,636)
Marital status - Hispanic or Latino population 15 years and over
Males 54.4% Never married34.2% Now married2.5% Separated1.2% Widowed7.6% DivorcedFemales 47.3% Never married36.1% Now married3.4% Separated4.6% Widowed8.6% DivorcedWomen who gave birth in the past 12 months Now married:
22.7% (333)Unmarried:
77.3% (1,135)
Women who did not give birth in the past 12 months Now married:
36.0% (10,382)Unmarried:
64.0% (18,441)
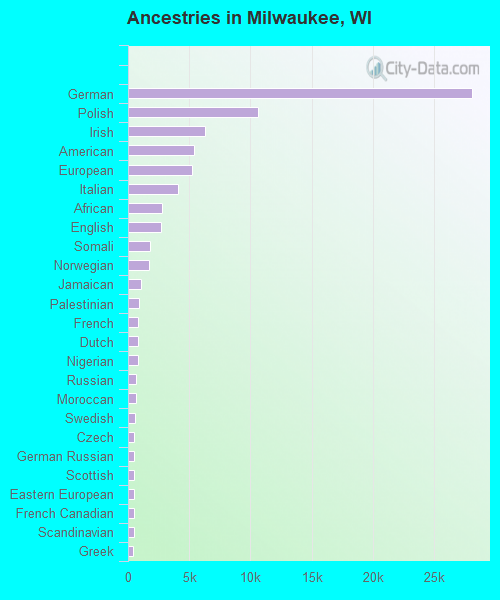
Ancestries in Milwaukee
28,090 7.5% German10,654 2.9% Polish6,270 1.7% Irish5,418 1.5% American5,239 1.4% European4,071 1.1% Italian2,751 0.7% African2,725 0.7% English1,821 0.5% Somali1,713 0.5% Norwegian1,075 0.3% Jamaican879 0.2% Palestinian823 0.2% French808 0.2% Dutch793 0.2% Nigerian675 0.2% Russian626 0.2% Moroccan566 0.2% Swedish526 0.1% Czech514 0.1% German Russian474 0.1% Scottish467 0.1% Eastern European464 0.1% French Canadian463 0.1% Scandinavian435 0.1% Greek369 0.10% Arab364 0.10% Serbian351 0.09% Iraqi342 0.09% Danish335 0.09% Hungarian310 0.08% Croatian288 0.08% Slovene275 0.07% Scotch-Irish269 0.07% Belgian268 0.07% British266 0.07% West Indian264 0.07% Ukrainian252 0.07% Syrian237 0.06% Iranian211 0.06% Finnish166 0.04% Austrian160 0.04% Lithuanian160 0.04% Ethiopian157 0.04% Romanian142 0.04% Ghanaian124 0.03% Yugoslavian121 0.03% Slovak116 0.03% Swiss114 0.03% Canadian99 0.03% Haitian94 0.03% Northern European79 0.02% Czechoslovakian75 0.02% Kenyan71 0.02% Latvian62 0.02% Egyptian57 0.02% Jordanian54 0.01% Macedonian54 0.01% Albanian53 0.01% Lebanese42 0.01% Slavic41 0.01% Bulgarian40 0.01% Welsh39 0.01% South African37 0.01% Sierra Leonean37 0.01% Ugandan34 0.01% Armenian32 0.01% Senegalese30 0.01% Turkish26 0.01% Belizean22 0.01% Luxembourger21 0.01% Icelander21 0.01% Cajun
Geographical mobility in Milwaukee Same house 1 year ago 157,091 81.3% White (Caucasian)176,254 85.0% Black or African American4,212 88.6% American Indian / Alaska Native26,715 86.7% Asian119 85.6% Native Hawaiian / Pacific Islander18,227 77.7% Other race89,963 91.2% Two or more races146,895 81.7% White alone, not Hispanic / Latino102,715 88.9% Hispanic or LatinoMoved within same county 19,842 10.3% White / Caucasian26,063 12.6% Black or African American341 7.2% American Indian / Alaska Native3,253 10.6% Asian3 2.2% Native Hawaiian / Pacific Islander4,149 17.7% Other race5,318 5.4% Two or more races17,739 9.9% White alone, not Hispanic / Latino8,949 7.7% Hispanic or LatinoMoved within same state 7,814 4.0% White / Caucasian2,814 1.4% Black or African American120 2.5% American Indian / Alaska Native80 0.3% Asian6 4.0% Native Hawaiian / Pacific Islander189 0.8% Other race496 0.5% Two or more races7,374 4.1% White alone, not Hispanic / Latino756 0.7% Hispanic or LatinoMoved from different state 7,434 3.8% White / Caucasian2,176 1.0% Black or African American81 1.7% American Indian / Alaska Native551 1.8% Asian13 9.1% Native Hawaiian / Pacific Islander590 2.5% Other race1,772 1.8% Two or more races6,942 3.9% White alone, not Hispanic / Latino1,511 1.3% Hispanic or LatinoMoved from abroad 997 0.5% White25 0.0% Black or African American208 0.7% Asian310 1.3% Other race1,083 1.1% Two or more races788 0.4% White alone, not Hispanic / Latino1,602 1.4% Hispanic or Latino
Children Nativity (place of birth) in Milwaukee
Children under 6 years - Living with two parents Both parents native 8,360 100.0% NativeBoth parents foreign-born 4,118 94.0% Native265 6.0% Foreign-bornOne native, one foreign-born parent 1,706 100.0% NativeChildren under 6 years - Living with one parent Native parent 23,497 100.0% NativeForeign-born parent 1,516 100.0% NativeChildren 6 to 17 years - Living with two parents Both parents native 16,083 98.9% Native187 1.1% Foreign-bornBoth parents foreign-born 10,829 73.8% Native3,848 26.2% Foreign-bornOne native, one foreign-born parent 3,335 97.7% Native80 2.3% Foreign-bornChildren 6 to 17 years - Living with one parent Native parent 49,415 100.0% NativeForeign-born parent 4,944 53.1% Native4,373 46.9% Foreign-born
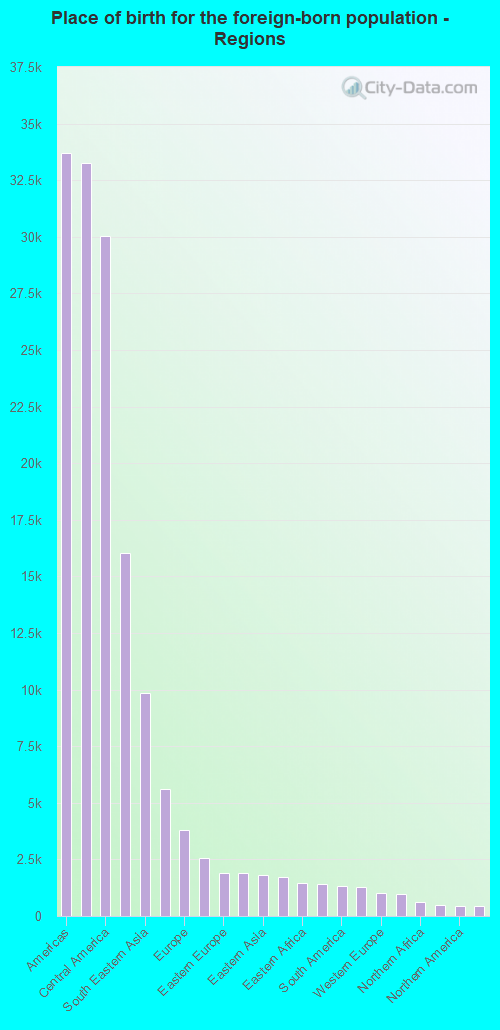
Place of birth for residents in Milwaukee 33,696 Americas33,254 Latin America30,024 Central America16,044 Asia9,865 South Eastern Asia5,608 Africa3,795 Europe2,571 South Central Asia1,889 Eastern Europe1,883 Caribbean1,807 Eastern Asia1,739 Western Africa1,478 Eastern Africa1,432 Western Asia1,347 South America1,283 China1,014 Western Europe985 Middle Africa598 Northern Africa470 Southern Europe442 Northern America421 Northern Europe304 Southern Africa57 Oceania11 Australia and New Zealand Subregion27,896 Mexico3,346 Burma (Myanmar)2,352 Thailand2,257 Laos1,703 India1,172 China964 Nigeria804 Malaysia761 Jamaica697 Germany666 El Salvador666 Dominican Republic598 Philippines566 Somalia564 Nicaragua471 Guatemala459 Pakistan455 Democratic Republic of Congo (Zaire)452 Poland449 Kenya442 Canada436 Jordan417 Iraq403 Korea367 Morocco366 Congo362 Vietnam358 Peru314 Colombia313 Cuba305 Ghana304 South Africa282 Italy261 Russia239 Honduras235 Venezuela232 Kuwait227 Bolivia202 Ukraine181 Eritrea175 Iran164 Cameroon155 Spain148 United Kingdom146 England127 Croatia121 Bangladesh113 Ethiopia112 Serbia107 Bosnia and Herzegovina105 Syria102 Saudi Arabia101 Japan97 Argentina93 Algeria90 Egypt87 Haiti85 France84 Belarus84 Austria81 Lithuania81 Ivory Coast80 Costa Rica78 Netherlands76 Indonesia72 Scotland71 Sierra Leone70 Romania70 Hungary70 Panama62 Cambodia58 Belgium56 Kazakhstan55 Hong Kong54 Taiwan53 Brazil51 Bulgaria49 Tanzania45 Czechoslovakia41 Israel38 Turkey38 Latvia38 Liberia38 Chile37 Nepal35 Dominica32 Belize30 North Macedonia (Macedonia)26 Sudan26 Togo23 Greece22 Lebanon21 Ireland20 Ecuador15 Azerbaijan12 Sweden12 Senegal11 Australia11 Albania9 Uzbekistan8 Barbados8 Switzerland7 Portugal4 Trinidad and Tobago4 Uganda3 Bahamas3 Singapore
Grandparents responsible for own grandchildren in Milwaukee
Grandparents (30 to 59 years) White / Caucasian 616 68.4% Responsible for grandchildren285 31.6% Not responsible for grandchildrenBlack or African American 870 60.0% Responsible for grandchildren579 40.0% Not responsible for grandchildrenAmerican Indian / Alaska Native 16 78.1% Responsible for grandchildren5 21.9% Not responsible for grandchildrenAsian 40 20.5% Responsible for grandchildren155 79.5% Not responsible for grandchildrenNative Hawaiian / Pacific Islander 6 100.0% Responsible for grandchildrenOther race 112 16.8% Responsible for grandchildren553 83.2% Not responsible for grandchildrenTwo or more races 266 28.4% Responsible for grandchildren671 71.6% Not responsible for grandchildrenWhite alone, not Hispanic / Latino 616 68.4% Responsible for grandchildren285 31.6% Not responsible for grandchildrenHispanic or Latino 477 33.8% Responsible for grandchildren935 66.2% Not responsible for grandchildrenGrandparents (60 years and over) White / Caucasian 166 21.0% Responsible for grandchildren626 79.0% Not responsible for grandchildrenBlack or African American 360 26.0% Responsible for grandchildren1,026 74.0% Not responsible for grandchildrenAmerican Indian / Alaska Native 10 100.0% Responsible for grandchildrenAsian 6 2.2% Responsible for grandchildren265 97.8% Not responsible for grandchildrenNative Hawaiian / Pacific Islander 4 100.0% Not responsible for grandchildrenOther race 63 21.8% Responsible for grandchildren227 78.2% Not responsible for grandchildrenTwo or more races 100 21.3% Responsible for grandchildren370 78.7% Not responsible for grandchildrenWhite alone, not Hispanic / Latino 166 21.0% Responsible for grandchildren626 79.0% Not responsible for grandchildrenHispanic or Latino 50 12.7% Responsible for grandchildren345 87.3% Not responsible for grandchildren
Zip codes: 53154 , 53202 , 53203 , 53204 , 53205 , 53206 , 53207 , 53208 , 53210 , 53211 , 53213 , 53214 , 53215 , 53216 , 53218 , 53222 , 53224 , 53226 , 53233 , 53235 , 53295 .