Estimated zip code population in 2022: 9,304 Zip code population in 2010: 9,270 Zip code population in 2000: 8,825
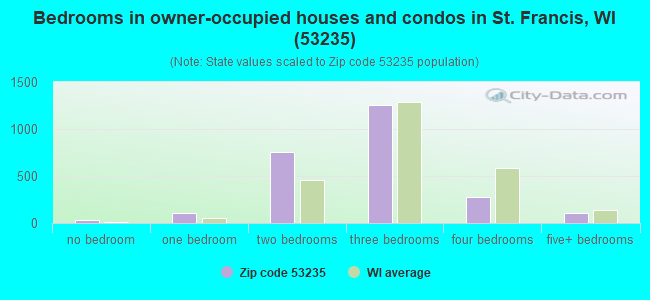
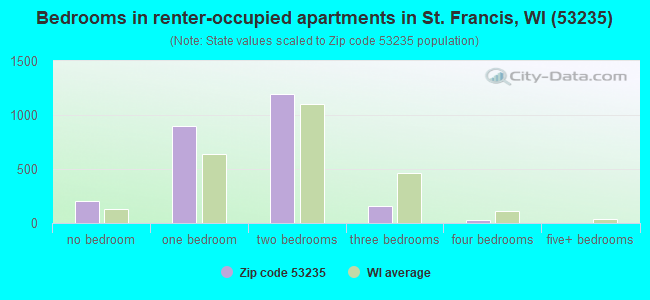
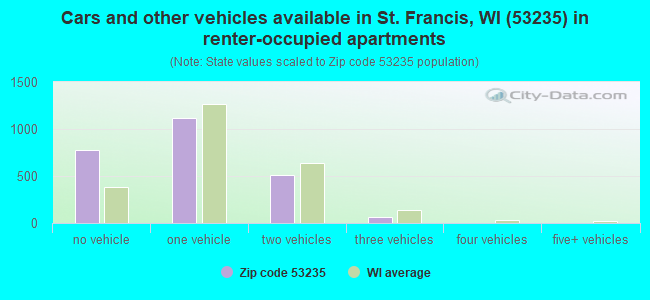
Houses and condos: 5,226 Renter-occupied apartments: 2,452
% of renters here:
49%
State:
32%
March 2022 cost of living index in zip code 53235: 97.5 (near average, U.S. average is 100)
Land area: 2.5 sq. mi. Water area: 0.7 sq. mi.
Population density: 3,657 people per square mile
(average).
OSM Map
General Map
Google Map
MSN Map
OSM Map
General Map
Google Map
MSN Map
OSM Map
General Map
Google Map
MSN Map
OSM Map
General Map
Google Map
MSN Map
Please wait while loading the map...
Real estate property taxes paid for housing units in 2022:
This zip code:
1.9% ($4,135)
Wisconsin:
1.4% ($3,497)
Median real estate property taxes paid for housing units with mortgages in 2022: $4,216 (2.0%) Median real estate property taxes paid for housing units with no mortgage in 2022: $4,035 (1.9%)
Business Search- 14 Million verified businesses
Males: 4,620
(49.7%)
Females: 4,683
(50.3%)
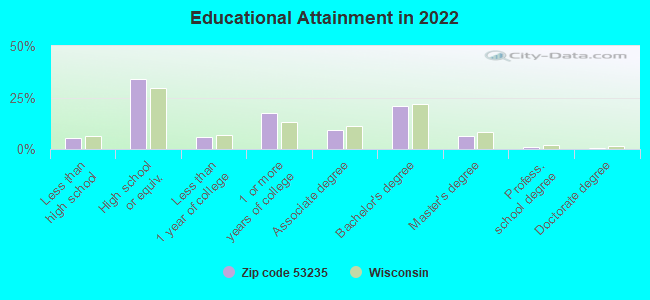
For population 25 years and over in 53235:
High school or higher: 93.7%
Bachelor's degree or higher: 28.2%
Graduate or professional degree: 7.6%
Unemployed: 0.7%
Mean travel time to work (commute): 22.7 minutes
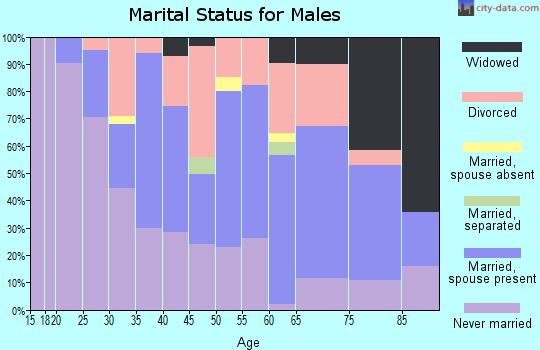
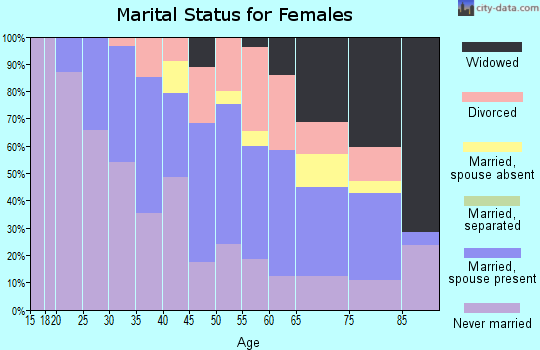
For population 15 years and over in 53235:
Never married: 34.9%
Now married: 38.5%
Separated: 2.0%
Widowed: 9.9%
Divorced: 14.6%
Zip code 53235 compared to state average:
Unemployed percentage significantly below state average.
Median age significantly above state average.
Renting percentage above state average.
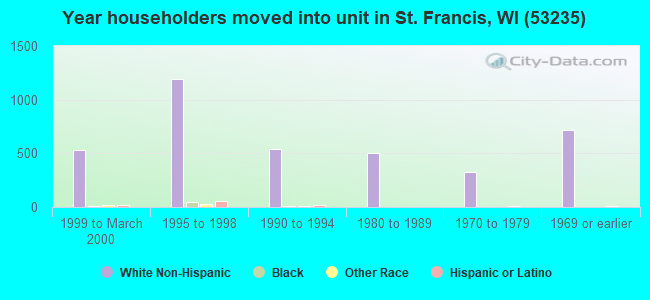
Length of stay since moving in significantly above state average.
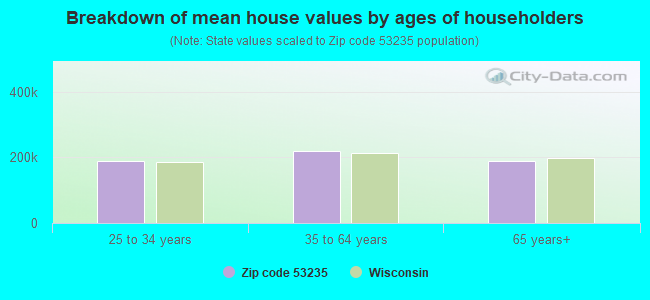
Estimated median house/condo value in 2022: $214,345
53235:
$214,345
Wisconsin:
$252,800
According to our research of Wisconsin and other state lists, there were 14 registered sex offenders living in 53235 zip code as of April 27, 2024. The ratio of all residents to sex offenders in zip code 53235 is 676 to 1. The ratio of registered sex offenders to all residents in this zip code is lower than the state average.
Median resident age:
This zip code:
54.1 years
Wisconsin median age:
40.4 years
Average household size:
This zip code:
1.8 people
Wisconsin:
2.3 people
Averages for the 2020 tax year for zip code 53235, filed in 2021:
Average Adjusted Gross Income (AGI) in 2020: $56,174 (Individual Income Tax Returns)
Here:
$56,174
State:
$72,319
Salary/wage: $52,497 (reported on 81.6% of returns)
Here:
$52,497
State:
$59,242
(% of AGI for various income ranges: 1052.1% for AGIs below $25k, 3780.5% for AGIs $25k-50k, 6570.0% for AGIs $50k-75k, 9525.8% for AGIs $75k-100k, 18149.7% for AGIs $100k-200k, 65126.7% for AGIs over 200k)
Taxable interest for individuals: $792 (reported on 30.5% of returns)
This zip code:
$792
Wisconsin:
$1,431
(% of AGI for various income ranges: 18.2% for AGIs below $25k, 19.0% for AGIs $25k-50k, 30.6% for AGIs $50k-75k, 46.5% for AGIs $75k-100k, 95.0% for AGIs $100k-200k, 393.3% for AGIs over 200k)
Ordinary dividends: $2,991 (reported on 18.2% of returns)
Here:
$2,991
State:
$6,481
(% of AGI for various income ranges: 33.1% for AGIs below $25k, 23.8% for AGIs $25k-50k, 56.1% for AGIs $50k-75k, 115.8% for AGIs $75k-100k, 276.9% for AGIs $100k-200k, 1316.7% for AGIs over 200k)
Net capital gain/loss in AGI: +$6,607 (reported on 15.3% of returns)
Here:
+$6,607
State:
+$18,329
(% of AGI for various income ranges: 9.0% for AGIs below $25k, 18.0% for AGIs $25k-50k, 66.6% for AGIs $50k-75k, 80.0% for AGIs $75k-100k, 373.3% for AGIs $100k-200k, 9700.0% for AGIs over 200k)
Profit/loss from business: +$9,092 (reported on 10.0% of returns)
Here:
+$9,092
State:
+$14,562
(% of AGI for various income ranges: 68.5% for AGIs below $25k, 74.0% for AGIs $25k-50k, 141.7% for AGIs $50k-75k, 212.0% for AGIs $75k-100k, 384.4% for AGIs $100k-200k)
Taxable individual retirement arrangement distribution: $16,098 (reported on 10.0% of returns)
53235:
$16,098
Wisconsin:
$19,348
(% of AGI for various income ranges: 75.7% for AGIs below $25k, 116.4% for AGIs $25k-50k, 190.1% for AGIs $50k-75k, 387.2% for AGIs $75k-100k, 961.1% for AGIs $100k-200k)
Total itemized deductions: $22,642 (reported on 6.8% of returns)
Here:
$22,642
State:
$33,000
(% of AGI for various income ranges: 112.7% for AGIs $25k-50k, 229.7% for AGIs $50k-75k, 430.2% for AGIs $75k-100k, 643.3% for AGIs $100k-200k, 3696.7% for AGIs over 200k)
Charity contributions: $5,279 (reported on 4.5% of returns)
Here:
$5,279
State:
$12,044
(% of AGI for various income ranges: 14.4% for AGIs $25k-50k, 21.0% for AGIs $50k-75k, 62.3% for AGIs $75k-100k, 123.9% for AGIs $100k-200k, 823.3% for AGIs over 200k)
Taxes paid: $8,177 (reported on 6.6% of returns)
53235:
$8,177
State:
$8,228
(% of AGI for various income ranges: 22.9% for AGIs $25k-50k, 93.9% for AGIs $50k-75k, 190.8% for AGIs $75k-100k, 230.0% for AGIs $100k-200k, 1100.0% for AGIs over 200k)
Earned income credit: $1,631 (reported on 10.4% of returns)
Here:
$1,631
State:
$2,155
(% of AGI for various income ranges: 54.2% for AGIs below $25k, 29.0% for AGIs $25k-50k)
Percentage of individuals using paid preparers for their 2020 taxes: 93.0%
Here:
93%
State:
94%
(% for various income ranges: 90.9% for AGIs below $25k, 92.5% for AGIs $25k-50k, 94.7% for AGIs $50k-75k, 94.7% for AGIs $75k-100k, 95.3% for AGIs $100k-200k, 90.0% for AGIs over 200k)
Averages for the 2012 tax year for zip code 53235, filed in 2013:
Average Adjusted Gross Income (AGI) in 2012: $44,581 (Individual Income Tax Returns)
Here:
$44,581
State:
$57,939
Salary/wage: $43,016 (reported on 84.0% of returns)
Here:
$43,016
State:
$48,248
(% of AGI for various income ranges: 68.9% for AGIs below $25k, 82.8% for AGIs $25k-50k, 83.3% for AGIs $50k-75k, 84.9% for AGIs $75k-100k, 82.2% for AGIs $100k-200k, 70.5% for AGIs over 200k)
Taxable interest for individuals: $630 (reported on 34.6% of returns)
This zip code:
$630
Wisconsin:
$1,224
(% of AGI for various income ranges: 1.1% for AGIs below $25k, 0.7% for AGIs $25k-50k, 0.2% for AGIs $50k-75k, 0.3% for AGIs $75k-100k, 0.5% for AGIs $100k-200k, 0.2% for AGIs over 200k)
Ordinary dividends: $1,720 (reported on 18.4% of returns)
Here:
$1,720
State:
$5,137
(% of AGI for various income ranges: 1.3% for AGIs below $25k, 0.7% for AGIs $25k-50k, 0.6% for AGIs $50k-75k, 0.6% for AGIs $75k-100k, 0.8% for AGIs $100k-200k)
Net capital gain/loss in AGI: +$1,148 (reported on 11.3% of returns)
Here:
+$1,148
State:
+$11,137
(% of AGI for various income ranges: 0.5% for AGIs $50k-75k, 0.4% for AGIs $75k-100k, 0.7% for AGIs $100k-200k)
Profit/loss from business: +$8,798 (reported on 8.7% of returns)
Here:
+$8,798
State:
+$11,943
(% of AGI for various income ranges: 4.8% for AGIs below $25k, 1.2% for AGIs $25k-50k, 1.1% for AGIs $50k-75k, 1.8% for AGIs $75k-100k, 1.7% for AGIs $100k-200k)
Taxable individual retirement arrangement distribution: $9,806 (reported on 9.9% of returns)
53235:
$9,806
Wisconsin:
$14,087
(% of AGI for various income ranges: 3.9% for AGIs below $25k, 1.9% for AGIs $25k-50k, 2.2% for AGIs $50k-75k, 1.6% for AGIs $75k-100k, 2.6% for AGIs $100k-200k)
Total itemized deductions: $16,875 (22% of AGI, reported on 31.4% of returns)
Here:
$16,875
State:
$22,257
Here:
22.1% of AGI
State:
20.1% of AGI
(% of AGI for various income ranges: 8.8% for AGIs below $25k, 8.5% for AGIs $25k-50k, 12.2% for AGIs $50k-75k, 13.6% for AGIs $75k-100k, 15.0% for AGIs $100k-200k, 12.4% for AGIs over 200k)
Charity contributions: $2,158 (reported on 23.9% of returns)
Here:
$2,158
State:
$3,370
(% of AGI for various income ranges: 0.8% for AGIs below $25k, 0.8% for AGIs $25k-50k, 1.1% for AGIs $50k-75k, 1.2% for AGIs $75k-100k, 1.6% for AGIs $100k-200k, 1.4% for AGIs over 200k)
Taxes paid: $8,386 (reported on 31.2% of returns)
53235:
$8,386
State:
$10,731
(% of AGI for various income ranges: 2.8% for AGIs below $25k, 3.5% for AGIs $25k-50k, 6.1% for AGIs $50k-75k, 7.0% for AGIs $75k-100k, 8.3% for AGIs $100k-200k, 7.4% for AGIs over 200k)
Earned income credit: $1,675 (reported on 12.8% of returns)
Here:
$1,675
State:
$2,094
(% of AGI for various income ranges: 3.5% for AGIs below $25k, 0.5% for AGIs $25k-50k)
Percentage of individuals using paid preparers for their 2012 taxes: 44.5%
Here:
45%
State:
54%
(% for various income ranges: 41.7% for AGIs below $25k, 41.7% for AGIs $25k-50k, 45.7% for AGIs $50k-75k, 54.5% for AGIs $75k-100k, 53.8% for AGIs $100k-200k, 50.0% for AGIs over 200k)
Averages for the 2004 tax year for zip code 53235, filed in 2005:
Average Adjusted Gross Income (AGI) in 2004: $39,224 (Individual Income Tax Returns)
Here:
$39,224
State:
$47,735
Salary/wage: $38,333 (reported on 85.0% of returns)
Here:
$38,333
State:
$41,540
(% of AGI for various income ranges: 71.1% for AGIs below $10k, 70.1% for AGIs $10k-25k, 85.6% for AGIs $25k-50k, 88.7% for AGIs $50k-75k, 88.1% for AGIs $75k-100k, 75.1% for AGIs over 100k)
Taxable interest for individuals: $849 (reported on 48.5% of returns)
This zip code:
$849
Wisconsin:
$1,420
(% of AGI for various income ranges: 4.7% for AGIs below $10k, 2.8% for AGIs $10k-25k, 1.0% for AGIs $25k-50k, 0.8% for AGIs $50k-75k, 0.5% for AGIs $75k-100k, 0.5% for AGIs over 100k)
Taxable dividends: $1,446 (reported on 22.6% of returns)
Here:
$1,446
State:
$2,869
(% of AGI for various income ranges: 3.2% for AGIs below $10k, 1.3% for AGIs $10k-25k, 0.7% for AGIs $25k-50k, 0.9% for AGIs $50k-75k, 0.5% for AGIs $75k-100k, 0.7% for AGIs over 100k)
Net capital gain/loss: +$2,516 (reported on 14.9% of returns)
Here:
+$2,516
State:
+$9,569
(% of AGI for various income ranges: -1.1% for AGIs below $10k, -0.0% for AGIs $10k-25k, 0.6% for AGIs $25k-50k, 0.6% for AGIs $50k-75k, 0.9% for AGIs $75k-100k, 3.0% for AGIs over 100k)
Profit/loss from business: +$5,792 (reported on 7.7% of returns)
Here:
+$5,792
State:
+$10,417
(% of AGI for various income ranges: 3.8% for AGIs below $10k, 2.6% for AGIs $10k-25k, 1.1% for AGIs $25k-50k, 0.9% for AGIs $50k-75k, 0.6% for AGIs $75k-100k, 0.8% for AGIs over 100k)
IRA payment deduction: $2,379 (reported on 2.0% of returns)
53235:
$2,379
Wisconsin:
$2,900
(% of AGI for various income ranges: 0.2% for AGIs $10k-25k, 0.2% for AGIs $25k-50k, 0.1% for AGIs $50k-75k, 0.1% for AGIs $75k-100k)
Total itemized deductions: $13,914 (21% of AGI, reported on 33.1% of returns)
Here:
$13,914
State:
$18,160
Here:
21.2% of AGI
State:
21.1% of AGI
(% of AGI for various income ranges: 8.5% for AGIs below $10k, 8.2% for AGIs $10k-25k, 10.0% for AGIs $25k-50k, 13.6% for AGIs $50k-75k, 15.2% for AGIs $75k-100k, 10.8% for AGIs over 100k)
Charity contributions deductions: $1,820 (3% of AGI, reported on 27.8% of returns)
Here:
$1,820
State:
$2,711
Here:
2.8% of AGI
State:
3.0% of AGI
(% of AGI for various income ranges: 0.6% for AGIs below $10k, 1.0% for AGIs $10k-25k, 1.2% for AGIs $25k-50k, 1.4% for AGIs $50k-75k, 1.5% for AGIs $75k-100k, 1.4% for AGIs over 100k)
Total tax: $4,963 (reported on 80.6% of returns)
53235:
$4,963
State:
$7,114
(% of AGI for various income ranges: 2.0% for AGIs below $10k, 4.5% for AGIs $10k-25k, 8.1% for AGIs $25k-50k, 9.3% for AGIs $50k-75k, 10.4% for AGIs $75k-100k, 19.6% for AGIs over 100k)
Earned income credit: $1,304 (reported on 9.3% of returns)
Here:
$1,304
State:
$1,544
Percentage of individuals using paid preparers for their 2004 taxes: 48.7%
Here:
49%
State:
57%
(% for various income ranges: 41.6% for AGIs below $10k, 49.9% for AGIs $10k-25k, 48.5% for AGIs $25k-50k, 50.0% for AGIs $50k-75k, 51.9% for AGIs $75k-100k, 62.2% for AGIs over 100k)
Likely homosexual households (counted as self-reported same-sex unmarried-partner households)
Lesbian couples: 0.7% of all households
Gay men: 0.8% of all households
Household received Food Stamps/SNAP in the past 12 months: 483 Household did not receive Food Stamps/SNAP in the past 12 months: 4,505
Women who had a birth in the past 12 months: 6 (0 now married, 5 unmarried) Women who did not have a birth in the past 12 months: 1,648 (625 now married, 1,022 unmarried)
Housing units in zip code 53235 with a mortgage: 1,258 (117 second mortgage, 103 both second mortgage and home equity loan) Median monthly owner costs for units with a mortgage: $1,444 Median monthly owner costs for units without a mortgage: $683
Residents with income below the poverty level in 2022:
This zip code:
16.6%
Whole state:
10.7%
Residents with income below 50% of the poverty level in 2022:
This zip code:
7.2%
Whole state:
5.7%
Median number of rooms in houses and condos:
Here:
5.8
State:
6.5
Median number of rooms in apartments:
Here:
3.6
State:
4.1
Notable locations in this zip code not listed on our city pages
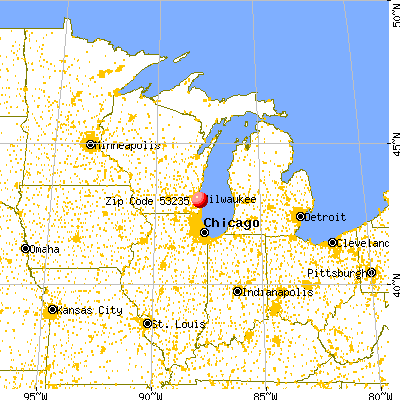
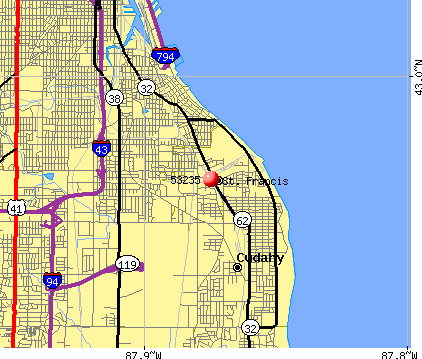
Notable locations in zip code 53235: Wisconsin Electric Power Company (A), Lakeside Power Station (B), Saint Francis Fire Department (C), Salsmann Library (D), Saint Francis Municipal Building (E), Heiss Residential Hall (F). Display/hide their locations on the map
736 married couples with children.
288 single-parent households (22 men, 266 women).
90.1% of residents of 53235 zip code speak English at home.
5.1% of residents speak Spanish at home (82% very well, 17% well, 1% not well).
3.3% of residents speak other Indo-European language at home (59% very well, 5% well, 36% not well).
0.4% of residents speak Asian or Pacific Island language at home (100% well).
1.5% of residents speak other language at home (65% very well, 35% not well).
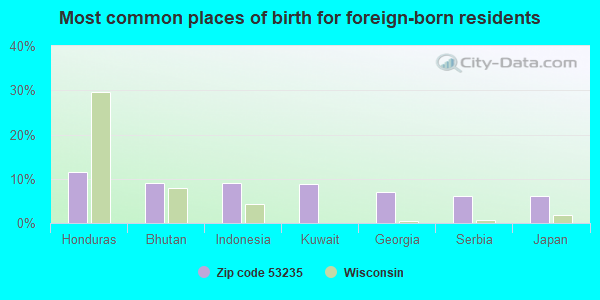
Foreign born population: 456 (4.9%) (65.1% of them are naturalized citizens)
This zip code:
4.9%
Whole state:
5.0%
12%Honduras
9%Bhutan
9%Indonesia
9%Kuwait
7%Georgia
6%Serbia
6%Japan
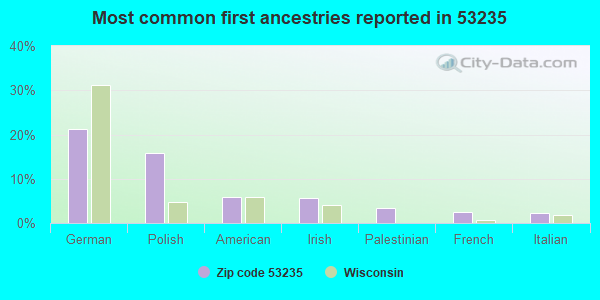
21%German
16%Polish
6%American
6%Irish
3%Palestinian
2%French
2%Italian
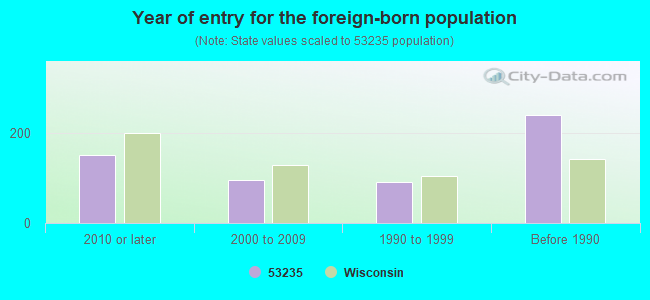
Year of entry for the foreign-born population
1512010 or later
952000 to 2009
921990 to 1999
240Before 1990
Facilities with environmental interests located in this zip code:
ADVANCE SCREW PRODUCTS CO (3767 S KINNICKINNIC AVE in ST FRANCIS, WI)
Small Quantity Generators, between 100 kg and 1000 kg of hazardous waste/month (Resource Conservation and Recovery Act (tracking hazardous waste)) - notification Organizations: ED SCHWALBACH SR (CONTACT/OWNER)
Housing units lacking complete plumbing facilities: 1.1% Housing units lacking complete kitchen facilities: 4.0%
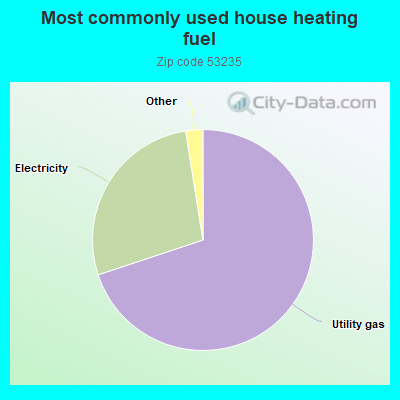
69.9%Utility gas
27.6%Electricity
0.9%Other fuel
0.7%Bottled, tank, or LP gas
Place of birth for U.S.-born residents:
This state: 6,607
Northeast: 106
Midwest: 1,366
South: 375
West: 265
60% of the 53235 zip code residents lived in the same house 5 years ago. Out of people who lived in different houses, 77% lived in this county. Out of people who lived in different counties, 50% lived in Wisconsin.
83% of the 53235 zip code residents lived in the same house 1 year ago. Out of people who lived in different houses, 75% moved from this county. Out of people who lived in different houses, 7% moved from different county within same state. Out of people who lived in different houses, 9% moved from different state. Out of people who lived in different houses, 2% moved from abroad.
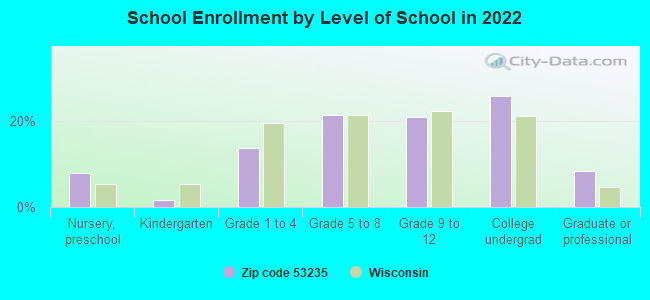
Private vs. public school enrollment:
Students in private schools in grades 1 to 8 (elementary and middle school): 66
Here:
15.1%
Wisconsin:
16.7%
Students in private schools in grades 9 to 12 (high school): 43
Here:
16.3%
Wisconsin:
12.5%
Students in private undergraduate colleges: 45
Here:
13.7%
Wisconsin:
17.5%
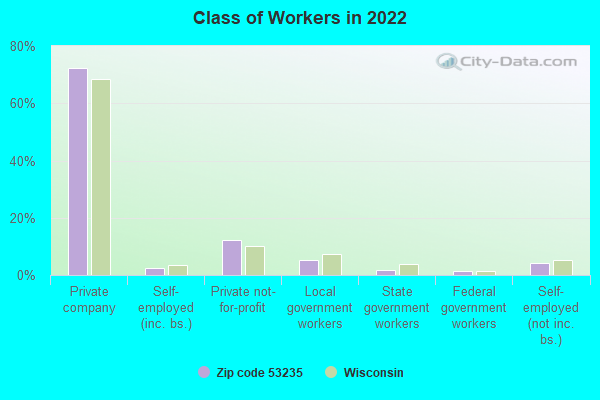
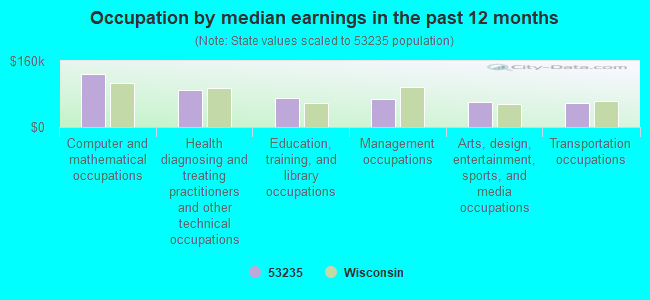
Occupation by median earnings in the past 12 months ($)
129,367Computer and mathematical occupations
90,441Health diagnosing and treating practitioners and other technical occupations
70,939Education, training, and library occupations
67,144Management occupations
61,157Arts, design, entertainment, sports, and media occupations
57,334Transportation occupations
Companies with federal contracts located in this zip code:
BECKER BOILER CO INC (1785 E BOLIVAR AVE in MILWAUKEE, WI; small business) : $26,201 in 2 contractsfrom 2002 to 2004
$22,908 with Army for Maintenance, Repair or Alteration of Real Property -- Office Buildings. Signed on 2004-02-20. Completion date: 2004-02-13.
$3,293, same as above.Signed on 2002-06-19. Completion date: 2002-06-21.
SIGN & DESIGN OF MILWAUKEE INC (3775 S PACKARD AVE STE B in MILWAUKEE, WI; small business)
$19,200 with Army for Miscellaneous Vehicular Components. Signed on 2004-09-28. Completion date: 2004-10-30.
Top industries in this zip code by the number of employees in 2005:
Health Care and Social Assistance: Offices of Physicians (except Mental Health Specialists) (100-249 employees: 1 establishment, 10-19 employees: 1 establishment, 5-9 employees: 2 establishments, 1-4 employees: 5 establishments)
Other Services (except Public Administration): Religious Organizations (100-249: 1, 5-9: 2, 1-4: 1)
Finance and Insurance: Portfolio Management (100-249: 1)
Finance and Insurance: Savings Institutions (50-99: 1)
Health Care and Social Assistance: Home Health Care Services (50-99: 1)
People in group quarters in 2010:
117 people in nursing facilities/skilled-nursing facilities
109 people in other noninstitutional facilities
30 people in college/university student housing
23 people in group homes intended for adults
People in group quarters in 2000:
150 people in religious group quarters
9 people in other noninstitutional group quarters
7 people in homes for the mentally retarded
Home Mortgage Disclosure Act Aggregated Statistics For Year 2009 (Based on 2 full and 4 partial tracts)
A) FHA, FSA/RHS & VA Home Purchase Loans
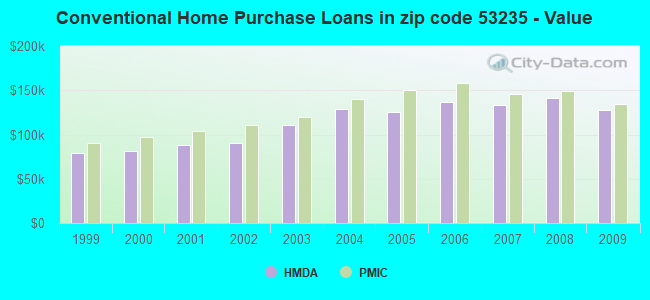
B) Conventional Home Purchase Loans
C) Refinancings
D) Home Improvement Loans
E) Loans on Dwellings For 5+ Families
F) Non-occupant Loans on < 5 Family Dwellings (A B C & D)
Number
Average Value
Number
Average Value
Number
Average Value
Number
Average Value
Number
Average Value
Number
Average Value
LOANS ORIGINATED
67
$134,761
75
$127,810
477
$131,988
19
$58,239
10
$1,496,052
27
$171,813
APPLICATIONS APPROVED, NOT ACCEPTED
4
$118,875
4
$77,862
49
$143,497
8
$7,155
0
$0
0
$0
APPLICATIONS DENIED
5
$138,616
20
$157,642
189
$145,917
6
$21,507
0
$0
14
$114,029
APPLICATIONS WITHDRAWN
10
$144,520
10
$120,228
116
$142,420
5
$97,872
2
$885,420
11
$102,135
FILES CLOSED FOR INCOMPLETENESS
0
$0
2
$207,960
29
$152,299
0
$0
0
$0
2
$110,045
Aggregated Statistics For Year 2008 (Based on 2 full and 4 partial tracts)
A) FHA, FSA/RHS & VA Home Purchase Loans
B) Conventional Home Purchase Loans
C) Refinancings
D) Home Improvement Loans
E) Loans on Dwellings For 5+ Families
F) Non-occupant Loans on < 5 Family Dwellings (A B C & D)
G) Loans On Manufactured Home Dwelling (A B C & D)
Number
Average Value
Number
Average Value
Number
Average Value
Number
Average Value
Number
Average Value
Number
Average Value
Number
Average Value
LOANS ORIGINATED
32
$147,055
118
$140,980
298
$134,465
37
$53,589
13
$549,045
29
$126,923
2
$71,920
APPLICATIONS APPROVED, NOT ACCEPTED
0
$0
6
$143,843
32
$151,181
8
$60,149
2
$305,010
2
$125,060
0
$0
APPLICATIONS DENIED
0
$0
17
$180,406
148
$156,047
32
$60,984
0
$0
15
$188,192
0
$0
APPLICATIONS WITHDRAWN
2
$125,925
5
$126,306
80
$132,913
7
$59,967
0
$0
6
$116,102
0
$0
FILES CLOSED FOR INCOMPLETENESS
0
$0
4
$119,002
20
$191,026
0
$0
0
$0
5
$194,330
0
$0
Aggregated Statistics For Year 2007 (Based on 2 full and 4 partial tracts)
A) FHA, FSA/RHS & VA Home Purchase Loans
B) Conventional Home Purchase Loans
C) Refinancings
D) Home Improvement Loans
E) Loans on Dwellings For 5+ Families
F) Non-occupant Loans on < 5 Family Dwellings (A B C & D)
Number
Average Value
Number
Average Value
Number
Average Value
Number
Average Value
Number
Average Value
Number
Average Value
LOANS ORIGINATED
10
$170,720
229
$133,233
258
$122,136
57
$37,353
4
$1,236,735
26
$160,301
APPLICATIONS APPROVED, NOT ACCEPTED
0
$0
26
$125,261
46
$124,427
16
$38,302
0
$0
2
$99,640
APPLICATIONS DENIED
4
$151,575
26
$106,771
182
$135,417
27
$31,441
2
$23,395
10
$131,139
APPLICATIONS WITHDRAWN
0
$0
17
$104,752
65
$135,312
3
$19,143
0
$0
0
$0
FILES CLOSED FOR INCOMPLETENESS
0
$0
5
$144,784
21
$142,194
0
$0
0
$0
0
$0
Aggregated Statistics For Year 2006 (Based on 2 full and 4 partial tracts)
A) FHA, FSA/RHS & VA Home Purchase Loans
B) Conventional Home Purchase Loans
C) Refinancings
D) Home Improvement Loans
E) Loans on Dwellings For 5+ Families
F) Non-occupant Loans on < 5 Family Dwellings (A B C & D)
G) Loans On Manufactured Home Dwelling (A B C & D)
Number
Average Value
Number
Average Value
Number
Average Value
Number
Average Value
Number
Average Value
Number
Average Value
Number
Average Value
LOANS ORIGINATED
12
$147,380
407
$136,651
333
$114,633
64
$48,614
2
$1,571,020
68
$135,260
2
$129,860
APPLICATIONS APPROVED, NOT ACCEPTED
0
$0
63
$170,365
69
$115,482
12
$28,238
0
$0
6
$129,398
0
$0
APPLICATIONS DENIED
0
$0
52
$132,203
197
$132,887
15
$48,745
0
$0
4
$134,345
2
$34,435
APPLICATIONS WITHDRAWN
2
$124,405
60
$146,938
113
$115,391
8
$94,750
0
$0
8
$191,460
0
$0
FILES CLOSED FOR INCOMPLETENESS
0
$0
5
$105,714
60
$144,403
0
$0
0
$0
2
$147,570
0
$0
Aggregated Statistics For Year 2005 (Based on 2 full and 4 partial tracts)
A) FHA, FSA/RHS & VA Home Purchase Loans
B) Conventional Home Purchase Loans
C) Refinancings
D) Home Improvement Loans
E) Loans on Dwellings For 5+ Families
F) Non-occupant Loans on < 5 Family Dwellings (A B C & D)
G) Loans On Manufactured Home Dwelling (A B C & D)
Number
Average Value
Number
Average Value
Number
Average Value
Number
Average Value
Number
Average Value
Number
Average Value
Number
Average Value
LOANS ORIGINATED
17
$157,587
424
$125,585
455
$109,398
70
$49,828
11
$1,294,621
79
$132,309
3
$51,413
APPLICATIONS APPROVED, NOT ACCEPTED
0
$0
37
$138,239
67
$99,416
10
$41,024
0
$0
4
$203,370
2
$110,045
APPLICATIONS DENIED
2
$156,425
80
$131,224
172
$127,082
16
$44,240
0
$0
23
$142,761
0
$0
APPLICATIONS WITHDRAWN
0
$0
73
$150,298
130
$124,894
17
$65,774
0
$0
22
$230,247
0
$0
FILES CLOSED FOR INCOMPLETENESS
0
$0
19
$106,006
78
$126,666
2
$68,865
0
$0
0
$0
0
$0
Aggregated Statistics For Year 2004 (Based on 2 full and 4 partial tracts)
A) FHA, FSA/RHS & VA Home Purchase Loans
B) Conventional Home Purchase Loans
C) Refinancings
D) Home Improvement Loans
E) Loans on Dwellings For 5+ Families
F) Non-occupant Loans on < 5 Family Dwellings (A B C & D)
G) Loans On Manufactured Home Dwelling (A B C & D)
Number
Average Value
Number
Average Value
Number
Average Value
Number
Average Value
Number
Average Value
Number
Average Value
Number
Average Value
LOANS ORIGINATED
39
$126,964
321
$128,927
423
$102,689
53
$41,239
1
$268,270
33
$127,110
0
$0
APPLICATIONS APPROVED, NOT ACCEPTED
2
$128,880
20
$113,346
79
$101,090
7
$71,149
0
$0
2
$123,065
0
$0
APPLICATIONS DENIED
4
$106,965
39
$127,236
173
$103,432
27
$43,170
0
$0
18
$97,567
3
$44,480
APPLICATIONS WITHDRAWN
6
$110,145
69
$172,725
69
$106,588
4
$66,478
0
$0
3
$181,387
0
$0
FILES CLOSED FOR INCOMPLETENESS
2
$125,645
11
$92,354
69
$113,102
2
$93,460
0
$0
2
$147,305
0
$0
Aggregated Statistics For Year 2003 (Based on 2 full and 4 partial tracts)
A) FHA, FSA/RHS & VA Home Purchase Loans
B) Conventional Home Purchase Loans
C) Refinancings
D) Home Improvement Loans
E) Loans on Dwellings For 5+ Families
F) Non-occupant Loans on < 5 Family Dwellings (A B C & D)
Number
Average Value
Number
Average Value
Number
Average Value
Number
Average Value
Number
Average Value
Number
Average Value
LOANS ORIGINATED
14
$137,244
180
$110,666
868
$85,372
42
$19,771
9
$738,623
66
$98,297
APPLICATIONS APPROVED, NOT ACCEPTED
0
$0
18
$73,581
72
$90,276
3
$44,830
0
$0
17
$77,246
APPLICATIONS DENIED
2
$131,830
32
$104,188
221
$99,677
25
$19,743
0
$0
19
$94,098
APPLICATIONS WITHDRAWN
2
$122,975
14
$94,584
108
$99,481
2
$5,905
0
$0
5
$105,056
FILES CLOSED FOR INCOMPLETENESS
0
$0
2
$84,915
24
$91,055
0
$0
0
$0
0
$0
Aggregated Statistics For Year 2002 (Based on 2 full and 4 partial tracts)
A) FHA, FSA/RHS & VA Home Purchase Loans
B) Conventional Home Purchase Loans
C) Refinancings
D) Home Improvement Loans
E) Loans on Dwellings For 5+ Families
F) Non-occupant Loans on < 5 Family Dwellings (A B C & D)
Number
Average Value
Number
Average Value
Number
Average Value
Number
Average Value
Number
Average Value
Number
Average Value
LOANS ORIGINATED
31
$108,757
173
$90,533
530
$82,483
50
$13,841
4
$314,855
28
$82,288
APPLICATIONS APPROVED, NOT ACCEPTED
0
$0
14
$98,601
56
$81,324
2
$25,475
0
$0
2
$108,220
APPLICATIONS DENIED
0
$0
22
$77,196
120
$92,900
30
$8,296
0
$0
4
$82,680
APPLICATIONS WITHDRAWN
0
$0
25
$92,371
93
$91,153
6
$45,910
0
$0
0
$0
FILES CLOSED FOR INCOMPLETENESS
0
$0
3
$75,673
9
$107,228
0
$0
0
$0
0
$0
Aggregated Statistics For Year 2001 (Based on 2 full and 4 partial tracts)
A) FHA, FSA/RHS & VA Home Purchase Loans
B) Conventional Home Purchase Loans
C) Refinancings
D) Home Improvement Loans
E) Loans on Dwellings For 5+ Families
F) Non-occupant Loans on < 5 Family Dwellings (A B C & D)
Number
Average Value
Number
Average Value
Number
Average Value
Number
Average Value
Number
Average Value
Number
Average Value
LOANS ORIGINATED
39
$108,239
164
$87,720
497
$78,405
46
$20,973
4
$525,825
32
$76,357
APPLICATIONS APPROVED, NOT ACCEPTED
4
$90,210
9
$73,898
55
$78,947
8
$6,479
0
$0
4
$83,470
APPLICATIONS DENIED
7
$103,316
47
$63,255
120
$70,402
28
$11,651
0
$0
1
$94,030
APPLICATIONS WITHDRAWN
0
$0
10
$72,116
77
$92,251
6
$12,767
0
$0
2
$92,175
FILES CLOSED FOR INCOMPLETENESS
0
$0
10
$73,391
16
$99,081
2
$108,220
0
$0
2
$42,305
Aggregated Statistics For Year 2000 (Based on 2 full and 4 partial tracts)
A) FHA, FSA/RHS & VA Home Purchase Loans
B) Conventional Home Purchase Loans
C) Refinancings
D) Home Improvement Loans
E) Loans on Dwellings For 5+ Families
F) Non-occupant Loans on < 5 Family Dwellings (A B C & D)
Number
Average Value
Number
Average Value
Number
Average Value
Number
Average Value
Number
Average Value
Number
Average Value
LOANS ORIGINATED
29
$90,087
129
$80,894
142
$59,762
64
$15,305
5
$816,590
26
$85,474
APPLICATIONS APPROVED, NOT ACCEPTED
0
$0
19
$65,739
40
$60,162
7
$12,503
0
$0
2
$68,765
APPLICATIONS DENIED
0
$0
27
$65,936
73
$46,815
34
$18,815
2
$1,431,460
2
$9,840
APPLICATIONS WITHDRAWN
2
$84,605
6
$95,432
22
$48,711
6
$26,178
0
$0
4
$45,738
FILES CLOSED FOR INCOMPLETENESS
4
$62,550
14
$63,754
15
$77,421
0
$0
0
$0
0
$0
Aggregated Statistics For Year 1999 (Based on 2 full tracts)
A) FHA, FSA/RHS & VA Home Purchase Loans
B) Conventional Home Purchase Loans
C) Refinancings
D) Home Improvement Loans
E) Loans on Dwellings For 5+ Families
F) Non-occupant Loans on < 5 Family Dwellings (A B C & D)
2002 - 2018 National Fire Incident Reporting System (NFIRS) incidents
According to the data from the years 2002 - 2018 the average number of fires per year is 15. The highest number of fire incidents - 32 took place in 2005, and the least - 3 in 2008. The data has a rising trend.
When looking into fire subcategories, the most reports belonged to: Structure Fires (63.2%), and Outside Fires (20.9%).
Fire incident types reported to NFIRS in Zip Code 53235


 Nearest zip codes: 53110, 53207, 53172, 53204, 53202, 53221.


 According to the data from the years 2002 - 2018 the average number of fires per year is 15. The highest number of fire incidents - 32 took place in 2005, and the least - 3 in 2008. The data has a rising trend.
 When looking into fire subcategories, the most reports belonged to: Structure Fires (63.2%), and Outside Fires (20.9%).