New Orleans, LA (Louisiana) Houses and Residents
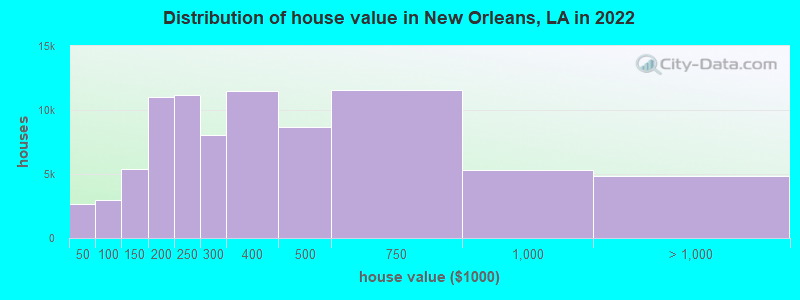
Estimated median house or condo value in 2022: $302,700 (it was $88,100 in 2000 )
New Orleans:
$302,700Louisiana:
$209,200
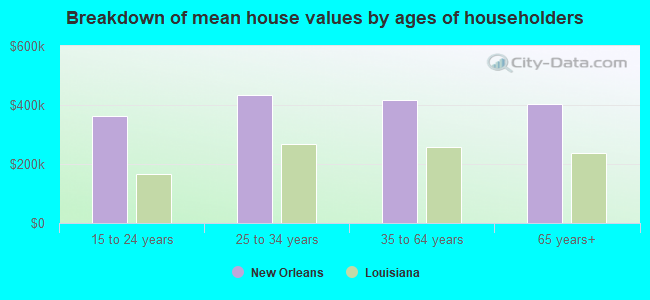
Lower value quartile - upper value quartile: $193,900 - $520,300Mean price in 2022: Detached houses: $379,667 Here:
$379,667State:
$273,555
Townhouses or other attached units: $482,780 Here:
$482,780State:
$297,713
In 2-unit structures: $407,914 Here:
$407,914State:
$325,117
In 3-to-4-unit structures: $404,361 Here:
$404,361State:
$213,088
In 5-or-more-unit structures: $544,490 Here:
$544,490State:
$257,054
Mobile homes: $89,074 Here:
$89,074State:
$89,857
Occupied boats, RVs, vans, etc.: $676,026 Here:
$676,026State:
$73,931
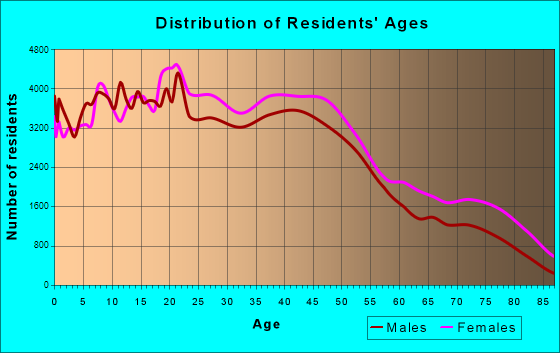
Total population: 384,320 (All urban)
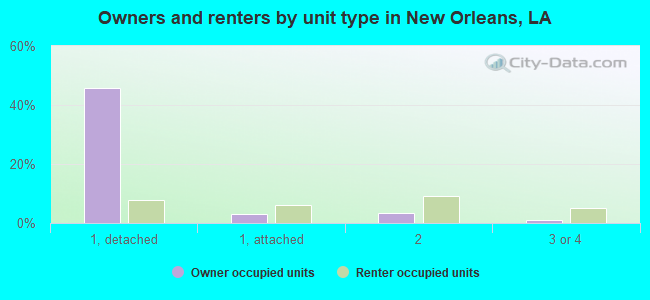
Houses: 195,626 (150,880 occupied: 83,061 owner occupied, 67,819 renter occupied )
% of renters here:
45%State:
32%
Housing density: 1,083 houses/condos per square mile
Median price asked for vacant for-sale houses and condos in 2022: $524,672.
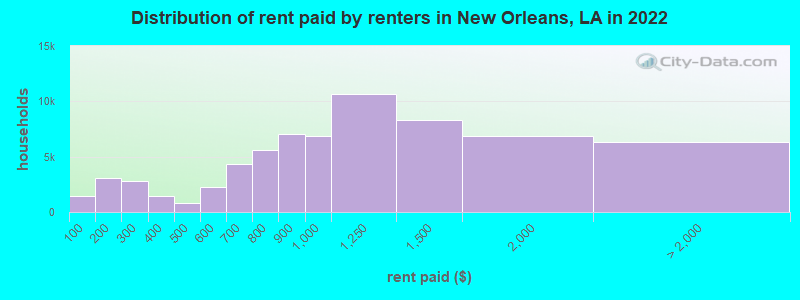
Median contract rent in 2022: $948 (lower quartile is $698, upper quartile is $1,306)
Median rent asked for vacant for-rent units in 2022: $2,024
Median gross rent in New Orleans, LA in 2022: $1,151
Housing units in New Orleans with a mortgage: 47,475 (4,639 second mortgage, 102 home equity loan, 3,119 both second mortgage and home equity loan )Houses without a mortgage: 921
Median household income for houses/condos with a mortgage: $103,465
Median household income for apartments without a mortgage: $56,089
Median monthly housing costs: $1,205
Data:
Median house or condo value ($)
Median house or condo value ($ change since 2000)
Median house or condo value ($) - White
Median house or condo value ($) - Black or African American
Median house or condo value ($) - Asian
Median house or condo value ($) - Hispanic or Latino
Median house or condo value ($) - American Indian and Alaska Native
Median house or condo value ($) - Multirace
Median house or condo value ($) - Other Race
Median price asked for mobile homes ($)
Household density (households per square mile)
Mean house or condo value by units in structure - 1, detached ($)
Mean house or condo value by units in structure - 1, attached ($)
Mean house or condo value by units in structure - 2 ($)
Mean house or condo value by units in structure by units in structure - 3 or 4 ($)
Mean house or condo value by units in structure - 5 or more ($)
Mean house or condo value by units in structure - Boat, RV, van, etc. ($)
Mean house or condo value by units in structure - Mobile home ($)
Median contract rent ($)
Median contract rent - Lower quartile ($)
Median contract rent - Upper quartile ($)
Median gross rent ($)
Urban houses (%)
Rural houses (%)
Houses occupied (%)
Houses occupied (% change since 2000)
Houses owner occupied (%)
Houses owner occupied (% change since 2000)
Houses renter occupied (%)
Houses renter occupied (% change since 2000)
Vacant housing units - For rent (%)
Vacant housing units - For rent (% change since 2000)
Vacant housing units - For sale only (%)
Vacant housing units - For sale only (% change since 2000)
Vacant housing units - Rented or sold, not occupied (%)
Vacant housing units - Rented or sold, not occupied (% change since 2000)
Vacant housing units - For seasonal, recreational, or occasional use (%)
Vacant housing units - For seasonal, recreational, or occasional use (% change since 2000)
Vacant housing units - For migrant workers (%)
Vacant housing units - For migrant workers (% change since 2000)
Vacant housing units - Other vacant (%)
Vacant housing units - Other vacant (% change since 2000)
Median monthly housing costs ($)
Median household income for houses/condos with a mortgage ($)
Median household income for houses/condos without a mortgage ($)
Median household income ($)
Median household income ($) - White
Median household income ($) - Black or African American
Median household income ($) - Asian
Median household income ($) - Hispanic or Latino
Median household income ($) - American Indian and Alaska Native
Median household income ($) - Multirace
Median household income ($) - Other Race
Mortgage status - with mortgage (%)
Mortgage status - with second mortgage (%)
Mortgage status - with home equity loan (%)
Mortgage status - with both second mortgage and home equity loan (%)
Mortgage status - without a mortgage (%)
Median year house/condo built
Median year apartment built
Household type by relationship - Male householder living alone (%)
Household type by relationship - Male householder not living alone (%)
Household type by relationship - Female householder living alone (%)
Household type by relationship - Female householder not living alone (%)
Household type by relationship - Opposite-Sex spouse (%)
Household type by relationship - Same-Sex spouse (%)
Household type by relationship - Opposite-Sex unmarried partner (%)
Household type by relationship - Same-Sex unmarried partner (%)
Household type by relationship - In group quarters (%)
Size of family households - 2-person household (%)
Size of family households - 3-person household (%)
Size of family households - 4-person household (%)
Size of family households - 5-person household (%)
Size of family households - 6-person household (%)
Size of family households - 7-or-more-person household (%)
Size of nonfamily households - 1-person household (%)
Size of nonfamily households - 2-person household (%)
Size of nonfamily households - 3-person household (%)
Size of nonfamily households - 4-person household (%)
Size of nonfamily households - 5-person household (%)
Size of nonfamily households - 6-person household (%)
Size of nonfamily households - 7-or-moreperson household (%)
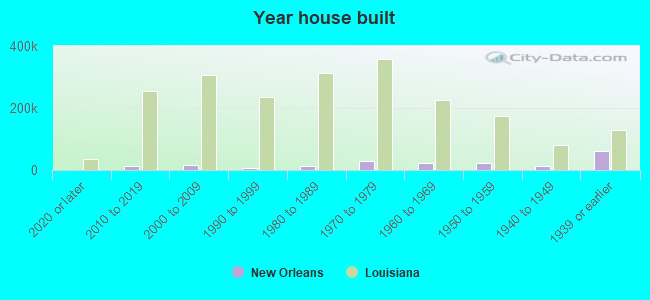
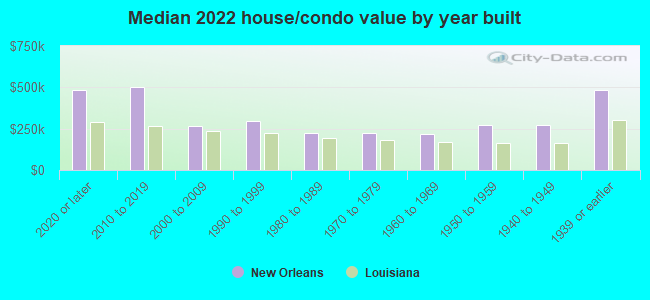
Year house built - Built 2010 or later (%)
Year house built - Built 2000 to 2009 (%)
Year house built - Built 1990 to 1999 (%)
Year house built - Built 1980 to 1989 (%)
Year house built - Built 1970 to 1979 (%)
Year house built - Built 1960 to 1969 (%)
Year house built - Built 1950 to 1959 (%)
Year house built - Built 1940 to 1949 (%)
Year house built - Built 1939 or earlier (%)
Median number of rooms in houses and condos
Median number of rooms in apartments
Median number of bedrooms in owner occupied houses
Mean number of bedrooms in owner occupied houses
Median number of bedrooms in renter occupied houses
Mean number of bedrooms in renter occupied houses
Median number of vehichles in owner occupied houses
Mean number of vehichles in owner occupied houses
Median number of vehichles in renter occupied houses
Mean number of vehichles in renter occupied houses
Rooms in owner-occupied houses - 1 room (%)
Rooms in owner-occupied houses - 2 rooms (%)
Rooms in owner-occupied houses - 3 rooms (%)
Rooms in owner-occupied houses - 4 rooms (%)
Rooms in owner-occupied houses - 5 rooms (%)
Rooms in owner-occupied houses - 6 rooms (%)
Rooms in owner-occupied houses - 7 rooms (%)
Rooms in owner-occupied houses - 8 rooms (%)
Rooms in owner-occupied houses - 9+ rooms (%)
Rooms in renter-occupied houses - 1 room (%)
Rooms in renter-occupied houses - 2 rooms (%)
Rooms in renter-occupied houses - 3 rooms (%)
Rooms in renter-occupied houses - 4 rooms (%)
Rooms in renter-occupied houses - 5 rooms (%)
Rooms in renter-occupied houses - 6 rooms (%)
Rooms in renter-occupied houses - 7 rooms (%)
Rooms in renter-occupied houses - 8 rooms (%)
Rooms in renter-occupied houses - 9+ rooms (%)
Bedrooms in owner-occupied houses - no bedrooms (%)
Bedrooms in owner-occupied houses - 1 bedroom (%)
Bedrooms in owner-occupied houses - 2 bedrooms (%)
Bedrooms in owner-occupied houses - 3 bedrooms (%)
Bedrooms in owner-occupied houses - 4 bedrooms (%)
Bedrooms in owner-occupied houses - 5+ bedrooms (%)
Bedrooms in renter-occupied houses - no bedrooms (%)
Bedrooms in renter-occupied houses - 1 bedroom (%)
Bedrooms in renter-occupied houses - 2 bedrooms (%)
Bedrooms in renter-occupied houses - 3 bedrooms (%)
Bedrooms in renter-occupied houses - 4 bedrooms (%)
Bedrooms in renter-occupied houses - 5+ bedrooms (%)
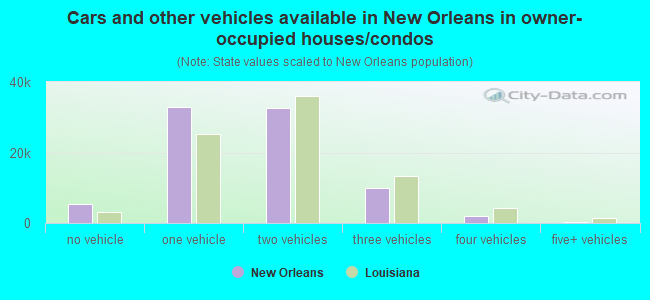
Vehicles available in owner-occupied houses - no vehicle available (%)
Vehicles available in owner-occupied houses - 1 vehicle available(%)
Vehicles available in owner-occupied houses - 2 Vehicles available (%)
Vehicles available in owner-occupied houses - 3 Vehicles available (%)
Vehicles available in owner-occupied houses - 4 Vehicles available (%)
Vehicles available in owner-occupied houses - 5+ Vehicles available (%)
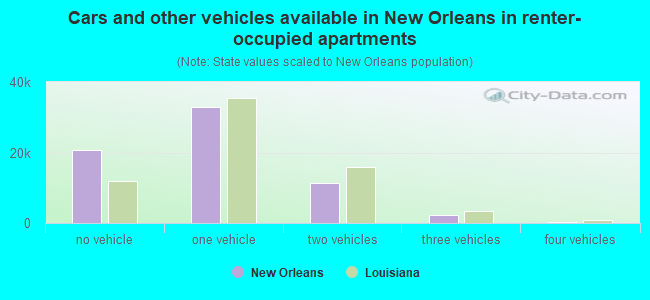
Vehicles available in renter-occupied houses - no vehicle available (%)
Vehicles available in renter-occupied houses - 1 vehicle available (%)
Vehicles available in renter-occupied houses - 2 Vehicles available (%)
Vehicles available in renter-occupied houses - 3 Vehicles available (%)
Vehicles available in renter-occupied houses - 4 Vehicles available (%)
Vehicles available in renter-occupied houses - 5+ Vehicles available (%)
Housing units in structures - 1, detached (%)
Housing units in structures - 1, attached (%)
Housing units in structures - 2 (%)
Housing units in structures - 3 or 4 (%)
Housing units in structures - 5 to 9 (%)
Housing units in structures - 10 to 19 (%)
Housing units in structures - 20 to 49 (%)
Housing units in structures - 50 or more (%)
Housing units in structures - Mobile home (%)
Housing units in structures - Boat, RV, van, etc. (%)
Housing units in structures - Owners - 1, detached (%)
Housing units in structures - Owners - 1, attached (%)
Housing units in structures - Owners - 2 (%)
Housing units in structures - Owners - 3 or 4 (%)
Housing units in structures - Owners - 5 to 9 (%)
Housing units in structures - Owners - 10 to 19 (%)
Housing units in structures - Owners - 20 to 49 (%)
Housing units in structures - Owners - 50 or more (%)
Housing units in structures - Owners - Mobile home (%)
Housing units in structures - Owners - Boat, RV, van, etc. (%)
Housing units in structures - Renters - 1, detached (%)
Housing units in structures - Renters - 1, attached (%)
Housing units in structures - Renters - 2 (%)
Housing units in structures - Renters - 3 or 4 (%)
Housing units in structures - Renters - 5 to 9 (%)
Housing units in structures - Renters - 10 to 19 (%)
Housing units in structures - Renters - 20 to 49 (%)
Housing units in structures - Renters - 50 or more (%)
Housing units in structures - Renters - Mobile home (%)
Housing units in structures - Renters - Boat, RV, van, etc. (%)
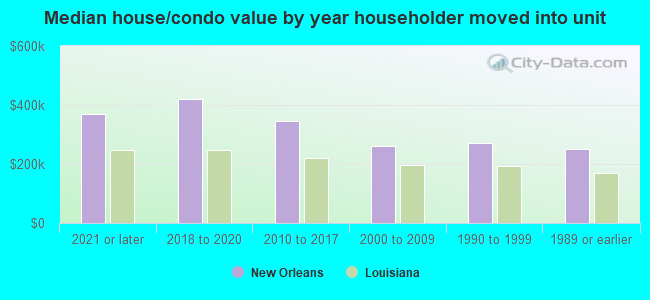
House/condo owner moved in on average (years ago)
Renter moved in on average (years ago)
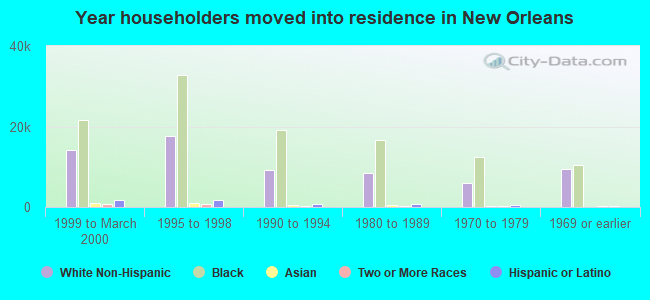
Year householder moved into unit - Moved in 1999 to March 2000 (%)
Year householder moved into unit - Moved in 1999 to March 2000 (%) - White
Year householder moved into unit - Moved in 1999 to March 2000 (%) - Black or African American
Year householder moved into unit - Moved in 1999 to March 2000 (%) - Asian
Year householder moved into unit - Moved in 1999 to March 2000 (%) - Hispanic or Latino
Year householder moved into unit - Moved in 1999 to March 2000 (%) - American Indian and Alaska Native
Year householder moved into unit - Moved in 1999 to March 2000 (%) - Multirace
Year householder moved into unit - Moved in 1999 to March 2000 (%) - Other Race
Year householder moved into unit - Moved in 1995 to 1998 (%)
Year householder moved into unit - Moved in 1995 to 1998 (%) - White
Year householder moved into unit - Moved in 1995 to 1998 (%) - Black or African American
Year householder moved into unit - Moved in 1995 to 1998 (%) - Asian
Year householder moved into unit - Moved in 1995 to 1998 (%) - Hispanic or Latino
Year householder moved into unit - Moved in 1995 to 1998 (%) - American Indian and Alaska Native
Year householder moved into unit - Moved in 1995 to 1998 (%) - Multirace
Year householder moved into unit - Moved in 1995 to 1998 (%) - Other Race
Year householder moved into unit - Moved in 1990 to 1994 (%)
Year householder moved into unit - Moved in 1990 to 1994 (%) - White
Year householder moved into unit - Moved in 1990 to 1994 (%) - Black or African American
Year householder moved into unit - Moved in 1990 to 1994 (%) - Asian
Year householder moved into unit - Moved in 1990 to 1994 (%) - Hispanic or Latino
Year householder moved into unit - Moved in 1990 to 1994 (%) - American Indian and Alaska Native
Year householder moved into unit - Moved in 1990 to 1994 (%) - Multirace
Year householder moved into unit - Moved in 1990 to 1994 (%) - Other Race
Year householder moved into unit - Moved in 1980 to 1989 (%)
Year householder moved into unit - Moved in 1980 to 1989 (%) - White
Year householder moved into unit - Moved in 1980 to 1989 (%) - Black or African American
Year householder moved into unit - Moved in 1980 to 1989 (%) - Asian
Year householder moved into unit - Moved in 1980 to 1989 (%) - Hispanic or Latino
Year householder moved into unit - Moved in 1980 to 1989 (%) - American Indian and Alaska Native
Year householder moved into unit - Moved in 1980 to 1989 (%) - Multirace
Year householder moved into unit - Moved in 1980 to 1989 (%) - Other Race
Year householder moved into unit - Moved in 1970 to 1979 (%)
Year householder moved into unit - Moved in 1970 to 1979 (%) - White
Year householder moved into unit - Moved in 1970 to 1979 (%) - Black or African American
Year householder moved into unit - Moved in 1970 to 1979 (%) - Asian
Year householder moved into unit - Moved in 1970 to 1979 (%) - Hispanic or Latino
Year householder moved into unit - Moved in 1970 to 1979 (%) - American Indian and Alaska Native
Year householder moved into unit - Moved in 1970 to 1979 (%) - Multirace
Year householder moved into unit - Moved in 1970 to 1979 (%) - Other Race
Year householder moved into unit - Moved in 1969 or earlier (%)
Year householder moved into unit - Moved in 1969 or earlier (%) - White
Year householder moved into unit - Moved in 1969 or earlier (%) - Black or African American
Year householder moved into unit - Moved in 1969 or earlier (%) - Asian
Year householder moved into unit - Moved in 1969 or earlier (%) - Hispanic or Latino
Year householder moved into unit - Moved in 1969 or earlier (%) - American Indian and Alaska Native
Year householder moved into unit - Moved in 1969 or earlier (%) - Multirace
Year householder moved into unit - Moved in 1969 or earlier (%) - Other Race
Housing units lacking complete plumbing facilities (%)
Housing units lacking complete kitchen facilities (%)
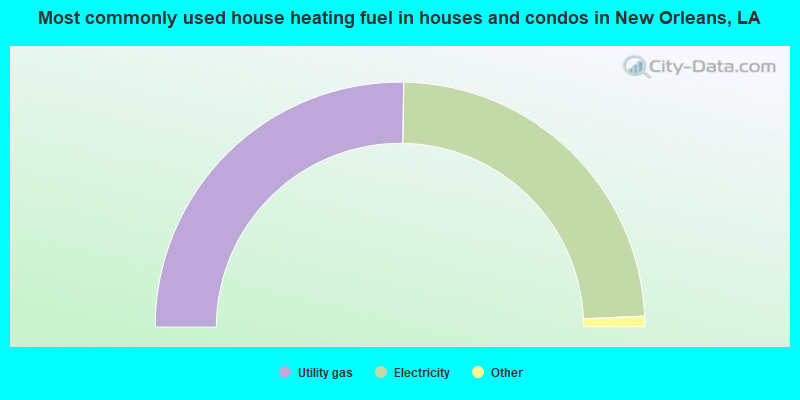
House heating fuel used in houses and condos - Utility gas (%)
House heating fuel used in houses and condos - Bottled, tank, or LP gas (%)
House heating fuel used in houses and condos - Electricity (%)
House heating fuel used in houses and condos - Fuel oil, kerosene, etc. (%)
House heating fuel used in houses and condos - Coal or coke (%)
House heating fuel used in houses and condos - Wood (%)
House heating fuel used in houses and condos - Solar energy (%)
House heating fuel used in houses and condos - Other fuel (%)
House heating fuel used in houses and condos - No fuel used (%)
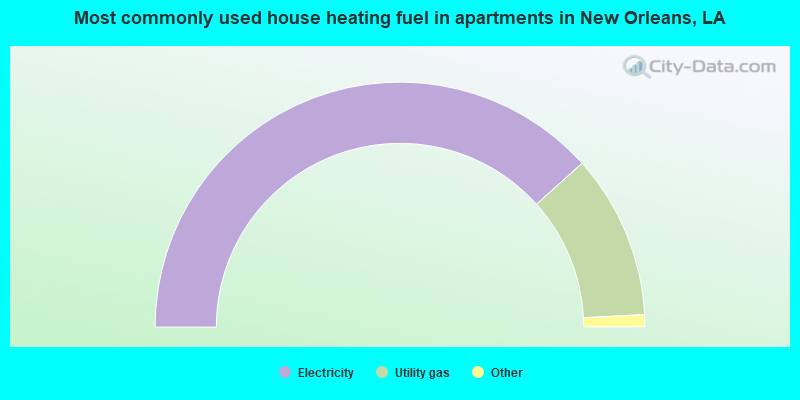
House heating fuel used in apartments - Utility gas (%)
House heating fuel used in apartments - Bottled, tank, or LP gas (%)
House heating fuel used in apartments - Electricity (%)
House heating fuel used in apartments - Fuel oil, kerosene, etc. (%)
House heating fuel used in apartments - Coal or coke (%)
House heating fuel used in apartments - Wood (%)
House heating fuel used in apartments - Solar energy (%)
House heating fuel used in apartments - Other fuel (%)
House heating fuel used in apartments - No fuel used (%)
Median year house/condo built: 1960Median year apartment built: 1967Household type by relationship:
Households: 369,749
Male householders: 61,828 (26,969 living alone ), Female householders: 89,052 (35,151 living alone )45,500 spouses (44,437 opposite-sex spouses ), 10,820 unmarried partners , (9,175 opposite-sex unmarried partners ), 101,114 children (96,109 natural , 2,686 adopted , 2,319 stepchildren ), 15,191 grandchildren , 6,505 brothers or sisters , 4,076 parents , 0 foster children , 7,108 other relatives , 15,002 non-relatives In group quarters: 13,553
Size of family households: 36,652 2-persons , 19,619 3-persons , 11,928 4-persons , 5,245 5-persons , 2,228 6-persons , 835 7-or-more-persons .
Size of nonfamily households: 62,120 1-person , 10,296 2-persons , 1,231 3-persons , 242 4-persons , 184 5-persons , 150 6-persons , 150 7-or-more-persons .
29,734 married couples with children. single-parent households (3,276 men , 25,928 women ).
91.5% of residents of New Orleans speak English at home. of residents speak Spanish at home (67% speak English very well , 16% speak English well , 10% speak English not well , 7% don't speak English at all ).of residents speak other Indo-European language at home (85% speak English very well , 10% speak English well , 3% speak English not well , 2% don't speak English at all ).of residents speak Asian or Pacific Island language at home (65% speak English very well , 17% speak English well , 15% speak English not well , 2% don't speak English at all ).of residents speak other language at home (64% speak English very well , 20% speak English well , 15% speak English not well , 1% don't speak English at all ).
Foreign born population: 22,058 (6.0%)of them are naturalized citizens )
Median number of rooms in houses and condos:
Median number of rooms in apartments
Owner-occupied Renter-occupied
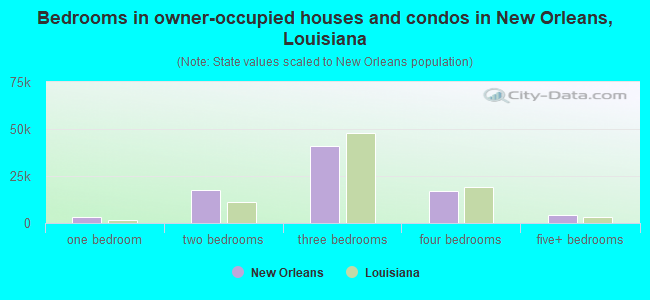
Bedrooms in owner-occupied houses and condos in New Orleans, Louisiana
54 no bedroom 3,147 1 bedroom 17,616 2 bedrooms 40,836 3 bedrooms 17,141 4 bedrooms 4,267 5+ bedrooms
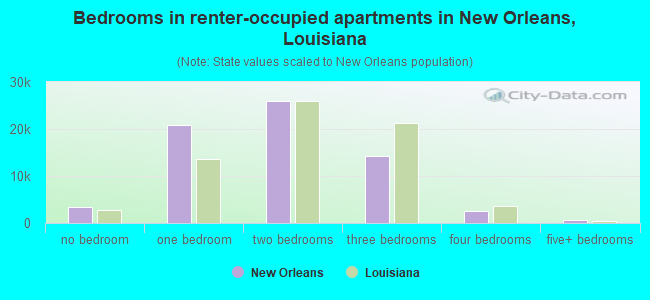
Bedrooms in renter-occupied apartments in New Orleans, Louisiana
3,475 no bedroom 20,948 1 bedroom 26,022 2 bedrooms 14,329 3 bedrooms 2,455 4 bedrooms 590 5+ bedrooms
Owner-occupied Renter-occupied
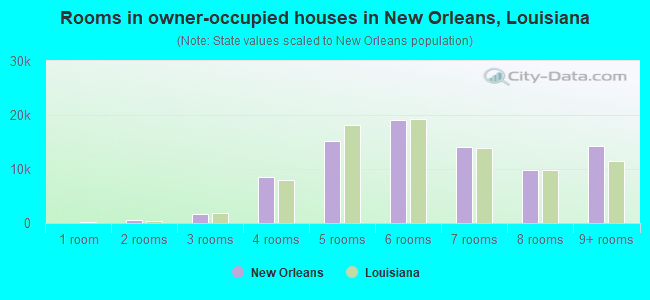
Rooms in owner-occupied houses in New Orleans, Louisiana
54 1 room 598 2 rooms 1,648 3 rooms 8,506 4 rooms 15,175 5 rooms 19,004 6 rooms 14,047 7 rooms 9,824 8 rooms 14,205 9+ rooms
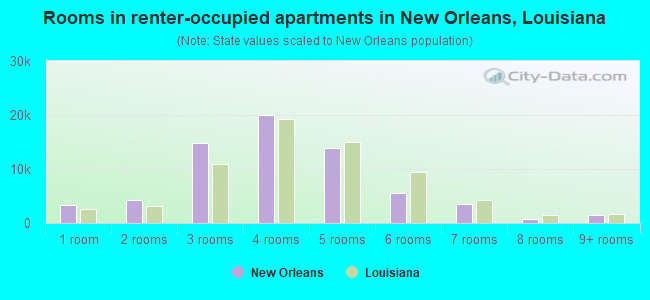
Rooms in renter-occupied apartments in New Orleans, Louisiana
3,391 1 room 4,341 2 rooms 14,848 3 rooms 19,944 4 rooms 13,878 5 rooms 5,572 6 rooms 3,524 7 rooms 811 8 rooms 1,510 9+ rooms
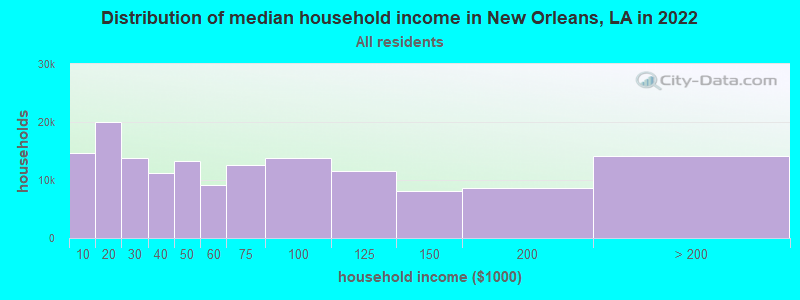
New Orleans, LA household income distribution 14,602 Less than $10,00019,981 $10,000 to $19,99913,850 $20,000 to $29,99911,272 $30,000 to $39,99913,211 $40,000 to $49,9999,217 $50,000 to $59,99912,625 $60,000 to $74,99913,858 $75,000 to $99,99911,502 $100,000 to $124,9998,063 $125,000 to $149,9998,570 $150,000 to $199,99914,129 $200,000 or more
Home value of owner - occupied houses in 2022 in New Orleans, LA 1,064 Less than $10,000189 $10,000 to $14,999485 $15,000 to $19,999404 $20,000 to $24,99979 $25,000 to $29,999264 $30,000 to $34,999103 $35,000 to $39,99995 $40,000 to $49,999194 $50,000 to $59,999758 $60,000 to $69,999636 $70,000 to $79,999665 $80,000 to $89,999630 $90,000 to $99,9993,146 $100,000 to $124,9992,236 $125,000 to $149,9995,979 $150,000 to $174,9995,073 $175,000 to $199,99911,190 $200,000 to $249,9998,035 $250,000 to $299,99911,465 $300,000 to $399,9998,663 $400,000 to $499,99911,585 $500,000 to $749,9995,286 $750,000 to $999,9993,093 $1,000,000 to $1,499,999808 $1,500,000 to $1,999,999936 $2,000,000 or moreRent paid by renters in 2022 in New Orleans, LA 1,432 Less than $100619 $100 to $1492,448 $150 to $1992,045 $200 to $249781 $250 to $299685 $300 to $349800 $350 to $399373 $400 to $449426 $450 to $4991,605 $500 to $549658 $550 to $5991,597 $600 to $6492,702 $650 to $6992,590 $700 to $7492,979 $750 to $7997,050 $800 to $8996,883 $900 to $99910,632 $1,000 to $1,2498,306 $1,250 to $1,4996,889 $1,500 to $1,9991,886 $2,000 to $2,499384 $2,500 to $2,999271 $3,000 to $3,499162 $3,500 or more3,616 No cash rent
Percentage of workers working in this county: 78.2%Number of people working at home: 23,881 (14.1% of all workers )
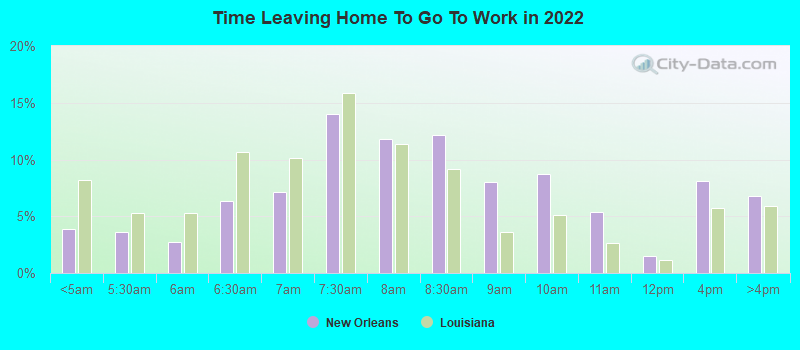
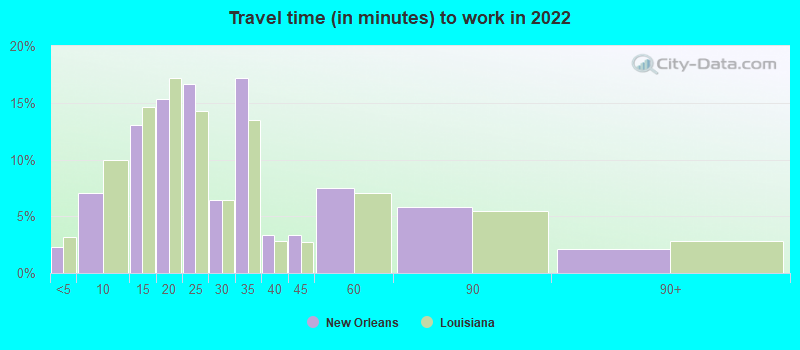
Travel time to work (commute)
Less than 5 minutes: 4,0245 to 9 minutes: 12,50010 to 14 minutes: 23,32115 to 19 minutes: 28,82120 to 24 minutes: 25,73225 to 29 minutes: 10,22430 to 34 minutes: 20,75735 to 39 minutes: 4,31640 to 44 minutes: 2,25745 to 59 minutes: 6,27260 to 89 minutes: 3,95490 or more minutes: 3,093
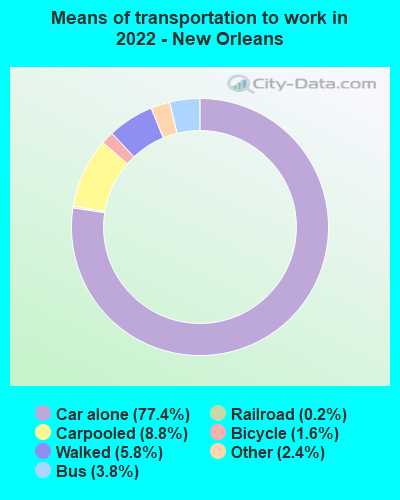
Means of transportation to work:
Drove a car alone: 155,417 (69.1%)Carpooled: 17,705 (7.9%)Bus : 7,569 (3.4%)Subway or elevated rail : 177 (0.1%)Long-distance train or commuter rail : 125 (0.1%)Light rail, streetcar or trolley : 411 (0.2%)Taxi: 4,730 (2.1%)Bicycle: 3,219 (1.4%)Walked: 11,565 (5.1%)Worked at home: 23,881 (10.6%)
Unemployment by race in 2022
Unemployment rate for White non-Hispanic residents 4.9% Males4.3% FemalesUnemployment rate for Black residents 9.3% Males9.8% FemalesUnemployment rate for American Indian and Alaska Native residents 0.5% Males5.3% FemalesUnemployment rate for Asian residents 1.6% Males4.6% FemalesUnemployment rate for other race residents 1.9% Males16.1% FemalesUnemployment rate for two or more race residents 3.6% Males3.0% FemalesUnemployment rate for Hispanic or Latino residents 3.6% Males2.9% Females
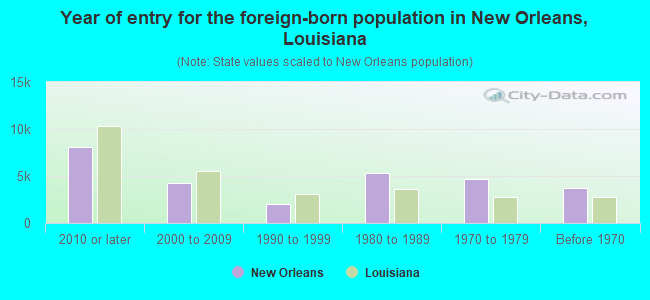
Year of entry for the foreign-born population in New Orleans, Louisiana
8,114 2010 or later 4,260 2000 to 2009 2,020 1990 to 1999 5,329 1980 to 1989 4,681 1970 to 1979 3,686 Before 1970
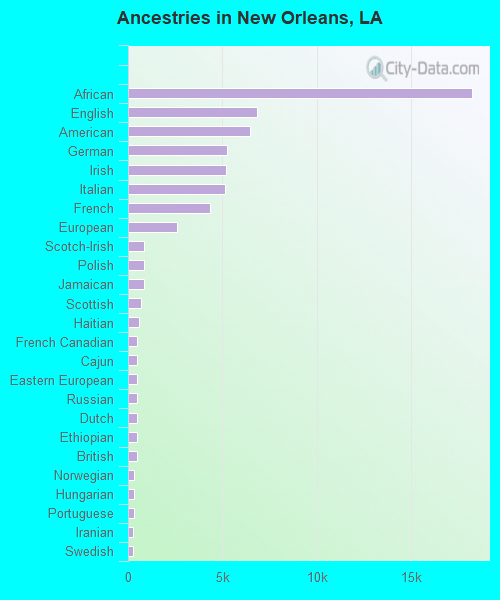
First ancestries reported:
African: 18,235 (7.6%)
English: 6,844 (2.8%)
American: 6,476 (2.7%)
German: 5,255 (2.2%)
Irish: 5,189 (2.2%)
Italian: 5,139 (2.1%)
French: 4,373 (1.8%)
European: 2,623 (1.1%)
Scotch-Irish: 870 (0.4%)
Polish: 840 (0.3%)
Jamaican: 833 (0.3%)
Scottish: 692 (0.3%)
Haitian: 599 (0.2%)
French Canadian: 500 (0.2%)
Cajun: 488 (0.2%)
Eastern European: 487 (0.2%)
Russian: 481 (0.2%)
Dutch: 479 (0.2%)
Ethiopian: 477 (0.2%)
British: 458 (0.2%)
Norwegian: 311 (0.1%)
Hungarian: 301 (0.1%)
Portuguese: 296 (0.1%)
Iranian: 276 (0.1%)
Swedish: 274 (0.1%)
Nigerian: 270 (0.1%)
Greek: 263 (0.1%)
West Indian: 236 (0.10%)
Lebanese: 209 (0.09%)
Canadian: 198 (0.08%)
Scandinavian: 178 (0.07%)
Turkish: 167 (0.07%)
Romanian: 159 (0.07%)
Welsh: 157 (0.07%)
Northern European: 131 (0.05%)
Croatian: 125 (0.05%)
Danish: 115 (0.05%)
Israeli: 112 (0.05%)
Swiss: 91 (0.04%)
Palestinian: 87 (0.04%)
Ukrainian: 84 (0.03%)
Brazilian: 78 (0.03%)
Basque: 68 (0.03%)
Armenian: 59 (0.02%)
Latvian: 58 (0.02%)
Belgian: 57 (0.02%)
Albanian: 54 (0.02%)
Barbadian: 52 (0.02%)
Finnish: 52 (0.02%)
Yugoslavian: 49 (0.02%)
Belizean: 48 (0.02%)
Trinidadian and Tobagonian: 44 (0.02%)
Senegalese: 42 (0.02%)
Zimbabwean: 39 (0.02%)
Lithuanian: 38 (0.02%)
Czech: 37 (0.02%)
Kenyan: 36 (0.01%)
Arab: 35 (0.01%)
Syrian: 29 (0.01%)
Austrian: 28 (0.01%)
Moroccan: 27 (0.01%)
Bulgarian: 24 (0.01%)
South African: 23 (0.01%)
Macedonian: 20 (0.01%)
Guyanese: 20 (0.01%)
Pennsylvania German: 19 (0.01%)
Maltese: 16 (0.01%)
Slavic: 14 (0.01%)
U.S. Virgin Islander: 14 (0.01%)
Most common places of birth for foreign-born residents (%): Honduras New Orleans:
19.9% (4,307)Louisiana:
18.9% (37,225)
Vietnam New Orleans:
15.8% (3,419)Louisiana:
9.2% (18,115)
Mexico New Orleans:
5.6% (1,217)Louisiana:
12.1% (23,732)
China, excluding Hong Kong and Taiwan New Orleans:
4.7% (1,022)Louisiana:
3.4% (6,779)
Guatemala New Orleans:
3.5% (751)Louisiana:
2.8% (5,576)
India New Orleans:
3.2% (693)Louisiana:
3.9% (7,741)
Canada New Orleans:
2.8% (611)Louisiana:
1.5% (2,933)
Jamaica New Orleans:
2.6% (552)Louisiana:
0.7% (1,460)
Brazil New Orleans:
1.9% (414)Louisiana:
1.5% (2,923)
Cuba New Orleans:
1.9% (411)Louisiana:
3.1% (6,172)
Korea New Orleans:
1.9% (410)Louisiana:
1.0% (1,951)
Philippines New Orleans:
1.9% (402)Louisiana:
3.1% (6,086)
Nicaragua New Orleans:
1.9% (401)Louisiana:
2.1% (4,115)
Colombia New Orleans:
1.7% (374)Louisiana:
1.0% (1,918)
Place of birth for U.S.-born residents:
This state: 252,815Other state: 92,206Northeast: 17,747Midwest: 17,882South: 43,648West: 12,929 89.0% of New Orleans residents lived in the same house 1 years ago.
Out of people who lived in different houses, 36.5% lived in this county.
Out of people who lived in different counties, 49.1% lived in Louisiana.
New Orleans:
89.0%State average:
88.3%
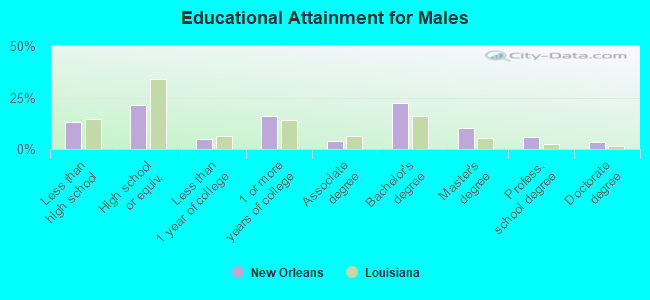
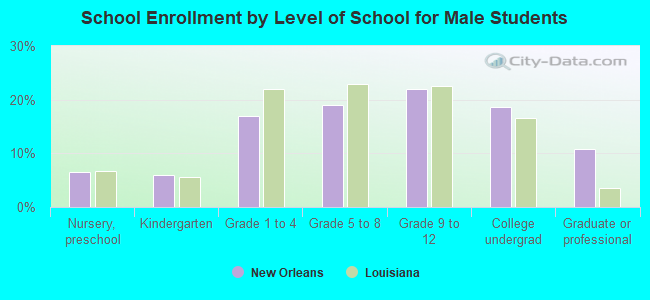
Education attainment for males 25 years and older:
No schooling: 2,612Nursery to 4th grade: 7225th and 6th grade: 1,1567th and 8th grade: 6789th grade: 1,36910th grade: 3,73711th grade: 3,38412th grade, no diploma: 2,056High school graduate (or equivalency): 26,035Less than 1 year of college: 6,058Some college more than 1 year, no degree: 19,246Associate degree: 4,757Bachelor's degree: 27,116Master's degree: 12,224Professional school degree: 6,948Doctorate degree: 3,856
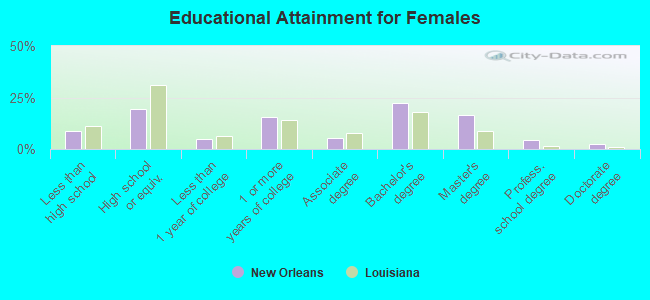
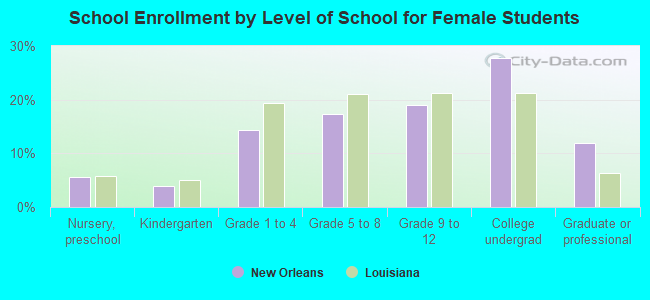
Education attainment for females 25 years and older:
No schooling: 1,145Nursery to 4th grade: 3045th and 6th grade: 8637th and 8th grade: 1,1979th grade: 74110th grade: 2,34511th grade: 3,69712th grade, no diploma: 2,408High school graduate (or equivalency): 27,443Less than 1 year of college: 6,923Some college more than 1 year, no degree: 22,082Associate degree: 7,909Bachelor's degree: 31,373Master's degree: 23,361Professional school degree: 6,522Doctorate degree: 3,446
Housing units in structures:
One, detached: 91,293One, attached: 16,514Two: 30,3403 or 4: 14,7825 to 9: 9,32010 to 19: 8,66320 to 49: 8,58650 or more: 15,104Mobile homes: 820Boats, RVs, vans, etc.: 204Median worth of mobile homes: $41,365
Housing units lacking complete plumbing facilities in 2022: 4.0%Housing units lacking complete kitchen facilities in 2022: 4.7%House/condo owner moved in on average 14 years ago
Renter moved in on average 3 years ago
Private vs. public school enrollment:
Students in private schools in grades 1 to 8 (elementary and middle school): 6,399 Here:
20.4%Louisiana:
19.6%
Students in private schools in grades 9 to 12 (high school): 4,169 Here:
22.0%Louisiana:
18.3%
Students in private undergraduate colleges: 13,884 Here:
63.4%Louisiana:
17.4%