Penndel, PA (Pennsylvania) Houses and Residents
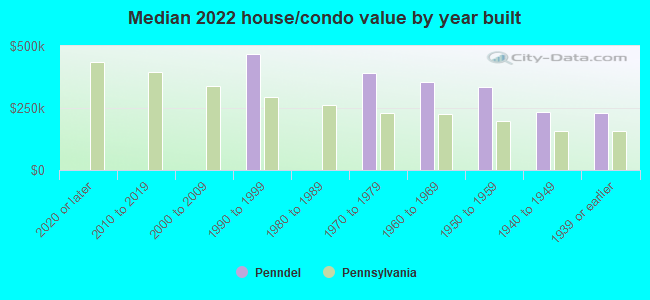
| Penndel: | $336,016 |
| Pennsylvania: | $245,500 |
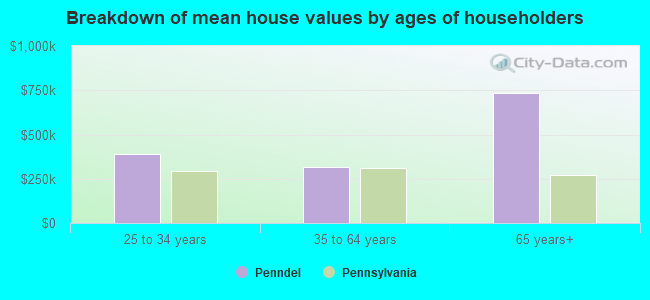
Mean price in 2022:
Detached houses: $397,780
Here: $397,780 State: $317,202 Townhouses or other attached units: $202,627
Here: $202,627 State: $254,369
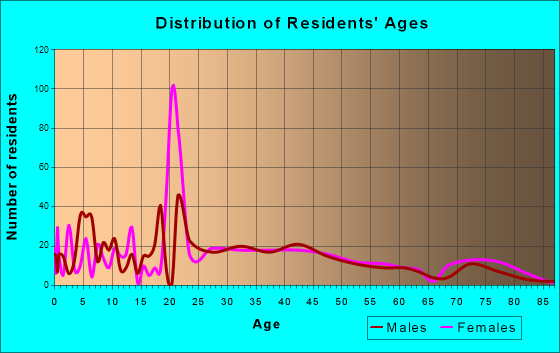
Total population: 2,249 (All urban)
Houses: 1,091 (1,021 occupied: 456 owner occupied, 575 renter occupied)
| % of renters here: | 56% |
| State: | 31% |
Housing density: 2,498 houses/condos per square mile
Median price asked for vacant for-sale houses and condos in 2022 in this county: $426,803.
Median contract rent in 2022: $1,322 (lower quartile is $1,138, upper quartile is $1,437)
Median rent asked for vacant for-rent units in 2022: $2,750
Median gross rent in Penndel, PA in 2022: $1,356
Housing units in Penndel with a mortgage: 366 (52 second mortgage, 12 home equity loan, 34 both second mortgage and home equity loan)
Houses without a mortgage: 104
Median household income for houses/condos with a mortgage: $134,129
Median household income for apartments without a mortgage: $107,937
Median monthly housing costs: $1,364
Compare current foreclosures near Penndel, PA:
| Photo | Address | Area | Beds / Baths | Price | Details |
|---|---|---|---|---|---|

|
#1
N 10th St
Philadelphia, PA 19141
|
1,154 sq. feet
|
2 baths 2 beds |
$78,000
|
show details |

|
#2
Harvey Ave
Pennsauken, NJ 08110
|
1,555 sq. feet
|
2 baths 4 beds |
$429,900
|
show details |

|
#3
Foxglove Dr
Riverside, NJ 08075
|
840 sq. feet
|
1 baths 2 beds |
$113,683
|
show details |

|
#4
N 5th St
Philadelphia, PA 19126
|
1,420 sq. feet
|
2 baths 3 beds |
$313,900
|
show details |

|
#5
N Cedar St
Bristol, PA 19007
|
841 sq. feet
|
1 baths 1 beds |
$315,500
|
show details |

|
#6
Moore Ct
Pennington, NJ 08534
|
940 sq. feet
|
1 baths 2 beds |
$195,993
|
show details |

|
#7
Bunker Hill Ave
Trenton, NJ 08648
|
840 sq. feet
|
1 baths 2 beds |
$275,000
|
show details |

|
#8
Brunswick Ave
Trenton, NJ 08618
|
1,088 sq. feet
|
1 baths 2 beds |
$68,500
|
show details |

|
#9
Elliston Cir
Philadelphia, PA 19114
|
897 sq. feet
|
1 baths 2 beds |
$187,900
|
show details |

|
#10
Princeton Ave
Philadelphia, PA 19149
|
1,224 sq. feet
|
1 baths 3 beds |
$215,000
|
show details |
| Photo | Address | Area | Beds / Baths | Price | Details |
|---|---|---|---|---|---|

|
#11
N Forklanding Rd
Maple Shade, NJ 08052
|
1,450 sq. feet
|
1 baths 3 beds |
$259,900
|
show details |

|
#12
Manchester Rd
Elkins Park, PA 19027
|
3,444 sq. feet
|
2 baths 3 beds |
$570,000
|
show details |

|
#13
W Duval St
Philadelphia, PA 19144
|
810 sq. feet
|
1 baths 3 beds |
$159,020
|
show details |

|
#14
Stenton Ave
Philadelphia, PA 19138
|
1,256 sq. feet
|
1 baths 3 beds |
$214,722
|
show details |

|
#15
Temple Rd
Philadelphia, PA 19150
|
1,177 sq. feet
|
2 baths 3 beds |
$137,850
|
show details |

|
#16
Tulpehocken St
Philadelphia, PA 19138
|
1,840 sq. feet
|
1 baths 3 beds |
$185,991
|
show details |

|
#17
Magnolia St
Philadelphia, PA 19144
|
1,200 sq. feet
|
1 baths 3 beds |
$20,792
|
show details |

|
#18
Pickering St
Philadelphia, PA 19150
|
1,170 sq. feet
|
1 baths 3 beds |
$169,900
|
show details |

|
#19
Guilford St
Philadelphia, PA 19136
|
1,408 sq. feet
|
1 baths 3 beds |
$47,700
|
show details |

|
#20
Knights Bridge Dr
Morrisville, PA 19067
|
2,896 sq. feet
|
2 baths 4 beds |
$596,172
|
show details |
| Photo | Address | Area | Beds / Baths | Price | Details |
|---|---|---|---|---|---|

|
#21
W Clapier St
Philadelphia, PA 19144
|
1,314 sq. feet
|
1 baths 3 beds |
$60,103
|
show details |

|
#22
N 8th St
Philadelphia, PA 19120
|
1,464 sq. feet
|
1 baths 3 beds |
$63,953
|
show details |

|
#23
N 10th St
Philadelphia, PA 19141
|
1,664 sq. feet
|
1 baths 4 beds |
$232,227
|
show details |

|
#24
Fairfield St
Philadelphia, PA 19152
|
1,628 sq. feet
|
1 baths 4 beds |
$203,591
|
show details |

|
#25
Rawle St
Philadelphia, PA 19149
|
1,152 sq. feet
|
1 baths 3 beds |
$40,900
|
show details |

|
#26
73rd Ave
Philadelphia, PA 19138
|
1,092 sq. feet
|
1 baths 3 beds |
$213,640
|
show details |

|
#27
E Pacific St
Philadelphia, PA 19134
|
1,245 sq. feet
|
1 baths 3 beds |
$48,772
|
show details |

|
#28
E Cliveden St
Philadelphia, PA 19119
|
1,456 sq. feet
|
1 baths 3 beds |
$161,652
|
show details |

|
#29
N 15th St
Philadelphia, PA 19141
|
1,280 sq. feet
|
1 baths 3 beds |
$71,287
|
show details |

|
#30
N Water St
Philadelphia, PA 19120
|
1,224 sq. feet
|
1 baths 3 beds |
$44,763
|
show details |
| Photo | Address | Area | Beds / Baths | Price | Details |
|---|---|---|---|---|---|

|
#31
N 19th St
Philadelphia, PA 19140
|
1,606 sq. feet
|
1 baths 4 beds |
$60,218
|
show details |

|
#32
F St
Philadelphia, PA 19124
|
1,160 sq. feet
|
1 baths 3 beds |
$51,444
|
show details |

|
#33
74th Ave
Philadelphia, PA 19138
|
1,278 sq. feet
|
1 baths 3 beds |
$58,807
|
show details |

|
#34
E Fariston Dr
Philadelphia, PA 19120
|
1,152 sq. feet
|
1 baths 3 beds |
$140,260
|
show details |

|
#35
Keenan St
Elkins Park, PA 19027
|
1,234 sq. feet
|
2 baths 2 beds |
$217,220
|
show details |

|
#36
E Godfrey Ave
Philadelphia, PA 19124
|
896 sq. feet
|
1 baths 3 beds |
$58,976
|
show details |

|
#37
N Marvine St
Philadelphia, PA 19141
|
1,700 sq. feet
|
1 baths 4 beds |
$217,283
|
show details |

|
#38
Jasper St
Philadelphia, PA 19134
|
1,130 sq. feet
|
1 baths 3 beds |
$200,456
|
show details |

|
#39
W Wishart St
Philadelphia, PA 19133
|
1,036 sq. feet
|
1 baths 3 beds |
$8,600
|
show details |

|
#40
Magnolia St
Philadelphia, PA 19144
|
1,152 sq. feet
|
1 baths 3 beds |
$151,516
|
show details |
| Photo | Address | Area | Beds / Baths | Price | Details |
|---|---|---|---|---|---|

|
#41
Fanshawe St
Philadelphia, PA 19149
|
1,100 sq. feet
|
1 baths 3 beds |
$191,268
|
show details |

|
#42
Rosalie St
Philadelphia, PA 19149
|
1,160 sq. feet
|
1 baths 3 beds |
$44,471
|
show details |

|
#43
N 17th St
Philadelphia, PA 19141
|
1,760 sq. feet
|
1 baths 3 beds |
$142,699
|
show details |

|
#44
Scattergood St
Philadelphia, PA 19124
|
992 sq. feet
|
1 baths 3 beds |
$65,864
|
show details |

|
#45
E Haines St # A
Philadelphia, PA 19144
|
1,238 sq. feet
|
1 baths 3 beds |
$100,808
|
show details |

|
#46
Meridian St
Philadelphia, PA 19136
|
1,110 sq. feet
|
1 baths 3 beds |
$73,533
|
show details |

|
#47
Fairdale Rd
Philadelphia, PA 19154
|
1,152 sq. feet
|
1 baths 3 beds |
$178,593
|
show details |

|
#48
Dell St
Philadelphia, PA 19140
|
1,110 sq. feet
|
1 baths 3 beds |
$4,000
|
show details |

|
#49
Mansfield Ave
Philadelphia, PA 19138
|
1,152 sq. feet
|
1 baths 3 beds |
$152,997
|
show details |

|
Check over 1 million property listings on Foreclosure.com!
|
browse all offers | |||

Latest news about housing in Penndel, PA collected exclusively by city-data.com from local newspapers, TV, and radio stations

 | Married Couple/Late 20s/Townhome/First Home. (23 replies) |
| Is George Washington High School as bad it seems? (1 reply) |
| New homes in Chester or Bucks? (4 replies) |
| Real estate in Langhorne, PA (8 replies) |
| Diverse suburbs of Philadelphia? (Norristown, Bensalem, Upper Darby) (27 replies) |
| Trenton burbs in PA (6 replies) |
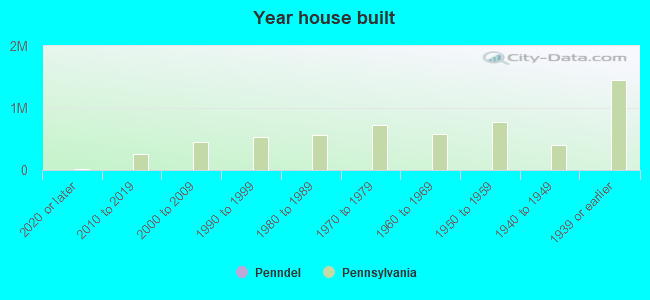
Median year apartment built: 1961
Household type by relationship:
Households: 2,497- Male householders: 410 (153 living alone), Female householders: 603 (198 living alone)
325 spouses (325 opposite-sex spouses), 79 unmarried partners, (79 opposite-sex unmarried partners), 626 children (626 natural, 0 adopted, 0 stepchildren), 6 grandchildren, 41 brothers or sisters, 65 parents, 0 foster children, 43 other relatives, 87 non-relatives
- In group quarters: 202
Size of family households: 192 2-persons, 246 3-persons, 127 4-persons, 1 5-persons, 4 6-persons, 17 7-or-more-persons.
Size of nonfamily households: 353 1-person, 99 2-persons, 2 4-persons.
158 married couples with children.
158 single-parent households (44 men, 114 women).
81.7% of residents of Penndel speak English at home.
5.0% of residents speak Spanish at home (49% speak English very well, 33% speak English well, 11% speak English not well, 8% don't speak English at all).
10.1% of residents speak other Indo-European language at home (57% speak English very well, 11% speak English well, 32% speak English not well).
1.0% of residents speak Asian or Pacific Island language at home (80% speak English very well, 20% speak English well).
Foreign born population: 334 (13.4%)
(60.2% of them are naturalized citizens)
| Here: | 6.8 |
| State: | 6.8 |
| Here: | 3.9 |
| State: | 4.3 |
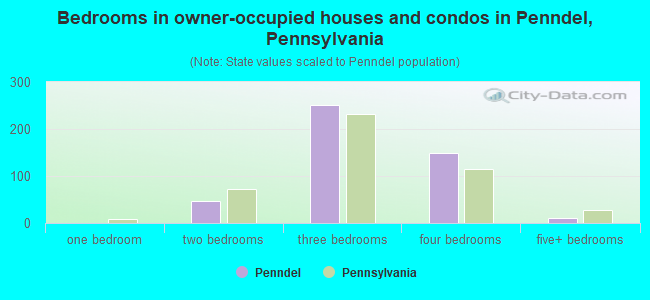
- Bedrooms in owner-occupied houses and condos in Penndel, Pennsylvania
- 0no bedroom
- 01 bedroom
- 462 bedrooms
- 2523 bedrooms
- 1484 bedrooms
- 105+ bedrooms
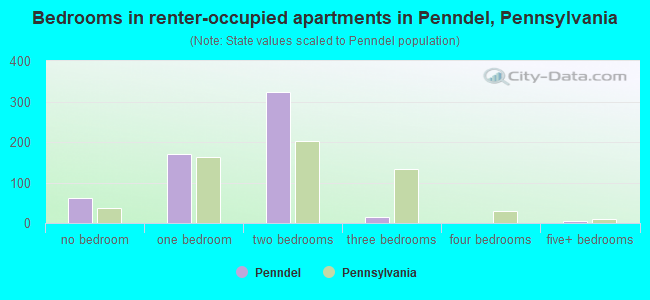
- Bedrooms in renter-occupied apartments in Penndel, Pennsylvania
- 61no bedroom
- 1711 bedroom
- 3232 bedrooms
- 153 bedrooms
- 04 bedrooms
- 55+ bedrooms
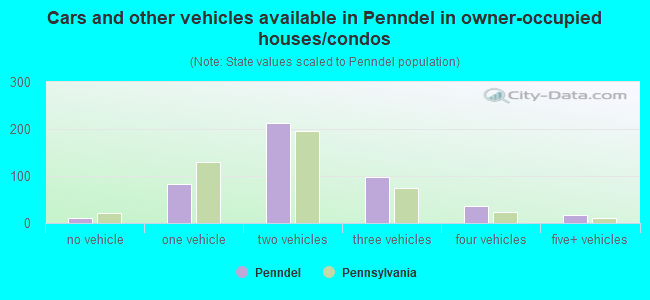
- Cars and other vehicles available in Penndel in owner-occupied houses/condos
- 10no vehicle
- 841 vehicle
- 2122 vehicles
- 983 vehicles
- 364 vehicles
- 165+ vehicles
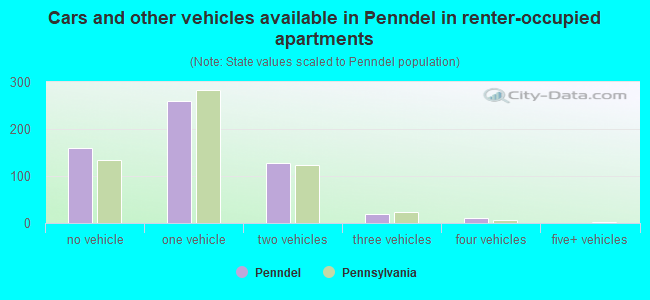
- Cars and other vehicles available in Penndel in renter-occupied apartments
- 160no vehicle
- 2591 vehicle
- 1272 vehicles
- 193 vehicles
- 104 vehicles
- 05+ vehicles
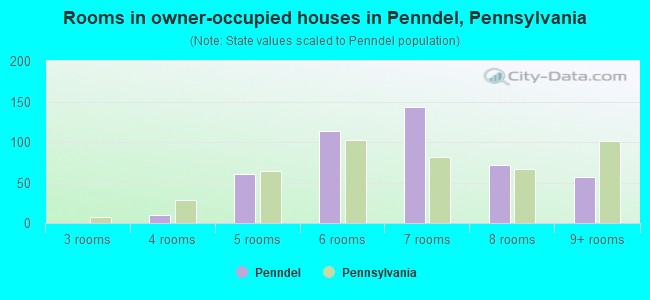
- Rooms in owner-occupied houses in Penndel, Pennsylvania
- 01 room
- 02 rooms
- 03 rooms
- 104 rooms
- 615 rooms
- 1146 rooms
- 1437 rooms
- 718 rooms
- 579+ rooms
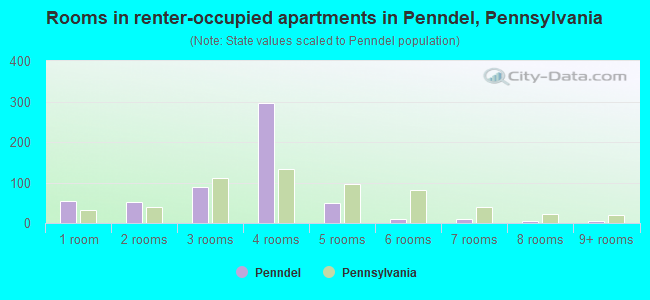
- Rooms in renter-occupied apartments in Penndel, Pennsylvania
- 541 room
- 532 rooms
- 903 rooms
- 2974 rooms
- 505 rooms
- 116 rooms
- 117 rooms
- 48 rooms
- 59+ rooms
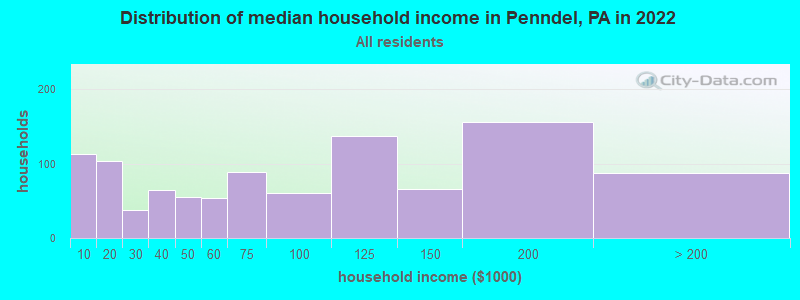
Penndel, PA household income distribution

- 113Less than $10,000
- 104$10,000 to $19,999
- 37$20,000 to $29,999
- 65$30,000 to $39,999
- 55$40,000 to $49,999
- 54$50,000 to $59,999
- 89$60,000 to $74,999
- 61$75,000 to $99,999
- 137$100,000 to $124,999
- 66$125,000 to $149,999
- 156$150,000 to $199,999
- 88$200,000 or more
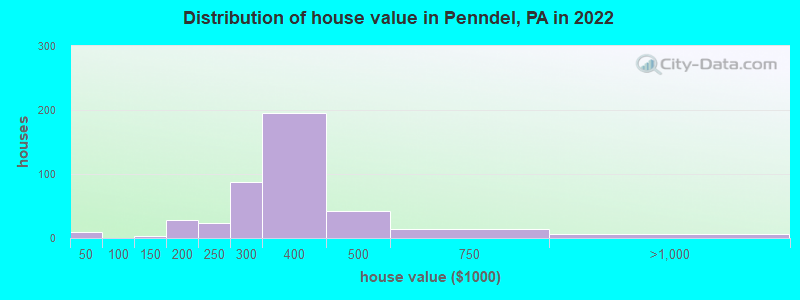
Home value of owner - occupied houses in 2022 in Penndel, PA
-
- 4Less than $10,000
- 5$10,000 to $14,999
- 3$100,000 to $124,999
- 27$175,000 to $199,999
- 23$200,000 to $249,999
- 86$250,000 to $299,999
- 195$300,000 to $399,999
- 41$400,000 to $499,999
- 13$500,000 to $749,999
- 6$750,000 to $999,999
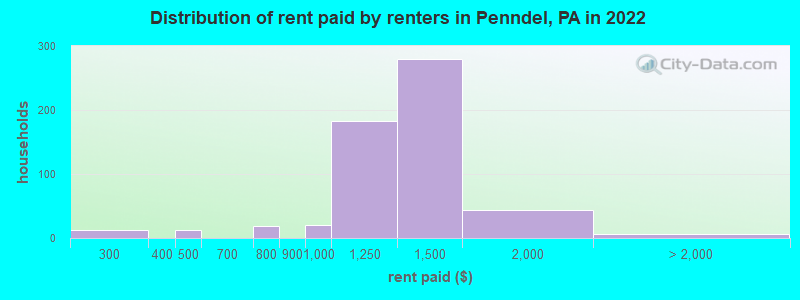
Rent paid by renters in 2022 in Penndel, PA
-
- 12$200 to $249
- 11$400 to $449
- 17$750 to $799
- 21$900 to $999
- 183$1,000 to $1,249
- 279$1,250 to $1,499
- 43$1,500 to $1,999
- 5No cash rent
Percentage of workers working in this county: 61.0%
Number of people working at home: 138 (9.7% of all workers)
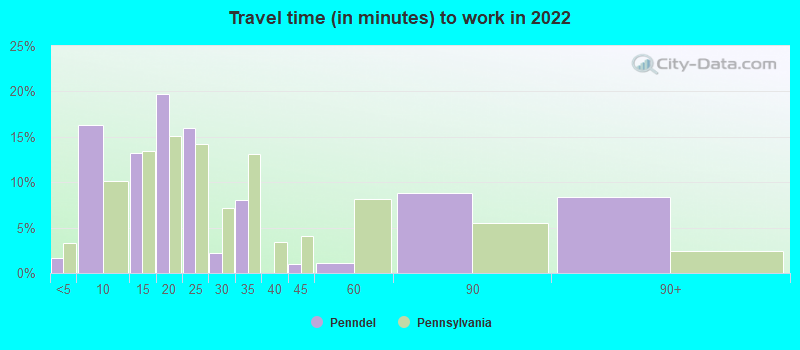
Travel time to work (commute)
- Less than 5 minutes: 66
- 5 to 9 minutes: 164
- 10 to 14 minutes: 141
- 15 to 19 minutes: 171
- 20 to 24 minutes: 166
- 25 to 29 minutes: 23
- 30 to 34 minutes: 83
- 35 to 39 minutes: 42
- 40 to 44 minutes: 66
- 45 to 59 minutes: 176
- 60 to 89 minutes: 117
- 90 or more minutes: 42
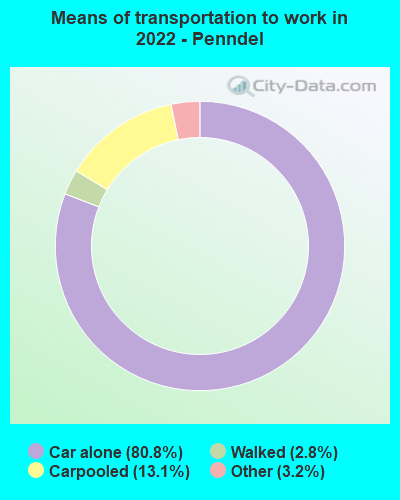
Means of transportation to work:
- Drove a car alone: 666 (68.1%)
- Carpooled: 100 (10.2%)
- Taxi: 38 (3.9%)
- Walked: 20 (2.0%)
- Worked at home: 138 (14.1%)
- Unemployment by race in 2022
- Unemployment rate for White non-Hispanic residents
- 3.0%Males
- 2.6%Females
- Unemployment rate for Black residents
- 6.6%Females
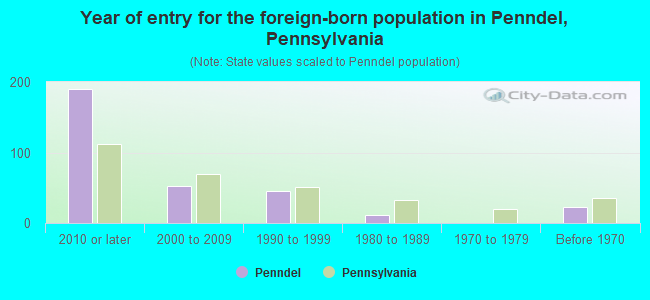
- Year of entry for the foreign-born population in Penndel, Pennsylvania
- 1902010 or later
- 532000 to 2009
- 451990 to 1999
- 121980 to 1989
- 01970 to 1979
- 22Before 1970
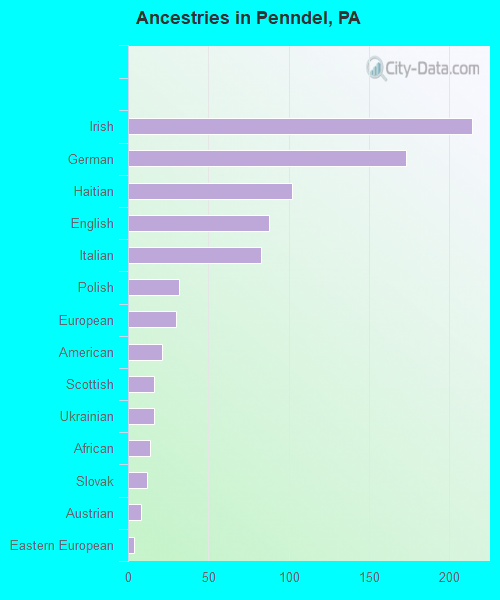
First ancestries reported:
- Irish: 214 (17.3%)
- German: 173 (14.0%)
- Haitian: 102 (8.2%)
- English: 88 (7.1%)
- Italian: 83 (6.7%)
- Polish: 32 (2.6%)
- European: 30 (2.4%)
- American: 21 (1.7%)
- Scottish: 16 (1.3%)
- Ukrainian: 16 (1.3%)
- African: 14 (1.1%)
- Slovak: 12 (1.0%)
- Austrian: 8 (0.6%)
- Eastern European: 4 (0.3%)
Most common places of birth for foreign-born residents (%):
| Penndel: | 24.4% (82) |
| Pennsylvania: | 2.1% (19,841) |
| Penndel: | 15.8% (53) |
| Pennsylvania: | 0.4% (4,068) |
| Penndel: | 15.2% (51) |
| Pennsylvania: | 1.6% (15,224) |
| Penndel: | 8.9% (30) |
| Pennsylvania: | 1.4% (12,910) |
| Penndel: | 7.4% (25) |
| Pennsylvania: | 7.2% (67,704) |
| Penndel: | 7.1% (24) |
| Pennsylvania: | 0.3% (3,132) |
| Penndel: | 3.3% (11) |
| Pennsylvania: | 10.7% (100,596) |
| Penndel: | 2.7% (9) |
| Pennsylvania: | 0.6% (5,479) |
| Penndel: | 2.1% (7) |
| Pennsylvania: | 0.2% (1,916) |
| Penndel: | 2.1% (7) |
| Pennsylvania: | 0.5% (4,519) |
Place of birth for U.S.-born residents:
- This state: 1,366
- Other state: 704
- Northeast: 558
- Midwest: 17
- South: 101
- West: 26
88.7% of Penndel residents lived in the same house 1 years ago.
Out of people who lived in different houses, 32.7% lived in this county.
Out of people who lived in different counties, 44.9% lived in Pennsylvania.
| Penndel: | 88.7% |
| State average: | 89.3% |
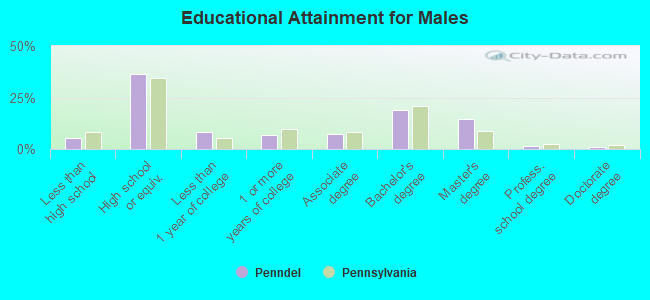
Education attainment for males 25 years and older:
- No schooling: 0
- Nursery to 4th grade: 0
- 5th and 6th grade: 0
- 7th and 8th grade: 0
- 9th grade: 5
- 10th grade: 0
- 11th grade: 16
- 12th grade, no diploma: 22
- High school graduate (or equivalency): 303
- Less than 1 year of college: 68
- Some college more than 1 year, no degree: 56
- Associate degree: 60
- Bachelor's degree: 155
- Master's degree: 120
- Professional school degree: 12
- Doctorate degree: 10
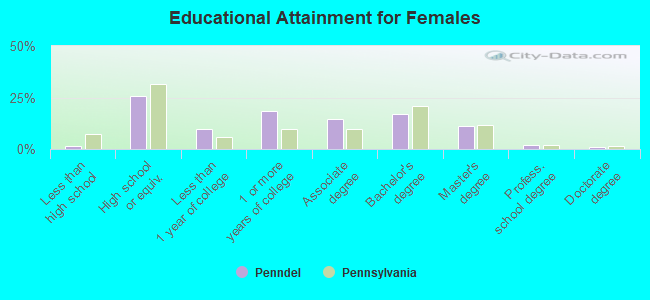
Education attainment for females 25 years and older:
- No schooling: 0
- Nursery to 4th grade: 0
- 5th and 6th grade: 0
- 7th and 8th grade: 0
- 9th grade: 0
- 10th grade: 10
- 11th grade: 0
- 12th grade, no diploma: 0
- High school graduate (or equivalency): 202
- Less than 1 year of college: 76
- Some college more than 1 year, no degree: 143
- Associate degree: 113
- Bachelor's degree: 132
- Master's degree: 87
- Professional school degree: 14
- Doctorate degree: 7
Housing units in structures:
- One, detached: 409
- One, attached: 83
- Two: 70
- 3 or 4: 38
- 5 to 9: 314
- 10 to 19: 41
- 20 to 49: 44
- 50 or more: 36
- Mobile homes: 53
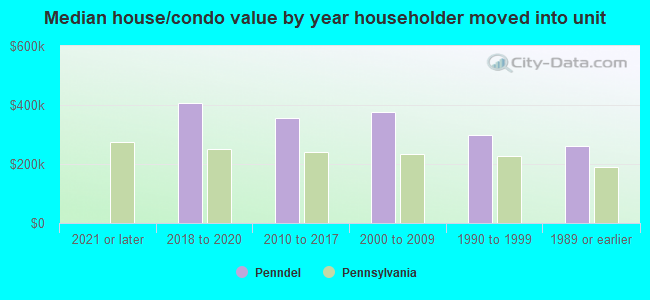
House/condo owner moved in on average 17 years ago
Renter moved in on average 1 years ago
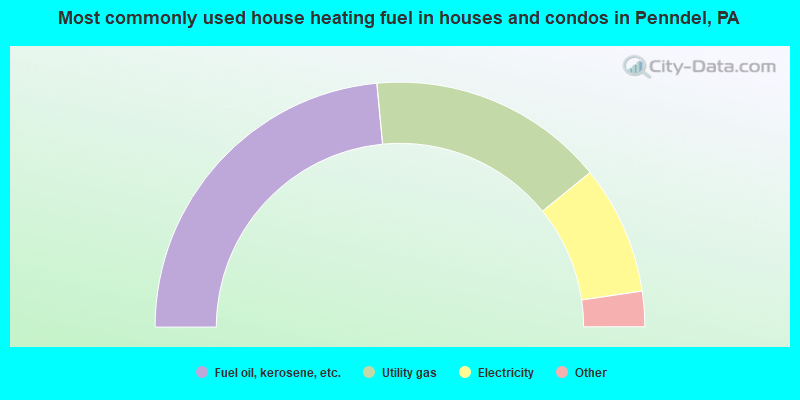
- 47.2%Fuel oil, kerosene, etc.
- 31.4%Utility gas
- 17.1%Electricity
- 2.7%Wood
- 1.6%Bottled, tank, or LP gas
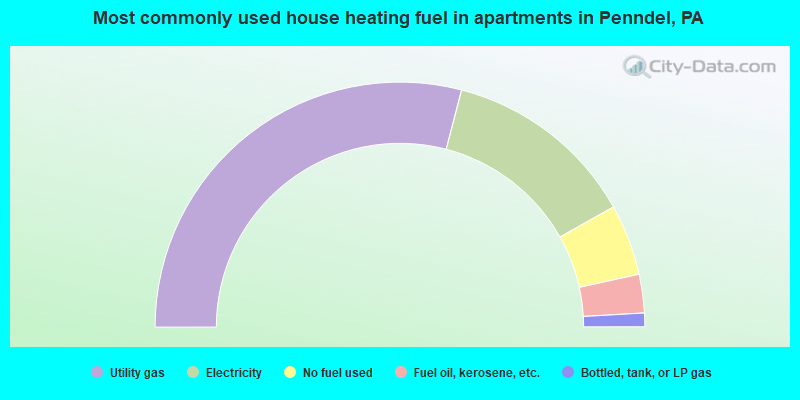
- 58.1%Utility gas
- 25.6%Electricity
- 9.4%No fuel used
- 5.1%Fuel oil, kerosene, etc.
- 1.8%Bottled, tank, or LP gas
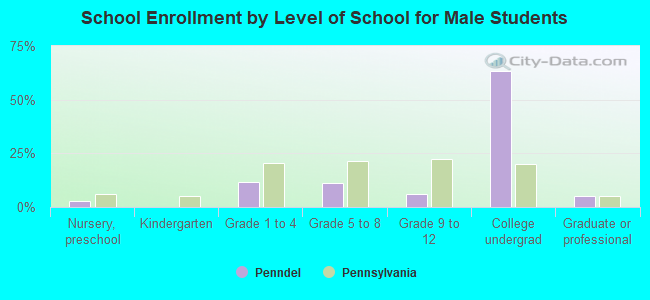
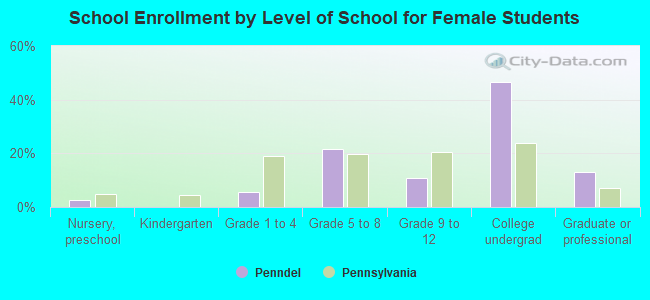
Private vs. public school enrollment:
| Here: | 37.3% |
| Pennsylvania: | 15.7% |
| Here: | 0.0% |
| Pennsylvania: | 13.4% |
| Here: | 81.1% |
| Pennsylvania: | 39.8% |