Housing density: 433 houses/condos per square mile
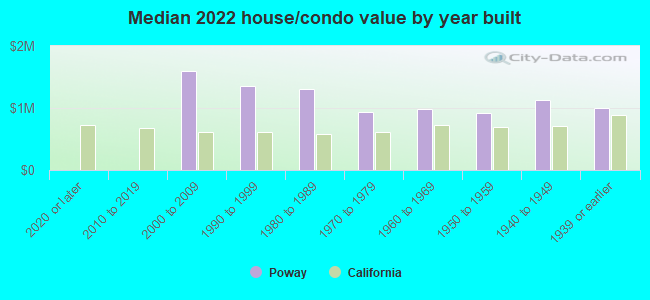
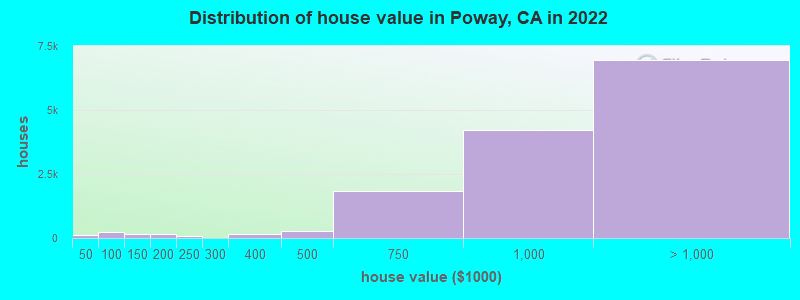
Median price asked for vacant for-sale houses and condos in 2022: $986,244.
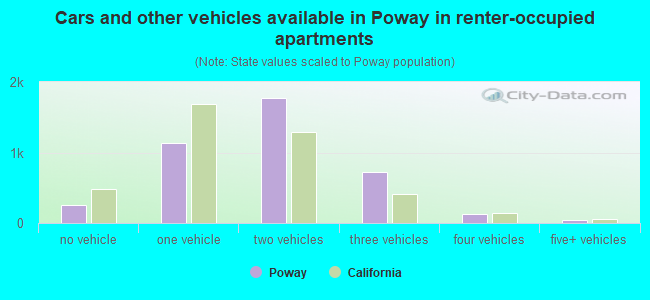
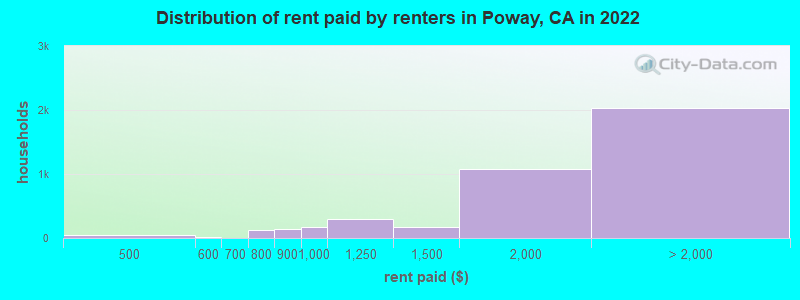
Median contract rent in 2022: $1,935 (lower quartile is $1,475, upper quartile is over $2,000)
Median rent asked for vacant for-rent units in 2022: $2,267
Median gross rent in Poway, CA in 2022: over $2,000
Housing units in Poway with a mortgage: 9,002 (1,093 second mortgage, 71 home equity loan, 883 both second mortgage and home equity loan) Houses without a mortgage: 159
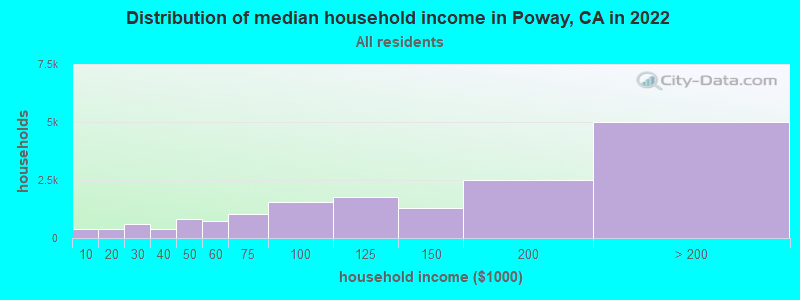
Median household income for houses/condos with a mortgage: $174,005
Median household income for apartments without a mortgage: $108,811
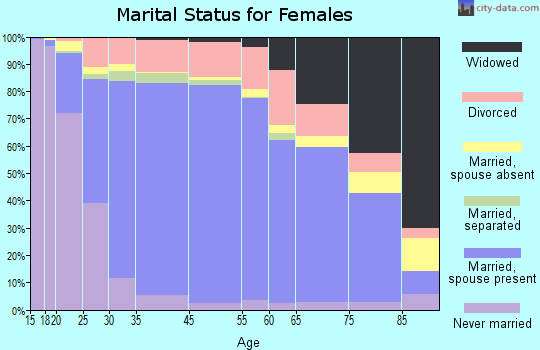
8,356 married couples with children.
1,502 single-parent households (548 men, 954 women).
72.9% of residents of Poway speak English at home.
10.6% of residents speak Spanish at home (64% speak English very well, 16% speak English well, 17% speak English not well, 3% don't speak English at all).
6.1% of residents speak other Indo-European language at home (62% speak English very well, 24% speak English well, 10% speak English not well, 4% don't speak English at all).
9.0% of residents speak Asian or Pacific Island language at home (55% speak English very well, 33% speak English well, 8% speak English not well, 4% don't speak English at all).
2.0% of residents speak other language at home (73% speak English very well, 17% speak English well, 6% speak English not well, 3% don't speak English at all).
Foreign born population: 9,410 (19.4%)
(66.8% of them are naturalized citizens)
Percentage of workers working in this county: 98.7% Number of people working at home: 5,105 (22.0% of all workers)
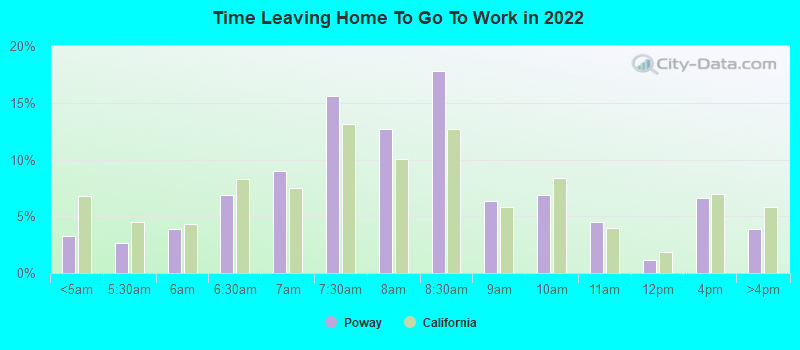
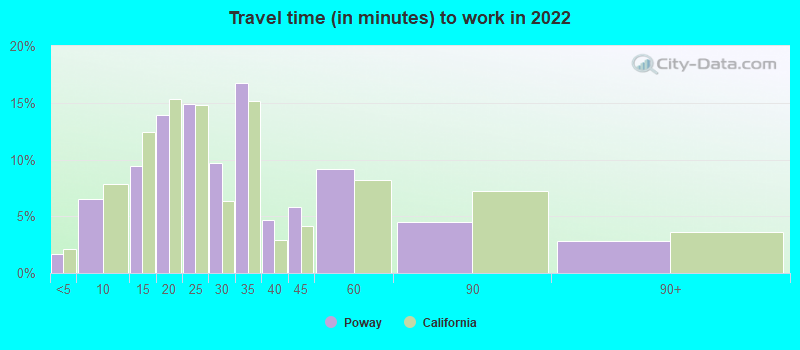
Travel time to work (commute)
Less than 5 minutes: 281
5 to 9 minutes: 1,600
10 to 14 minutes: 2,358
15 to 19 minutes: 2,511
20 to 24 minutes: 2,269
25 to 29 minutes: 1,743
30 to 34 minutes: 3,881
35 to 39 minutes: 1,107
40 to 44 minutes: 900
45 to 59 minutes: 1,177
60 to 89 minutes: 190
90 or more minutes: 369
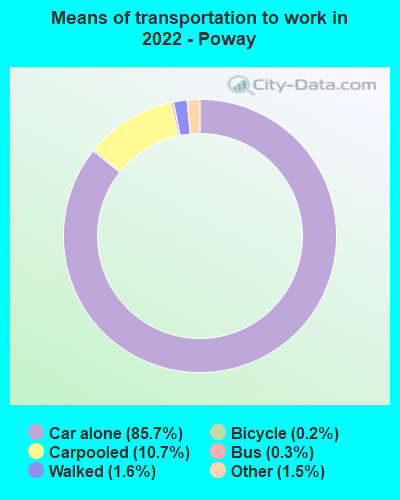
Means of transportation to work:
Drove a car alone: 25,463 (72.0%)
Carpooled: 3,320 (9.4%)
Bus: 87 (0.2%)
Taxi: 460 (1.3%)
Bicycle: 61 (0.2%)
Walked: 519 (1.5%)
Worked at home: 5,105 (14.4%)
Unemployment by race in 2022
Unemployment rate for White non-Hispanic residents
3.9%Males
4.3%Females
Unemployment rate for Black residents
10.5%Males
Unemployment rate for American Indian and Alaska Native residents
31.2%Females
Unemployment rate for Asian residents
3.9%Males
4.8%Females
Unemployment rate for other race residents
10.8%Males
9.9%Females
Unemployment rate for two or more race residents
6.1%Males
1.7%Females
Unemployment rate for Hispanic or Latino residents
5.9%Males
4.8%Females
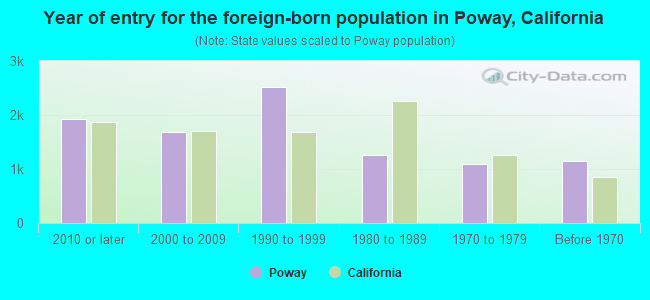
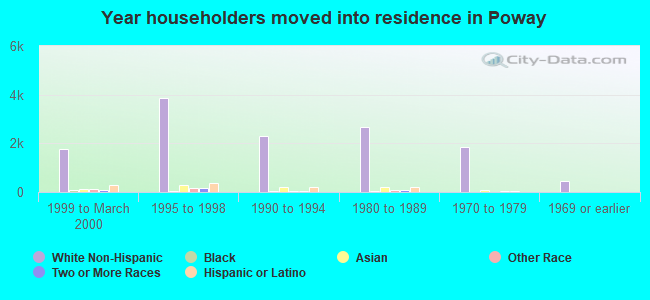
Year of entry for the foreign-born population in Poway, California
1,9182010 or later
1,6792000 to 2009
2,5221990 to 1999
1,2581980 to 1989
1,0971970 to 1979
1,150Before 1970
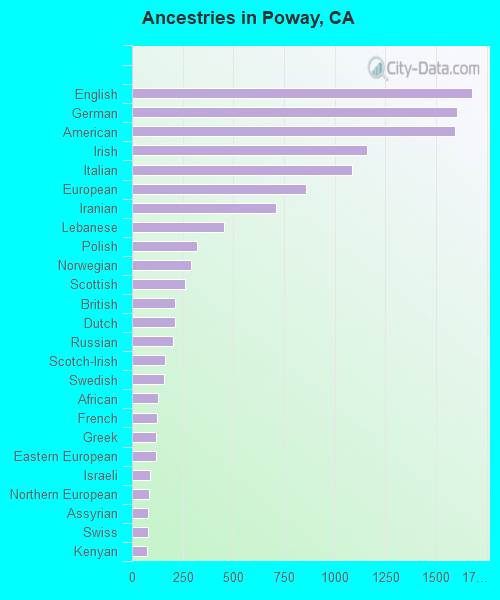
First ancestries reported:
English: 1,678 (6.9%)
German: 1,602 (6.6%)
American: 1,596 (6.6%)
Irish: 1,159 (4.8%)
Italian: 1,086 (4.5%)
European: 861 (3.5%)
Iranian: 710 (2.9%)
Lebanese: 456 (1.9%)
Polish: 321 (1.3%)
Norwegian: 291 (1.2%)
Scottish: 264 (1.1%)
British: 210 (0.9%)
Dutch: 210 (0.9%)
Russian: 202 (0.8%)
Scotch-Irish: 162 (0.7%)
Swedish: 160 (0.7%)
African: 127 (0.5%)
French: 122 (0.5%)
Greek: 118 (0.5%)
Eastern European: 117 (0.5%)
Israeli: 89 (0.4%)
Northern European: 84 (0.3%)
Assyrian: 81 (0.3%)
Swiss: 79 (0.3%)
Kenyan: 76 (0.3%)
Ukrainian: 74 (0.3%)
Hungarian: 70 (0.3%)
Canadian: 69 (0.3%)
Basque: 68 (0.3%)
Scandinavian: 65 (0.3%)
Iraqi: 57 (0.2%)
Macedonian: 57 (0.2%)
Senegalese: 55 (0.2%)
Romanian: 41 (0.2%)
Bulgarian: 41 (0.2%)
Finnish: 40 (0.2%)
Ethiopian: 38 (0.2%)
German Russian: 32 (0.1%)
Brazilian: 30 (0.1%)
Palestinian: 29 (0.1%)
Welsh: 29 (0.1%)
Czech: 28 (0.1%)
Portuguese: 26 (0.1%)
Syrian: 25 (0.1%)
Haitian: 23 (0.09%)
Danish: 22 (0.09%)
Croatian: 22 (0.09%)
Afghan: 20 (0.08%)
French Canadian: 20 (0.08%)
Austrian: 19 (0.08%)
Arab: 19 (0.08%)
West Indian: 16 (0.07%)
Pennsylvania German: 15 (0.06%)
Lithuanian: 13 (0.05%)
Serbian: 13 (0.05%)
Slovak: 12 (0.05%)
Nigerian: 12 (0.05%)
Armenian: 7 (0.03%)
Belgian: 7 (0.03%)
Slavic: 4 (0.02%)
Most common places of birth for foreign-born residents (%):
Mexico
Poway:
24.3% (2,288)
California:
37.2% (3,881,193)
Philippines
Poway:
10.8% (1,016)
California:
7.8% (818,297)
Vietnam
Poway:
9.6% (900)
California:
4.9% (512,335)
Iran
Poway:
7.1% (665)
California:
2.0% (206,004)
China, excluding Hong Kong and Taiwan
Poway:
6.6% (620)
California:
6.6% (684,672)
India
Poway:
4.4% (418)
California:
5.2% (539,184)
Japan
Poway:
3.7% (350)
California:
1.0% (103,575)
Korea
Poway:
3.5% (325)
California:
3.0% (315,248)
Canada
Poway:
2.8% (259)
California:
1.2% (127,477)
Iraq
Poway:
1.9% (183)
California:
0.4% (40,941)
Russia
Poway:
1.8% (174)
California:
0.7% (71,932)
Israel
Poway:
1.8% (167)
California:
0.3% (33,029)
Lebanon
Poway:
1.7% (156)
California:
0.3% (31,757)
Pakistan
Poway:
1.5% (143)
California:
0.5% (49,399)
Place of birth for U.S.-born residents:
This state: 24,923
Other state: 13,427
Northeast: 3,922
Midwest: 4,224
South: 3,014
West: 2,262
92.3% of Poway residents lived in the same house 1 years ago. Out of people who lived in different houses, 43.5% lived in this county. Out of people who lived in different counties, 49.7% lived in California.
Poway:
92.3%
State average:
88.9%
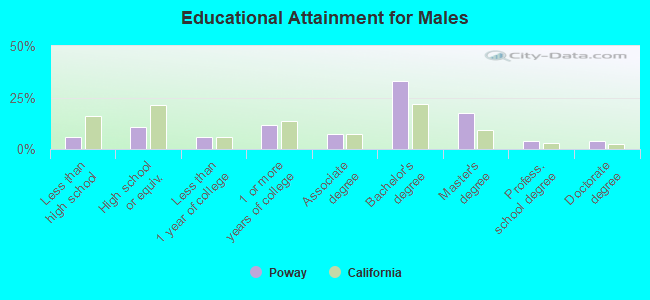
Education attainment for males 25 years and older:
No schooling: 403
Nursery to 4th grade: 16
5th and 6th grade: 193
7th and 8th grade: 30
9th grade: 79
10th grade: 7
11th grade: 86
12th grade, no diploma: 238
High school graduate (or equivalency): 1,891
Less than 1 year of college: 1,013
Some college more than 1 year, no degree: 2,063
Associate degree: 1,310
Bachelor's degree: 5,754
Master's degree: 3,069
Professional school degree: 674
Doctorate degree: 647
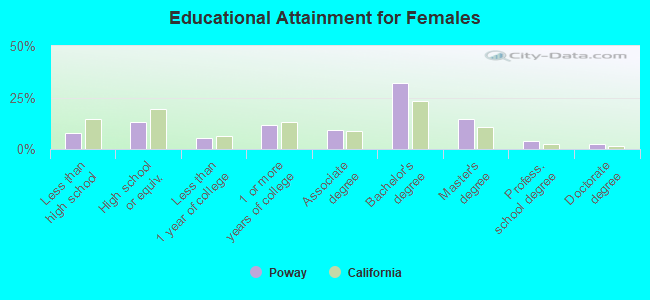
Education attainment for females 25 years and older:
No schooling: 451
Nursery to 4th grade: 63
5th and 6th grade: 148
7th and 8th grade: 67
9th grade: 36
10th grade: 34
11th grade: 188
12th grade, no diploma: 363
High school graduate (or equivalency): 2,296
Less than 1 year of college: 943
Some college more than 1 year, no degree: 2,095
Associate degree: 1,639
Bachelor's degree: 5,683
Master's degree: 2,573
Professional school degree: 647
Doctorate degree: 406
Housing units in structures:
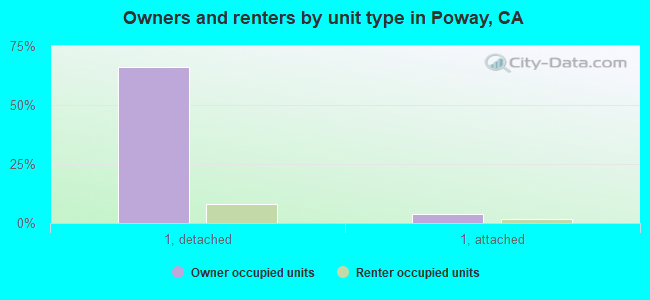
One, detached: 12,937
One, attached: 821
Two: 104
3 or 4: 285
5 to 9: 584
10 to 19: 484
20 to 49: 429
50 or more: 674
Mobile homes: 658
Boats, RVs, vans, etc.: 6
Median worth of mobile homes: $186,682
Housing units lacking complete plumbing facilities in 2022: 0.5%
Housing units lacking complete kitchen facilities in 2022: 1.2%
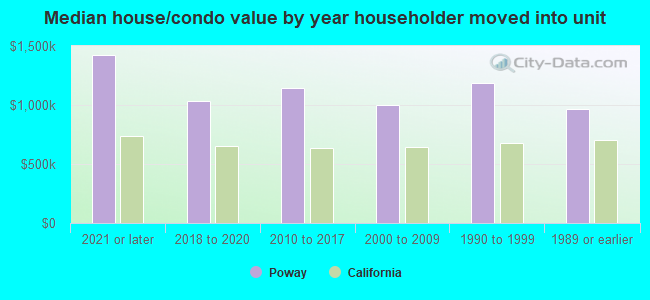
House/condo owner moved in on average 17 years ago