Richmond, VA (Virginia) Houses and Residents
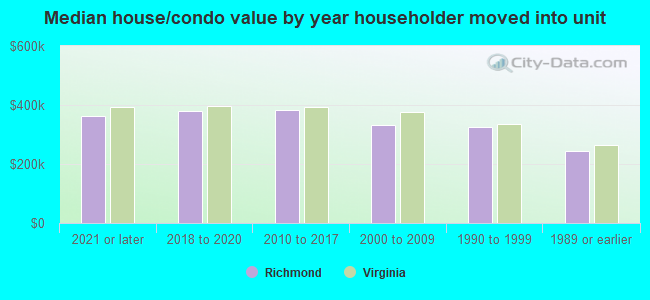
| Richmond: | $346,800 |
| Virginia: | $365,700 |
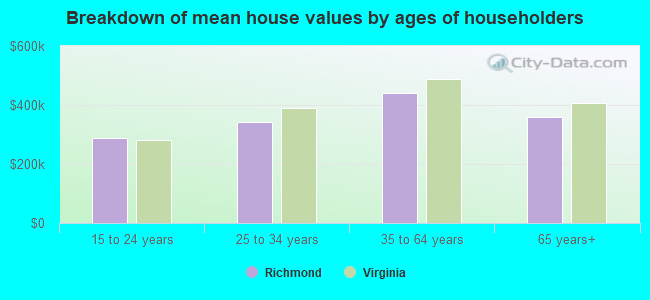
Mean price in 2022:
Detached houses: $418,611
Here: $418,611 State: $472,865 Townhouses or other attached units: $534,021
Here: $534,021 State: $457,437 In 2-unit structures: $369,095
Here: $369,095 State: $396,289 In 3-to-4-unit structures: $346,898
Here: $346,898 State: $252,346 In 5-or-more-unit structures: $239,171
Here: $239,171 State: $382,551 Mobile homes: $80,545
Here: $80,545 State: $100,736
Total population: 217,853 (Urban population: 197,790, Rural population: 0)
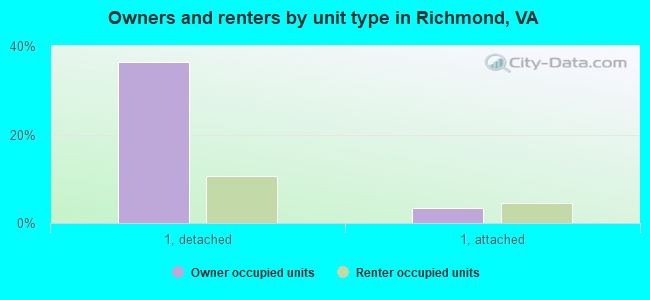
Houses: 113,473 (106,252 occupied: 46,019 owner occupied, 60,233 renter occupied)
| % of renters here: | 57% |
| State: | 33% |
Housing density: 1,889 houses/condos per square mile
Median price asked for vacant for-sale houses and condos in 2022: $529,630.
Median contract rent in 2022: $1,050 (lower quartile is $819, upper quartile is $1,352)
Median rent asked for vacant for-rent units in 2022: $875
Median gross rent in Richmond, VA in 2022: $1,192
Housing units in Richmond with a mortgage: 32,582 (3,528 second mortgage, 0 home equity loan, 2,690 both second mortgage and home equity loan)
Houses without a mortgage: 1,157
Median household income for houses/condos with a mortgage: $110,204
Median household income for apartments without a mortgage: $65,985
Median monthly housing costs: $1,283
Compare current foreclosures in Richmond, VA:
| Photo | Address | Area | Beds / Baths | Price | Details |
|---|---|---|---|---|---|

|
#1
Woodrow Ave # 23222
Richmond, VA 23222
|
1,440 sq. feet
|
1 baths 3 beds |
show details | |

|
#2
Overbrook Rd
Richmond, VA 23222
|
1,536 sq. feet
|
2 baths 5 beds |
show details | |

|
#3
Becar Rd
Richmond, VA 23236
|
2,238 sq. feet
|
3 baths 5 beds |
show details | |

|
#4
Bridgeton Rd
Richmond, VA 23234
|
1,379 sq. feet
|
1 baths 3 beds |
show details | |

|
#5
Rosewood Ave
Richmond, VA 23221
|
725 sq. feet
|
1 baths 3 beds |
show details | |

|
#6
S Cherry St
Richmond, VA 23220
|
1,405 sq. feet
|
2 baths 3 beds |
show details | |

|
#7
Drewry St
Richmond, VA 23224
|
1,386 sq. feet
|
2 baths 2 beds |
show details | |

|
#8
Banbridge Ct
Richmond, VA 23228
|
1,284 sq. feet
|
2 baths 3 beds |
show details | |

|
#9
Becar Rd
Richmond, VA 23236
|
2,238 sq. feet
|
3 baths 5 beds |
show details | |

|
#10
Newbridge Ter
Richmond, VA 23223
|
1,178 sq. feet
|
1 baths 3 beds |
show details |
| Photo | Address | Area | Beds / Baths | Price | Details |
|---|---|---|---|---|---|

|
#11
Hopkins Rd
Richmond, VA 23234
|
1,876 sq. feet
|
2 baths 3 beds |
show details | |

|
#12
N Cottonwood Rd
Richmond, VA 23236
|
1,486 sq. feet
|
1 baths 3 beds |
show details | |

|
#13
Rockland Rd
Richmond, VA 23225
|
1,794 sq. feet
|
1 baths 3 beds |
show details | |

|
#14
Watson Ave
Richmond, VA 23234
|
1,382 sq. feet
|
1 baths 2 beds |
show details | |

|
#15
W Clay St
Richmond, VA 23220
|
3,175 sq. feet
|
3 baths 8 beds |
show details | |

|
#16
Hunters Meadow Pl
Richmond, VA 23231
|
- sq. feet
|
2 baths 4 beds |
show details | |

|
#17
Talon Ln
Richmond, VA 23237
|
1,282 sq. feet
|
2 baths 3 beds |
show details | |

|
#18
Old Osborne Tpke
Richmond, VA 23231
|
- sq. feet
|
3 baths 5 beds |
show details | |

|
#19
S Kinsley Ave
Richmond, VA 23224
|
1,152 sq. feet
|
1 baths 3 beds |
show details | |

|
#20
Drexel Ln
Richmond, VA 23228
|
1,000 sq. feet
|
1 baths 3 beds |
show details |
| Photo | Address | Area | Beds / Baths | Price | Details |
|---|---|---|---|---|---|

|
#21
Barnwood Dr
Richmond, VA 23234
|
2,992 sq. feet
|
3 baths 5 beds |
show details | |

|
#22
Geneva Dr
Richmond, VA 23224
|
1,920 sq. feet
|
2 baths 4 beds |
show details | |

|
#23
W 47th St
Richmond, VA 23225
|
980 sq. feet
|
1 baths 3 beds |
show details | |

|
#24
Lakent Ln
Richmond, VA 23236
|
1,414 sq. feet
|
1 baths 3 beds |
show details | |

|
#25
Wainwright Dr
Richmond, VA 23225
|
1,565 sq. feet
|
3 baths 4 beds |
show details | |

|
#26
Pinefields Dr
Richmond, VA 23231
|
1,438 sq. feet
|
2 baths 3 beds |
show details | |

|
#27
Roaringbrook Dr
Richmond, VA 23233
|
1,636 sq. feet
|
2 baths 3 beds |
show details | |

|
#28
Hobson Ln
Richmond, VA 23223
|
840 sq. feet
|
1 baths 3 beds |
show details | |

|
#29
Bradbury Knoll Dr
Richmond, VA 23231
|
1,232 sq. feet
|
2 baths 3 beds |
show details | |

|
#30
Trevillian Rd
Richmond, VA 23235
|
1,719 sq. feet
|
1 baths 3 beds |
show details |
| Photo | Address | Area | Beds / Baths | Price | Details |
|---|---|---|---|---|---|

|
#31
S Hyannis Dr
Richmond, VA 23236
|
1,820 sq. feet
|
2 baths 3 beds |
show details | |

|
#32
Geneva Dr
Richmond, VA 23224
|
1,817 sq. feet
|
2 baths 4 beds |
show details | |

|
#33
Gillis Ct
Richmond, VA 23228
|
2,150 sq. feet
|
2 baths 4 beds |
show details | |

|
#34
Richmond Henrico Tpke
Richmond, VA 23222
|
903 sq. feet
|
1 baths 3 beds |
show details | |

|
#35
Old Post Rd
Richmond, VA 23234
|
1,421 sq. feet
|
1 baths 3 beds |
show details | |

|
#36
Sexton Dr
Richmond, VA 23224
|
1,292 sq. feet
|
2 baths 3 beds |
show details | |

|
#37
Penobscot Rd
Richmond, VA 23227
|
1,095 sq. feet
|
1 baths 3 beds |
show details | |

|
#38
Darbytown Rd
Richmond, VA 23231
|
1,275 sq. feet
|
2 baths 3 beds |
show details | |

|
#39
Farmington Dr
Richmond, VA 23229
|
2,228 sq. feet
|
2 baths 4 beds |
show details | |

|
#40
Four Mile Run Dr
Richmond, VA 23231
|
1,854 sq. feet
|
2 baths 4 beds |
show details |
| Photo | Address | Area | Beds / Baths | Price | Details |
|---|---|---|---|---|---|

|
#41
Millers Crossing Trl
Richmond, VA 23231
|
1,612 sq. feet
|
2 baths 3 beds |
show details | |

|
#42
Carriage Pines Dr
Richmond, VA 23225
|
1,552 sq. feet
|
2 baths 3 beds |
show details | |

|
#43
Emporia St
Richmond, VA 23231
|
1,800 sq. feet
|
2 baths 3 beds |
show details | |

|
#44
Mountain Laurel Dr
Richmond, VA 23236
|
1,534 sq. feet
|
2 baths 3 beds |
show details | |

|
#45
River Bluffs Ct
Richmond, VA 23223
|
1,026 sq. feet
|
2 baths 3 beds |
show details | |

|
#46
Hob Nob Hl
Richmond, VA 23231
|
1,848 sq. feet
|
2 baths 3 beds |
show details | |

|
#47
Bridget Ct
Richmond, VA 23234
|
1,320 sq. feet
|
2 baths 3 beds |
show details | |

|
#48
Strum Ct
Richmond, VA 23294
|
1,568 sq. feet
|
2 baths 3 beds |
show details | |

|
#49
Dundee Ave # B
Richmond, VA 23225
|
1,923 sq. feet
|
2 baths 4 beds |
show details | |

|
Check over 1 million property listings on Foreclosure.com!
|
browse all offers | |||

Latest news about housing in Richmond, VA collected exclusively by city-data.com from local newspapers, TV, and radio stations


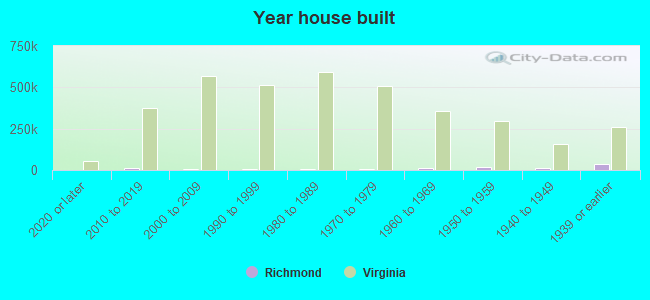
Median year apartment built: 1964
Household type by relationship:
Households: 229,395- Male householders: 45,213 (17,742 living alone), Female householders: 61,039 (27,855 living alone)
27,015 spouses (26,698 opposite-sex spouses), 10,959 unmarried partners, (9,516 opposite-sex unmarried partners), 48,406 children (46,043 natural, 589 adopted, 1,774 stepchildren), 1,924 grandchildren, 3,230 brothers or sisters, 2,339 parents, 0 foster children, 4,357 other relatives, 13,980 non-relatives
- In group quarters: 10,933
Size of family households: 24,121 2-persons, 8,498 3-persons, 7,252 4-persons, 2,506 5-persons, 1,265 6-persons, 799 7-or-more-persons.
Size of nonfamily households: 45,597 1-person, 13,687 2-persons, 1,598 3-persons, 854 4-persons, 75 5-persons.
16,588 married couples with children.
16,727 single-parent households (2,922 men, 13,805 women).
89.3% of residents of Richmond speak English at home.
6.3% of residents speak Spanish at home (43% speak English very well, 12% speak English well, 24% speak English not well, 21% don't speak English at all).
1.9% of residents speak other Indo-European language at home (72% speak English very well, 18% speak English well, 10% speak English not well).
1.1% of residents speak Asian or Pacific Island language at home (66% speak English very well, 22% speak English well, 10% speak English not well, 2% don't speak English at all).
1.0% of residents speak other language at home (72% speak English very well, 23% speak English well, 4% speak English not well, 1% don't speak English at all).
Foreign born population: 16,296 (7.1%)
(27.1% of them are naturalized citizens)
| Here: | 6.8 |
| State: | 7.0 |
| Here: | 3.8 |
| State: | 4.3 |
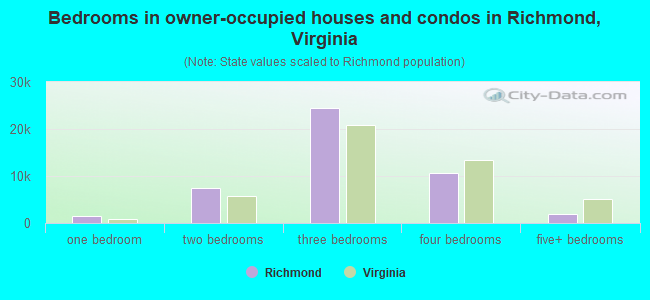
- Bedrooms in owner-occupied houses and condos in Richmond, Virginia
- 182no bedroom
- 1,4421 bedroom
- 7,5292 bedrooms
- 24,3803 bedrooms
- 10,6154 bedrooms
- 1,8715+ bedrooms
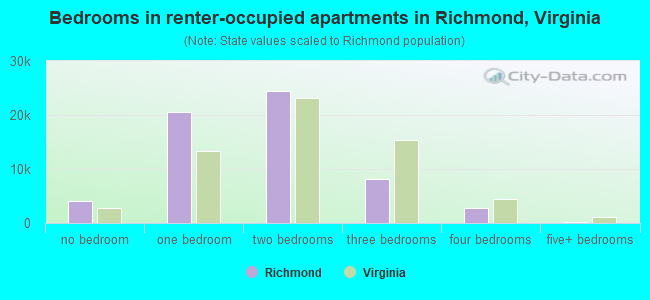
- Bedrooms in renter-occupied apartments in Richmond, Virginia
- 3,988no bedroom
- 20,6281 bedroom
- 24,4662 bedrooms
- 8,1693 bedrooms
- 2,7464 bedrooms
- 2365+ bedrooms
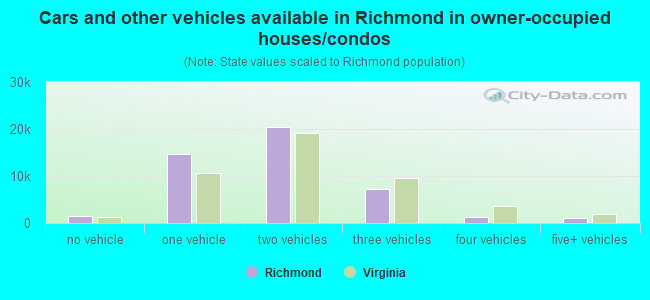
- Cars and other vehicles available in Richmond in owner-occupied houses/condos
- 1,420no vehicle
- 14,7741 vehicle
- 20,4292 vehicles
- 7,2413 vehicles
- 1,1824 vehicles
- 9735+ vehicles
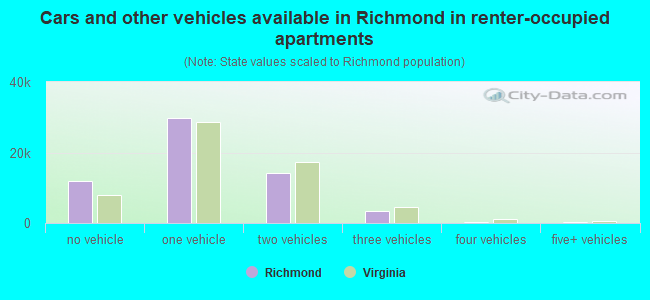
- Cars and other vehicles available in Richmond in renter-occupied apartments
- 12,045no vehicle
- 29,9011 vehicle
- 14,2182 vehicles
- 3,4363 vehicles
- 3864 vehicles
- 2475+ vehicles
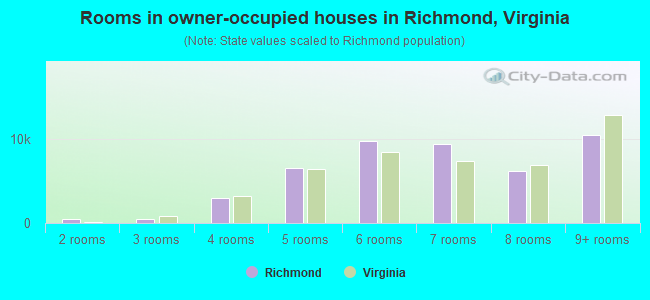
- Rooms in owner-occupied houses in Richmond, Virginia
- 01 room
- 4972 rooms
- 4843 rooms
- 2,9054 rooms
- 6,5045 rooms
- 9,6716 rooms
- 9,3687 rooms
- 6,1538 rooms
- 10,4379+ rooms
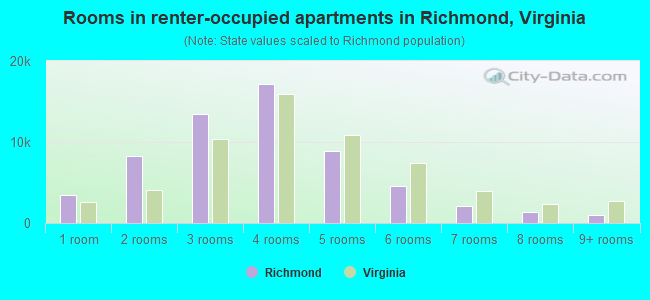
- Rooms in renter-occupied apartments in Richmond, Virginia
- 3,5171 room
- 8,2132 rooms
- 13,4383 rooms
- 17,1894 rooms
- 8,8995 rooms
- 4,5276 rooms
- 2,1047 rooms
- 1,3428 rooms
- 1,0049+ rooms
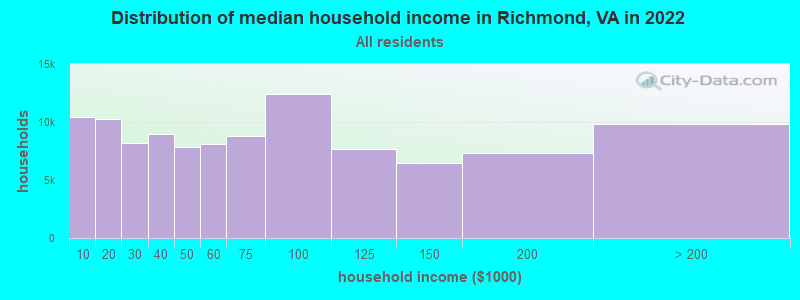
Richmond, VA household income distribution

- 10,440Less than $10,000
- 10,285$10,000 to $19,999
- 8,181$20,000 to $29,999
- 8,940$30,000 to $39,999
- 7,810$40,000 to $49,999
- 8,127$50,000 to $59,999
- 8,756$60,000 to $74,999
- 12,414$75,000 to $99,999
- 7,655$100,000 to $124,999
- 6,473$125,000 to $149,999
- 7,303$150,000 to $199,999
- 9,868$200,000 or more
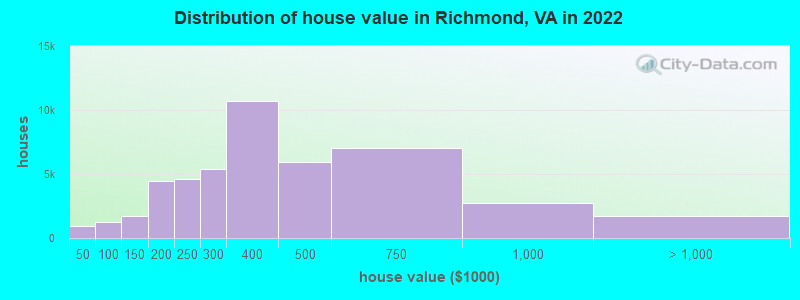
Home value of owner - occupied houses in 2022 in Richmond, VA
-
- 158Less than $10,000
- 87$10,000 to $14,999
- 210$15,000 to $19,999
- 84$25,000 to $29,999
- 100$30,000 to $34,999
- 322$40,000 to $49,999
- 44$50,000 to $59,999
- 84$60,000 to $69,999
- 308$70,000 to $79,999
- 233$80,000 to $89,999
- 227$90,000 to $99,999
- 995$100,000 to $124,999
- 746$125,000 to $149,999
- 2,570$150,000 to $174,999
- 1,852$175,000 to $199,999
- 4,631$200,000 to $249,999
- 5,361$250,000 to $299,999
- 10,675$300,000 to $399,999
- 5,900$400,000 to $499,999
- 7,022$500,000 to $749,999
- 2,719$750,000 to $999,999
- 1,090$1,000,000 to $1,499,999
- 333$1,500,000 to $1,999,999
- 268$2,000,000 or more
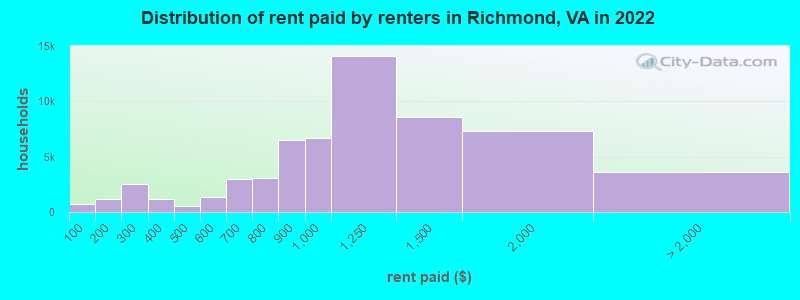
Rent paid by renters in 2022 in Richmond, VA
-
- 721Less than $100
- 478$100 to $149
- 732$150 to $199
- 1,531$200 to $249
- 961$250 to $299
- 664$300 to $349
- 486$350 to $399
- 159$400 to $449
- 374$450 to $499
- 789$500 to $549
- 522$550 to $599
- 1,844$600 to $649
- 1,177$650 to $699
- 1,265$700 to $749
- 1,790$750 to $799
- 6,476$800 to $899
- 6,673$900 to $999
- 14,075$1,000 to $1,249
- 8,549$1,250 to $1,499
- 7,327$1,500 to $1,999
- 1,454$2,000 to $2,499
- 753$2,500 to $2,999
- 62$3,000 to $3,499
- 91$3,500 or more
- 1,280No cash rent
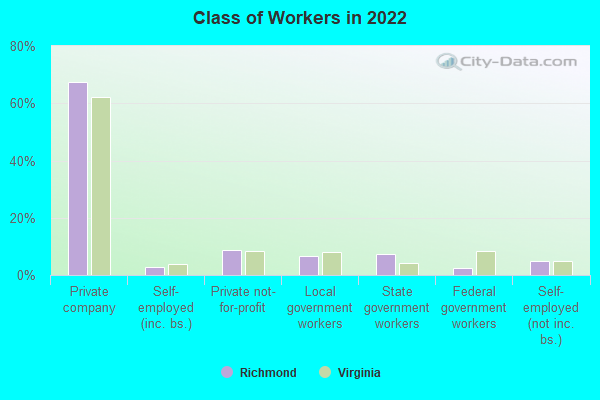
Percentage of workers working in this county: 65.9%
Number of people working at home: 25,388 (20.7% of all workers)
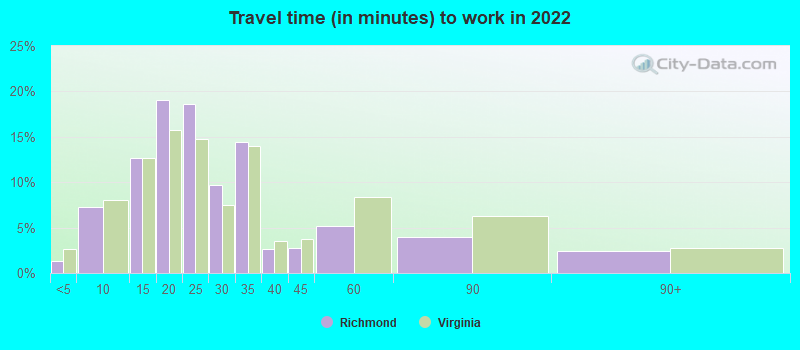
Travel time to work (commute)
- Less than 5 minutes: 1,261
- 5 to 9 minutes: 11,763
- 10 to 14 minutes: 20,002
- 15 to 19 minutes: 20,886
- 20 to 24 minutes: 17,649
- 25 to 29 minutes: 5,435
- 30 to 34 minutes: 9,778
- 35 to 39 minutes: 1,596
- 40 to 44 minutes: 2,201
- 45 to 59 minutes: 2,929
- 60 to 89 minutes: 2,165
- 90 or more minutes: 1,537
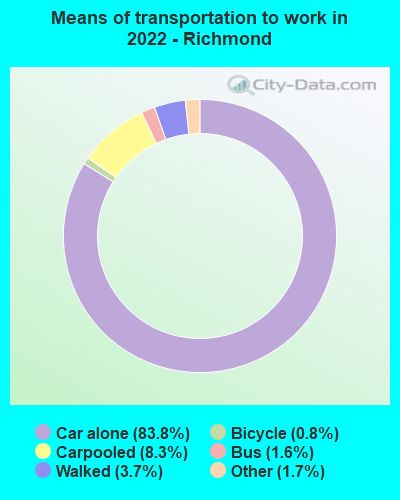
Means of transportation to work:
- Drove a car alone: 137,095 (72.5%)
- Carpooled: 13,645 (7.2%)
- Bus: 2,595 (1.4%)
- Long-distance train or commuter rail: 37 (0.0%)
- Taxi: 2,856 (1.5%)
- Bicycle: 1,340 (0.7%)
- Walked: 6,041 (3.2%)
- Worked at home: 25,388 (13.4%)
- Unemployment by race in 2022
- Unemployment rate for White non-Hispanic residents
- 3.8%Males
- 1.5%Females
- Unemployment rate for Black residents
- 15.6%Males
- 11.0%Females
- Unemployment rate for American Indian and Alaska Native residents
- 12.5%Males
- 18.0%Females
- Unemployment rate for Asian residents
- 0.4%Males
- 7.6%Females
- Unemployment rate for other race residents
- 1.2%Males
- 8.4%Females
- Unemployment rate for two or more race residents
- 2.6%Males
- 5.3%Females
- Unemployment rate for Hispanic or Latino residents
- 1.5%Males
- 6.1%Females
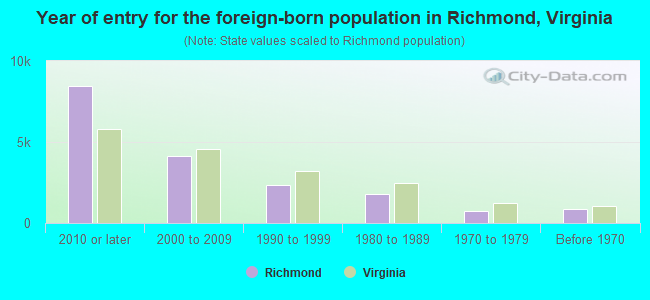
- Year of entry for the foreign-born population in Richmond, Virginia
- 8,4322010 or later
- 4,1072000 to 2009
- 2,3531990 to 1999
- 1,7751980 to 1989
- 7641970 to 1979
- 866Before 1970
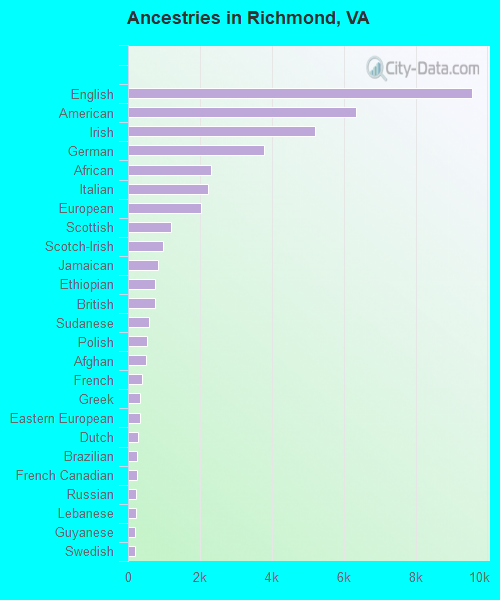
First ancestries reported:
- English: 9,565 (7.7%)
- American: 6,349 (5.1%)
- Irish: 5,191 (4.2%)
- German: 3,782 (3.0%)
- African: 2,305 (1.8%)
- Italian: 2,222 (1.8%)
- European: 2,026 (1.6%)
- Scottish: 1,193 (1.0%)
- Scotch-Irish: 986 (0.8%)
- Jamaican: 828 (0.7%)
- Ethiopian: 761 (0.6%)
- British: 758 (0.6%)
- Sudanese: 591 (0.5%)
- Polish: 542 (0.4%)
- Afghan: 497 (0.4%)
- French: 393 (0.3%)
- Greek: 344 (0.3%)
- Eastern European: 343 (0.3%)
- Dutch: 277 (0.2%)
- Brazilian: 253 (0.2%)
- French Canadian: 238 (0.2%)
- Russian: 236 (0.2%)
- Lebanese: 216 (0.2%)
- Guyanese: 207 (0.2%)
- Swedish: 185 (0.1%)
- Egyptian: 182 (0.1%)
- Norwegian: 178 (0.1%)
- Nigerian: 165 (0.1%)
- Iranian: 160 (0.1%)
- Barbadian: 156 (0.1%)
- Welsh: 148 (0.1%)
- Sierra Leonean: 136 (0.1%)
- Bahamian: 134 (0.1%)
- Senegalese: 129 (0.1%)
- Haitian: 125 (0.1%)
- West Indian: 124 (0.10%)
- Turkish: 114 (0.09%)
- Lithuanian: 105 (0.08%)
- Danish: 101 (0.08%)
- Swiss: 99 (0.08%)
- Northern European: 96 (0.08%)
- Canadian: 89 (0.07%)
- Armenian: 85 (0.07%)
- Czech: 84 (0.07%)
- Scandinavian: 74 (0.06%)
- Arab: 72 (0.06%)
- Israeli: 62 (0.05%)
- Palestinian: 58 (0.05%)
- Ukrainian: 57 (0.05%)
- Austrian: 55 (0.04%)
- South African: 51 (0.04%)
- Trinidadian and Tobagonian: 50 (0.04%)
- Romanian: 48 (0.04%)
- Hungarian: 48 (0.04%)
- Ghanaian: 44 (0.04%)
- Slovak: 43 (0.03%)
- British West Indian: 42 (0.03%)
- Iraqi: 41 (0.03%)
- Serbian: 40 (0.03%)
- Yugoslavian: 40 (0.03%)
- Somali: 35 (0.03%)
- Slovene: 34 (0.03%)
- Cajun: 34 (0.03%)
- Ugandan: 31 (0.02%)
- New Zealander: 29 (0.02%)
- Croatian: 28 (0.02%)
- Portuguese: 26 (0.02%)
- Estonian: 22 (0.02%)
- Jordanian: 20 (0.02%)
- Belgian: 20 (0.02%)
- Zimbabwean: 19 (0.02%)
- Bulgarian: 16 (0.01%)
- Albanian: 14 (0.01%)
- Celtic: 13 (0.01%)
- Belizean: 13 (0.01%)
- Syrian: 9 (0.01%)
- Finnish: 8 (0.01%)
- Icelander: 8 (0.01%)
Most common places of birth for foreign-born residents (%):
| Richmond: | 15.1% (2,588) |
| Virginia: | 3.3% (35,938) |
| Richmond: | 10.4% (1,784) |
| Virginia: | 9.9% (107,534) |
| Richmond: | 6.9% (1,173) |
| Virginia: | 5.3% (57,498) |
| Richmond: | 6.7% (1,142) |
| Virginia: | 3.0% (32,892) |
| Richmond: | 3.8% (655) |
| Virginia: | 9.0% (97,830) |
| Richmond: | 2.8% (478) |
| Virginia: | 3.9% (42,989) |
| Richmond: | 2.6% (447) |
| Virginia: | 2.9% (32,082) |
| Richmond: | 2.6% (438) |
| Virginia: | 1.8% (19,426) |
| Richmond: | 2.2% (374) |
| Virginia: | 0.2% (2,575) |
| Richmond: | 1.9% (321) |
| Virginia: | 1.0% (10,734) |
| Richmond: | 1.7% (299) |
| Virginia: | 4.9% (52,857) |
| Richmond: | 1.7% (290) |
| Virginia: | 0.5% (5,899) |
Place of birth for U.S.-born residents:
- This state: 137,207
- Other state: 71,911
- Northeast: 25,028
- Midwest: 9,762
- South: 30,199
- West: 6,922
82.3% of Richmond residents lived in the same house 1 years ago.
Out of people who lived in different houses, 31.5% lived in this county.
Out of people who lived in different counties, 69.0% lived in Virginia.
| Richmond: | 82.3% |
| State average: | 86.6% |
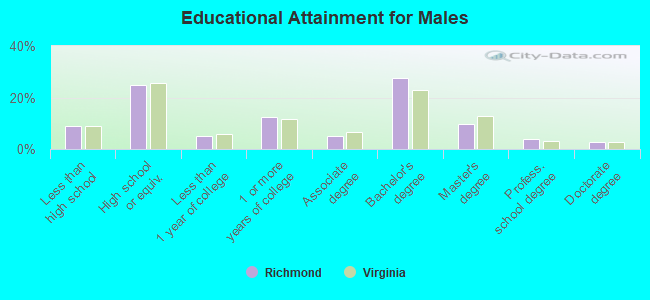
Education attainment for males 25 years and older:
- No schooling: 800
- Nursery to 4th grade: 320
- 5th and 6th grade: 890
- 7th and 8th grade: 946
- 9th grade: 176
- 10th grade: 1,110
- 11th grade: 1,706
- 12th grade, no diploma: 740
- High school graduate (or equivalency): 19,020
- Less than 1 year of college: 3,740
- Some college more than 1 year, no degree: 9,449
- Associate degree: 3,971
- Bachelor's degree: 20,951
- Master's degree: 7,346
- Professional school degree: 3,040
- Doctorate degree: 2,044
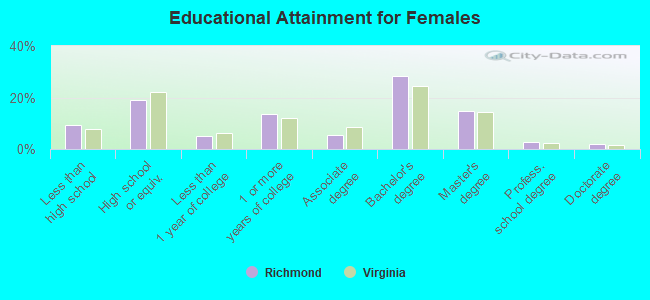
Education attainment for females 25 years and older:
- No schooling: 1,165
- Nursery to 4th grade: 181
- 5th and 6th grade: 632
- 7th and 8th grade: 929
- 9th grade: 330
- 10th grade: 2,112
- 11th grade: 1,394
- 12th grade, no diploma: 851
- High school graduate (or equivalency): 15,818
- Less than 1 year of college: 4,296
- Some college more than 1 year, no degree: 11,238
- Associate degree: 4,500
- Bachelor's degree: 23,506
- Master's degree: 12,207
- Professional school degree: 2,311
- Doctorate degree: 1,612
Housing units in structures:
- One, detached: 52,122
- One, attached: 9,837
- Two: 4,699
- 3 or 4: 5,849
- 5 to 9: 8,625
- 10 to 19: 5,710
- 20 to 49: 8,115
- 50 or more: 17,233
- Mobile homes: 1,107
- Boats, RVs, vans, etc.: 176
Housing units lacking complete kitchen facilities in 2022: 0.9%
House/condo owner moved in on average 11 years ago
Renter moved in on average 2 years ago
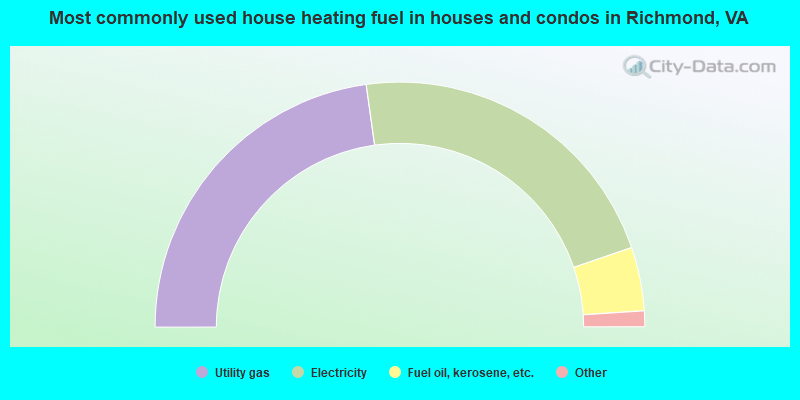
- 45.6%Utility gas
- 43.9%Electricity
- 8.4%Fuel oil, kerosene, etc.
- 1.2%Bottled, tank, or LP gas
- 0.3%No fuel used
- 0.2%Solar energy
- 0.2%Wood
- 0.2%Other fuel

- 69.4%Electricity
- 26.2%Utility gas
- 1.4%Fuel oil, kerosene, etc.
- 1.2%Bottled, tank, or LP gas
- 0.8%No fuel used
- 0.7%Other fuel
- 0.2%Wood
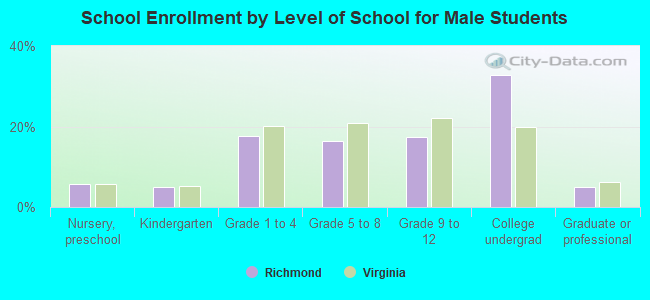
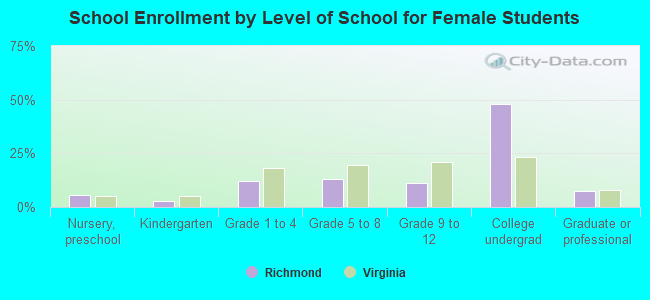
Private vs. public school enrollment:
| Here: | 10.3% |
| Virginia: | 13.2% |
| Here: | 13.2% |
| Virginia: | 10.2% |
| Here: | 16.5% |
| Virginia: | 18.7% |