Schenectady, NY (New York) Houses and Residents
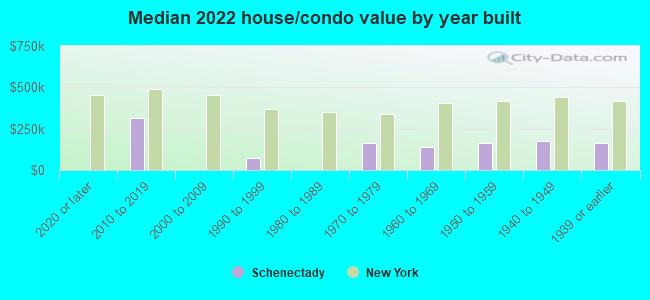
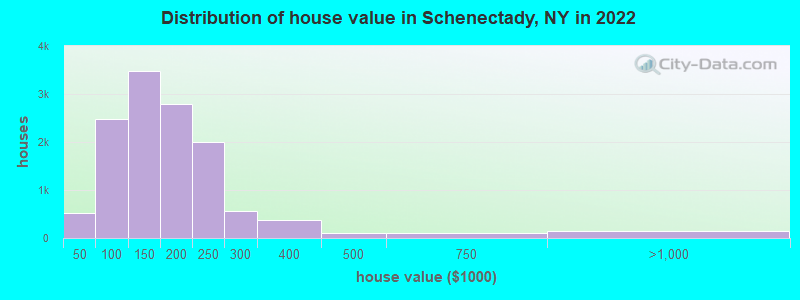
Estimated median house or condo value in 2022: $165,700 (it was $69,200 in 2000 )
Schenectady:
$165,700New York:
$400,400
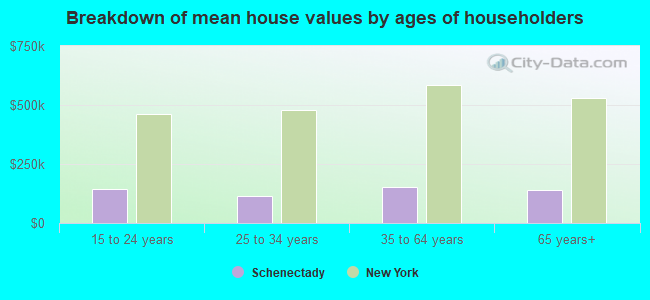
Lower value quartile - upper value quartile: $123,500 - $224,700Mean price in 2022: Detached houses: $172,199 Here:
$172,199State:
$476,719
Townhouses or other attached units: $470,680 Here:
$470,680State:
$699,270
In 2-unit structures: $165,137 Here:
$165,137State:
$713,077
In 3-to-4-unit structures: $1,168,330 Here:
$1,168,330State:
$764,568
In 5-or-more-unit structures: $286,940 Here:
$286,940State:
$912,009
Mobile homes: $59,788 Here:
$59,788State:
$88,925
Total population: 65,936 (Urban population: 61,908, Rural population: 0)
Houses: 30,302 (27,636 occupied: 14,221 owner occupied, 13,415 renter occupied )
% of renters here:
49%State:
46%
Housing density: 2,793 houses/condos per square mile
Median price asked for vacant for-sale houses and condos in 2022: $360,507.
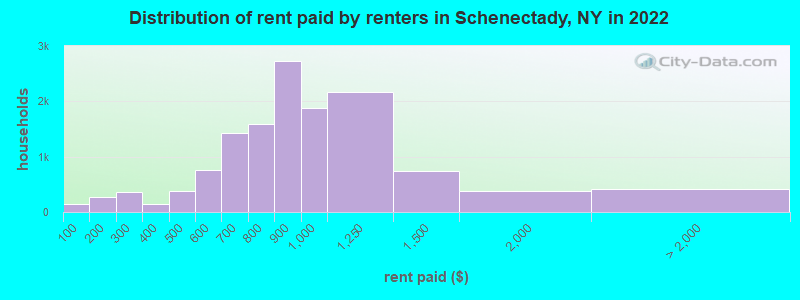
Median contract rent in 2022: $856 (lower quartile is $689, upper quartile is $1,025)
Median rent asked for vacant for-rent units in 2022: $1,794
Median gross rent in Schenectady, NY in 2022: $1,068
Housing units in Schenectady with a mortgage: 7,745 (721 second mortgage, 65 home equity loan, 489 both second mortgage and home equity loan )Houses without a mortgage: 239
Median household income for houses/condos with a mortgage: $79,895
Median household income for apartments without a mortgage: $69,000
Median monthly housing costs: $1,062
Data:
Median house or condo value ($)
Median house or condo value ($ change since 2000)
Median house or condo value ($) - White
Median house or condo value ($) - Black or African American
Median house or condo value ($) - Asian
Median house or condo value ($) - Hispanic or Latino
Median house or condo value ($) - American Indian and Alaska Native
Median house or condo value ($) - Multirace
Median house or condo value ($) - Other Race
Median price asked for mobile homes ($)
Household density (households per square mile)
Mean house or condo value by units in structure - 1, detached ($)
Mean house or condo value by units in structure - 1, attached ($)
Mean house or condo value by units in structure - 2 ($)
Mean house or condo value by units in structure by units in structure - 3 or 4 ($)
Mean house or condo value by units in structure - 5 or more ($)
Mean house or condo value by units in structure - Boat, RV, van, etc. ($)
Mean house or condo value by units in structure - Mobile home ($)
Median contract rent ($)
Median contract rent - Lower quartile ($)
Median contract rent - Upper quartile ($)
Median gross rent ($)
Urban houses (%)
Rural houses (%)
Houses occupied (%)
Houses occupied (% change since 2000)
Houses owner occupied (%)
Houses owner occupied (% change since 2000)
Houses renter occupied (%)
Houses renter occupied (% change since 2000)
Vacant housing units - For rent (%)
Vacant housing units - For rent (% change since 2000)
Vacant housing units - For sale only (%)
Vacant housing units - For sale only (% change since 2000)
Vacant housing units - Rented or sold, not occupied (%)
Vacant housing units - Rented or sold, not occupied (% change since 2000)
Vacant housing units - For seasonal, recreational, or occasional use (%)
Vacant housing units - For seasonal, recreational, or occasional use (% change since 2000)
Vacant housing units - For migrant workers (%)
Vacant housing units - For migrant workers (% change since 2000)
Vacant housing units - Other vacant (%)
Vacant housing units - Other vacant (% change since 2000)
Median monthly housing costs ($)
Median household income for houses/condos with a mortgage ($)
Median household income for houses/condos without a mortgage ($)
Median household income ($)
Median household income ($) - White
Median household income ($) - Black or African American
Median household income ($) - Asian
Median household income ($) - Hispanic or Latino
Median household income ($) - American Indian and Alaska Native
Median household income ($) - Multirace
Median household income ($) - Other Race
Mortgage status - with mortgage (%)
Mortgage status - with second mortgage (%)
Mortgage status - with home equity loan (%)
Mortgage status - with both second mortgage and home equity loan (%)
Mortgage status - without a mortgage (%)
Median year house/condo built
Median year apartment built
Household type by relationship - Male householder living alone (%)
Household type by relationship - Male householder not living alone (%)
Household type by relationship - Female householder living alone (%)
Household type by relationship - Female householder not living alone (%)
Household type by relationship - Opposite-Sex spouse (%)
Household type by relationship - Same-Sex spouse (%)
Household type by relationship - Opposite-Sex unmarried partner (%)
Household type by relationship - Same-Sex unmarried partner (%)
Household type by relationship - In group quarters (%)
Size of family households - 2-person household (%)
Size of family households - 3-person household (%)
Size of family households - 4-person household (%)
Size of family households - 5-person household (%)
Size of family households - 6-person household (%)
Size of family households - 7-or-more-person household (%)
Size of nonfamily households - 1-person household (%)
Size of nonfamily households - 2-person household (%)
Size of nonfamily households - 3-person household (%)
Size of nonfamily households - 4-person household (%)
Size of nonfamily households - 5-person household (%)
Size of nonfamily households - 6-person household (%)
Size of nonfamily households - 7-or-moreperson household (%)
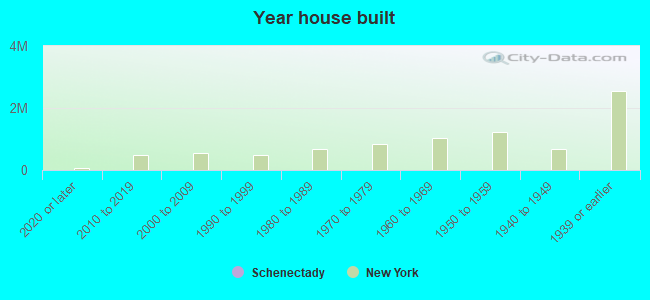
Year house built - Built 2010 or later (%)
Year house built - Built 2000 to 2009 (%)
Year house built - Built 1990 to 1999 (%)
Year house built - Built 1980 to 1989 (%)
Year house built - Built 1970 to 1979 (%)
Year house built - Built 1960 to 1969 (%)
Year house built - Built 1950 to 1959 (%)
Year house built - Built 1940 to 1949 (%)
Year house built - Built 1939 or earlier (%)
Median number of rooms in houses and condos
Median number of rooms in apartments
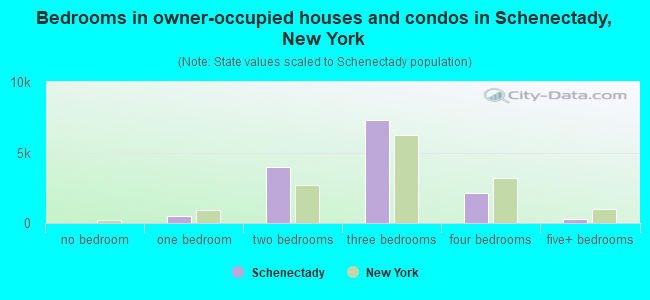
Median number of bedrooms in owner occupied houses
Mean number of bedrooms in owner occupied houses
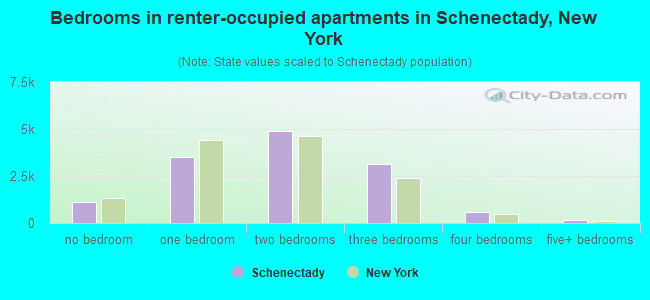
Median number of bedrooms in renter occupied houses
Mean number of bedrooms in renter occupied houses
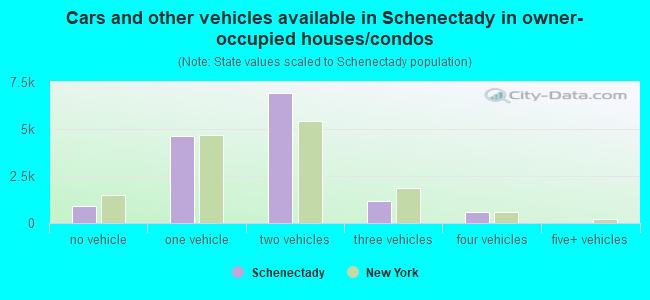
Median number of vehichles in owner occupied houses
Mean number of vehichles in owner occupied houses
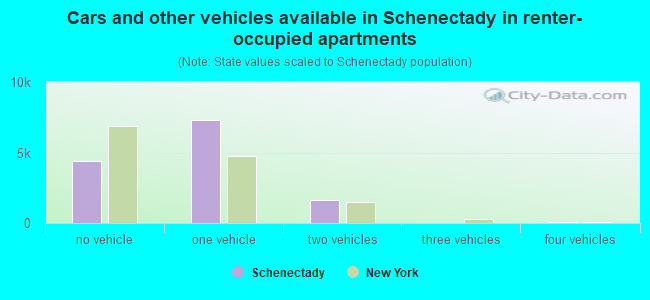
Median number of vehichles in renter occupied houses
Mean number of vehichles in renter occupied houses
Rooms in owner-occupied houses - 1 room (%)
Rooms in owner-occupied houses - 2 rooms (%)
Rooms in owner-occupied houses - 3 rooms (%)
Rooms in owner-occupied houses - 4 rooms (%)
Rooms in owner-occupied houses - 5 rooms (%)
Rooms in owner-occupied houses - 6 rooms (%)
Rooms in owner-occupied houses - 7 rooms (%)
Rooms in owner-occupied houses - 8 rooms (%)
Rooms in owner-occupied houses - 9+ rooms (%)
Rooms in renter-occupied houses - 1 room (%)
Rooms in renter-occupied houses - 2 rooms (%)
Rooms in renter-occupied houses - 3 rooms (%)
Rooms in renter-occupied houses - 4 rooms (%)
Rooms in renter-occupied houses - 5 rooms (%)
Rooms in renter-occupied houses - 6 rooms (%)
Rooms in renter-occupied houses - 7 rooms (%)
Rooms in renter-occupied houses - 8 rooms (%)
Rooms in renter-occupied houses - 9+ rooms (%)
Bedrooms in owner-occupied houses - no bedrooms (%)
Bedrooms in owner-occupied houses - 1 bedroom (%)
Bedrooms in owner-occupied houses - 2 bedrooms (%)
Bedrooms in owner-occupied houses - 3 bedrooms (%)
Bedrooms in owner-occupied houses - 4 bedrooms (%)
Bedrooms in owner-occupied houses - 5+ bedrooms (%)
Bedrooms in renter-occupied houses - no bedrooms (%)
Bedrooms in renter-occupied houses - 1 bedroom (%)
Bedrooms in renter-occupied houses - 2 bedrooms (%)
Bedrooms in renter-occupied houses - 3 bedrooms (%)
Bedrooms in renter-occupied houses - 4 bedrooms (%)
Bedrooms in renter-occupied houses - 5+ bedrooms (%)
Vehicles available in owner-occupied houses - no vehicle available (%)
Vehicles available in owner-occupied houses - 1 vehicle available(%)
Vehicles available in owner-occupied houses - 2 Vehicles available (%)
Vehicles available in owner-occupied houses - 3 Vehicles available (%)
Vehicles available in owner-occupied houses - 4 Vehicles available (%)
Vehicles available in owner-occupied houses - 5+ Vehicles available (%)
Vehicles available in renter-occupied houses - no vehicle available (%)
Vehicles available in renter-occupied houses - 1 vehicle available (%)
Vehicles available in renter-occupied houses - 2 Vehicles available (%)
Vehicles available in renter-occupied houses - 3 Vehicles available (%)
Vehicles available in renter-occupied houses - 4 Vehicles available (%)
Vehicles available in renter-occupied houses - 5+ Vehicles available (%)
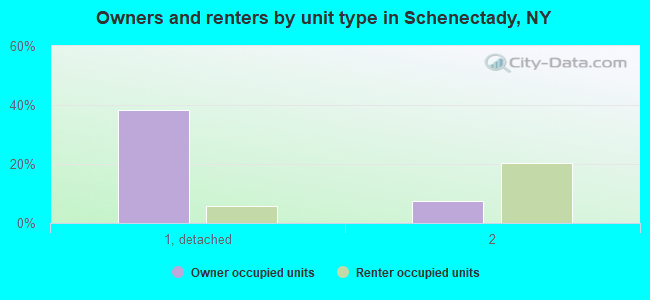
Housing units in structures - 1, detached (%)
Housing units in structures - 1, attached (%)
Housing units in structures - 2 (%)
Housing units in structures - 3 or 4 (%)
Housing units in structures - 5 to 9 (%)
Housing units in structures - 10 to 19 (%)
Housing units in structures - 20 to 49 (%)
Housing units in structures - 50 or more (%)
Housing units in structures - Mobile home (%)
Housing units in structures - Boat, RV, van, etc. (%)
Housing units in structures - Owners - 1, detached (%)
Housing units in structures - Owners - 1, attached (%)
Housing units in structures - Owners - 2 (%)
Housing units in structures - Owners - 3 or 4 (%)
Housing units in structures - Owners - 5 to 9 (%)
Housing units in structures - Owners - 10 to 19 (%)
Housing units in structures - Owners - 20 to 49 (%)
Housing units in structures - Owners - 50 or more (%)
Housing units in structures - Owners - Mobile home (%)
Housing units in structures - Owners - Boat, RV, van, etc. (%)
Housing units in structures - Renters - 1, detached (%)
Housing units in structures - Renters - 1, attached (%)
Housing units in structures - Renters - 2 (%)
Housing units in structures - Renters - 3 or 4 (%)
Housing units in structures - Renters - 5 to 9 (%)
Housing units in structures - Renters - 10 to 19 (%)
Housing units in structures - Renters - 20 to 49 (%)
Housing units in structures - Renters - 50 or more (%)
Housing units in structures - Renters - Mobile home (%)
Housing units in structures - Renters - Boat, RV, van, etc. (%)
House/condo owner moved in on average (years ago)
Renter moved in on average (years ago)
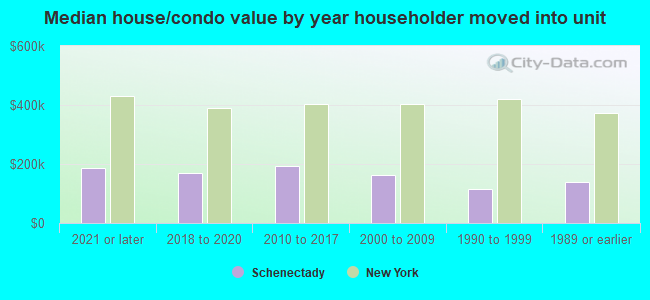
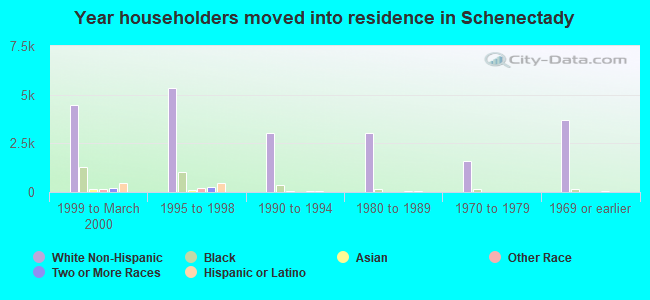
Year householder moved into unit - Moved in 1999 to March 2000 (%)
Year householder moved into unit - Moved in 1999 to March 2000 (%) - White
Year householder moved into unit - Moved in 1999 to March 2000 (%) - Black or African American
Year householder moved into unit - Moved in 1999 to March 2000 (%) - Asian
Year householder moved into unit - Moved in 1999 to March 2000 (%) - Hispanic or Latino
Year householder moved into unit - Moved in 1999 to March 2000 (%) - American Indian and Alaska Native
Year householder moved into unit - Moved in 1999 to March 2000 (%) - Multirace
Year householder moved into unit - Moved in 1999 to March 2000 (%) - Other Race
Year householder moved into unit - Moved in 1995 to 1998 (%)
Year householder moved into unit - Moved in 1995 to 1998 (%) - White
Year householder moved into unit - Moved in 1995 to 1998 (%) - Black or African American
Year householder moved into unit - Moved in 1995 to 1998 (%) - Asian
Year householder moved into unit - Moved in 1995 to 1998 (%) - Hispanic or Latino
Year householder moved into unit - Moved in 1995 to 1998 (%) - American Indian and Alaska Native
Year householder moved into unit - Moved in 1995 to 1998 (%) - Multirace
Year householder moved into unit - Moved in 1995 to 1998 (%) - Other Race
Year householder moved into unit - Moved in 1990 to 1994 (%)
Year householder moved into unit - Moved in 1990 to 1994 (%) - White
Year householder moved into unit - Moved in 1990 to 1994 (%) - Black or African American
Year householder moved into unit - Moved in 1990 to 1994 (%) - Asian
Year householder moved into unit - Moved in 1990 to 1994 (%) - Hispanic or Latino
Year householder moved into unit - Moved in 1990 to 1994 (%) - American Indian and Alaska Native
Year householder moved into unit - Moved in 1990 to 1994 (%) - Multirace
Year householder moved into unit - Moved in 1990 to 1994 (%) - Other Race
Year householder moved into unit - Moved in 1980 to 1989 (%)
Year householder moved into unit - Moved in 1980 to 1989 (%) - White
Year householder moved into unit - Moved in 1980 to 1989 (%) - Black or African American
Year householder moved into unit - Moved in 1980 to 1989 (%) - Asian
Year householder moved into unit - Moved in 1980 to 1989 (%) - Hispanic or Latino
Year householder moved into unit - Moved in 1980 to 1989 (%) - American Indian and Alaska Native
Year householder moved into unit - Moved in 1980 to 1989 (%) - Multirace
Year householder moved into unit - Moved in 1980 to 1989 (%) - Other Race
Year householder moved into unit - Moved in 1970 to 1979 (%)
Year householder moved into unit - Moved in 1970 to 1979 (%) - White
Year householder moved into unit - Moved in 1970 to 1979 (%) - Black or African American
Year householder moved into unit - Moved in 1970 to 1979 (%) - Asian
Year householder moved into unit - Moved in 1970 to 1979 (%) - Hispanic or Latino
Year householder moved into unit - Moved in 1970 to 1979 (%) - American Indian and Alaska Native
Year householder moved into unit - Moved in 1970 to 1979 (%) - Multirace
Year householder moved into unit - Moved in 1970 to 1979 (%) - Other Race
Year householder moved into unit - Moved in 1969 or earlier (%)
Year householder moved into unit - Moved in 1969 or earlier (%) - White
Year householder moved into unit - Moved in 1969 or earlier (%) - Black or African American
Year householder moved into unit - Moved in 1969 or earlier (%) - Asian
Year householder moved into unit - Moved in 1969 or earlier (%) - Hispanic or Latino
Year householder moved into unit - Moved in 1969 or earlier (%) - American Indian and Alaska Native
Year householder moved into unit - Moved in 1969 or earlier (%) - Multirace
Year householder moved into unit - Moved in 1969 or earlier (%) - Other Race
Housing units lacking complete plumbing facilities (%)
Housing units lacking complete kitchen facilities (%)
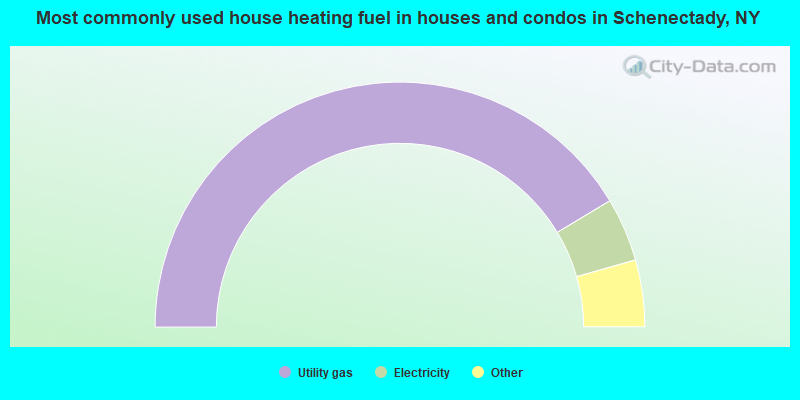
House heating fuel used in houses and condos - Utility gas (%)
House heating fuel used in houses and condos - Bottled, tank, or LP gas (%)
House heating fuel used in houses and condos - Electricity (%)
House heating fuel used in houses and condos - Fuel oil, kerosene, etc. (%)
House heating fuel used in houses and condos - Coal or coke (%)
House heating fuel used in houses and condos - Wood (%)
House heating fuel used in houses and condos - Solar energy (%)
House heating fuel used in houses and condos - Other fuel (%)
House heating fuel used in houses and condos - No fuel used (%)
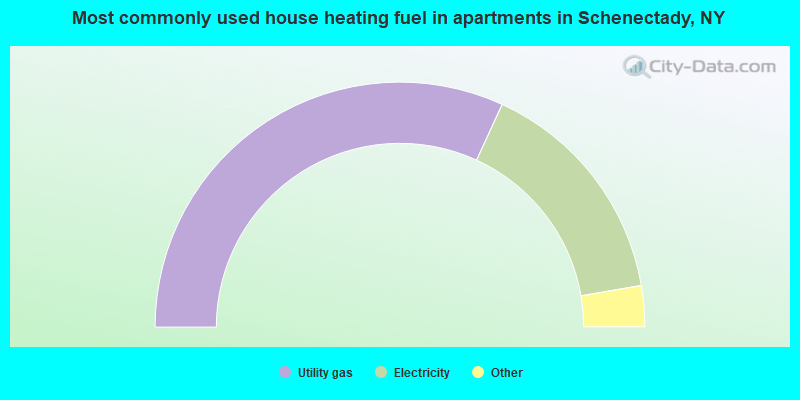
House heating fuel used in apartments - Utility gas (%)
House heating fuel used in apartments - Bottled, tank, or LP gas (%)
House heating fuel used in apartments - Electricity (%)
House heating fuel used in apartments - Fuel oil, kerosene, etc. (%)
House heating fuel used in apartments - Coal or coke (%)
House heating fuel used in apartments - Wood (%)
House heating fuel used in apartments - Solar energy (%)
House heating fuel used in apartments - Other fuel (%)
House heating fuel used in apartments - No fuel used (%)
Latest news about housing in Schenectady, NY collected exclusively by city-data.com from local newspapers, TV, and radio stations
Median year house/condo built: 1938Median year apartment built: 1947Household type by relationship:
Households: 68,810
Male householders: 13,334 (4,565 living alone ), Female householders: 14,302 (5,416 living alone )10,089 spouses (10,032 opposite-sex spouses ), 2,808 unmarried partners , (2,711 opposite-sex unmarried partners ), 20,781 children (20,083 natural , 262 adopted , 436 stepchildren ), 705 grandchildren , 628 brothers or sisters , 796 parents , 0 foster children , 157 other relatives , 1,288 non-relatives In group quarters: 3,922
Size of family households: 5,134 2-persons , 6,316 3-persons , 920 4-persons , 1,408 5-persons , 422 6-persons , 257 7-or-more-persons .
Size of nonfamily households: 9,981 1-person , 3,198 2-persons .
8,930 married couples with children. single-parent households (1,337 men , 3,129 women ).
88.1% of residents of Schenectady speak English at home. of residents speak Spanish at home (59% speak English very well , 26% speak English well , 10% speak English not well , 5% don't speak English at all ).of residents speak other Indo-European language at home (68% speak English very well , 17% speak English well , 13% speak English not well , 2% don't speak English at all ).of residents speak Asian or Pacific Island language at home (66% speak English very well , 24% speak English well , 10% speak English not well , 1% don't speak English at all ).of residents speak other language at home (60% speak English very well , 29% speak English well , 8% speak English not well , 3% don't speak English at all ).
Foreign born population: 12,892 (18.7%)of them are naturalized citizens )
Median number of rooms in houses and condos:
Median number of rooms in apartments
Owner-occupied Renter-occupied
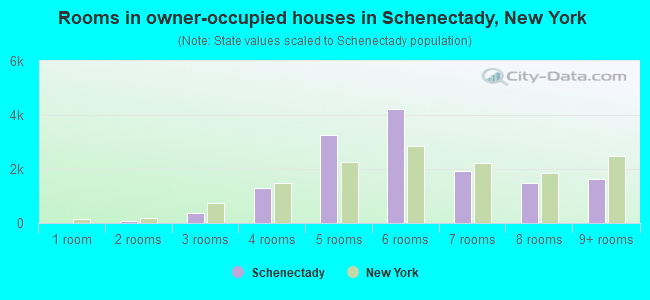
Rooms in owner-occupied houses in Schenectady, New York
0 1 room 59 2 rooms 365 3 rooms 1,284 4 rooms 3,253 5 rooms 4,211 6 rooms 1,921 7 rooms 1,494 8 rooms 1,634 9+ rooms
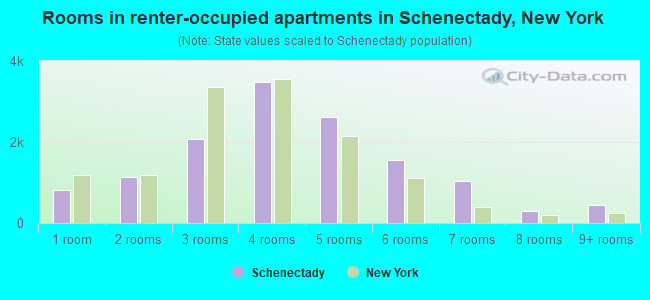
Rooms in renter-occupied apartments in Schenectady, New York
817 1 room 1,130 2 rooms 2,068 3 rooms 3,473 4 rooms 2,605 5 rooms 1,546 6 rooms 1,045 7 rooms 289 8 rooms 442 9+ rooms
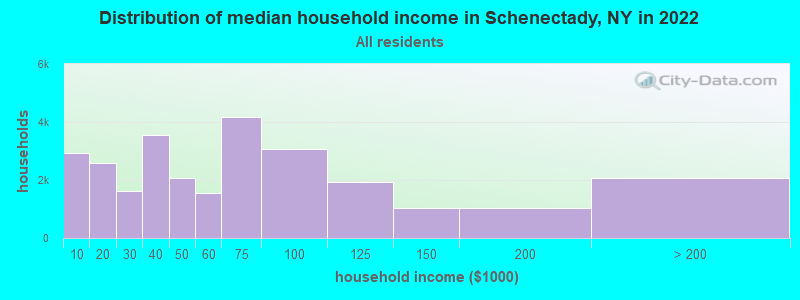
Schenectady, NY household income distribution 2,934 Less than $10,0002,597 $10,000 to $19,9991,620 $20,000 to $29,9993,553 $30,000 to $39,9992,064 $40,000 to $49,9991,549 $50,000 to $59,9994,188 $60,000 to $74,9993,052 $75,000 to $99,9991,943 $100,000 to $124,9991,030 $125,000 to $149,9991,048 $150,000 to $199,9992,058 $200,000 or more
Home value of owner - occupied houses in 2022 in Schenectady, NY 269 Less than $10,00017 $10,000 to $14,99936 $15,000 to $19,99919 $20,000 to $24,99946 $25,000 to $29,99958 $30,000 to $34,99970 $40,000 to $49,999211 $50,000 to $59,999379 $60,000 to $69,999203 $70,000 to $79,999824 $80,000 to $89,999786 $90,000 to $99,9991,573 $100,000 to $124,9991,914 $125,000 to $149,9991,848 $150,000 to $174,999938 $175,000 to $199,9991,998 $200,000 to $249,999554 $250,000 to $299,999382 $300,000 to $399,999110 $400,000 to $499,99999 $500,000 to $749,99984 $750,000 to $999,99942 $1,000,000 to $1,499,9999 $2,000,000 or moreRent paid by renters in 2022 in Schenectady, NY 145 Less than $100278 $150 to $199283 $200 to $24971 $250 to $29993 $300 to $34951 $350 to $399266 $400 to $449118 $450 to $499339 $500 to $549425 $550 to $599601 $600 to $649827 $650 to $699437 $700 to $7491,157 $750 to $7992,728 $800 to $8991,888 $900 to $9992,169 $1,000 to $1,249750 $1,250 to $1,499371 $1,500 to $1,999158 $2,000 to $2,49974 $2,500 to $2,999186 No cash rent
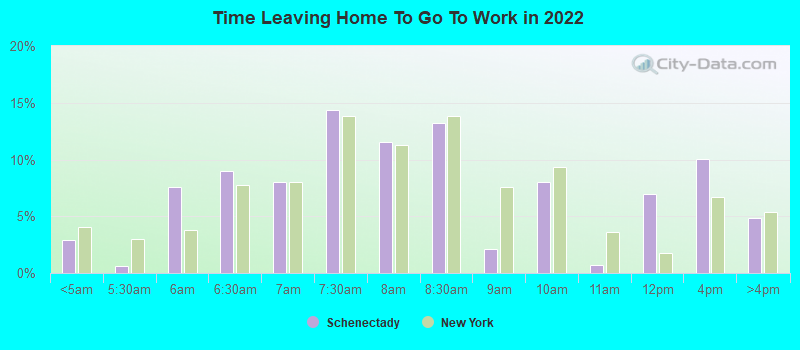
Percentage of workers working in this county: 62.9%Number of people working at home: 3,009 (9.6% of all workers )
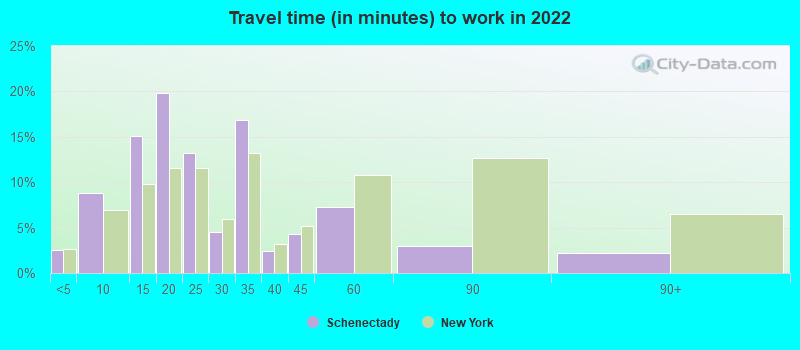
Travel time to work (commute)
Less than 5 minutes: 5085 to 9 minutes: 3,90210 to 14 minutes: 5,53415 to 19 minutes: 3,69420 to 24 minutes: 4,05625 to 29 minutes: 2,06130 to 34 minutes: 5,02735 to 39 minutes: 36640 to 44 minutes: 1,28845 to 59 minutes: 69960 to 89 minutes: 79390 or more minutes: 336
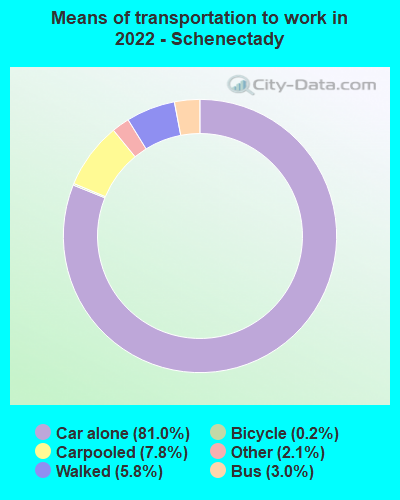
Means of transportation to work:
Drove a car alone: 23,995 (71.6%)Carpooled: 2,514 (7.5%)Bus : 935 (2.8%)Light rail, streetcar or trolley : 6 (0.0%)Ferryboat: 10 (0.0%)Taxi: 1,089 (3.2%)Bicycle: 62 (0.2%)Walked: 1,351 (4.0%)Worked at home: 3,009 (9.0%)
Unemployment by race in 2022
Unemployment rate for White non-Hispanic residents 0.7% Males0.7% FemalesUnemployment rate for Black residents 20.6% Males8.0% FemalesUnemployment rate for American Indian and Alaska Native residents 9.6% MalesUnemployment rate for Asian residents 2.7% Males8.9% FemalesUnemployment rate for other race residents 4.6% Males10.9% FemalesUnemployment rate for two or more race residents 10.0% Males11.6% FemalesUnemployment rate for Hispanic or Latino residents 9.3% Males13.8% Females
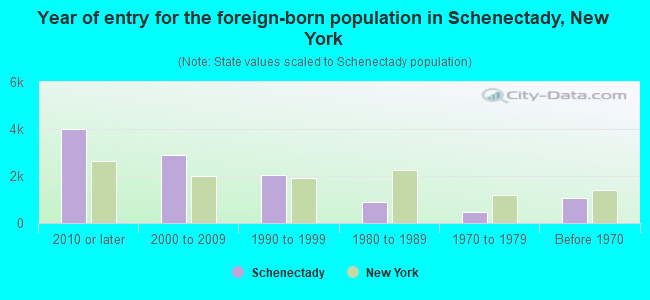
Year of entry for the foreign-born population in Schenectady, New York
4,016 2010 or later 2,894 2000 to 2009 2,054 1990 to 1999 905 1980 to 1989 472 1970 to 1979 1,043 Before 1970
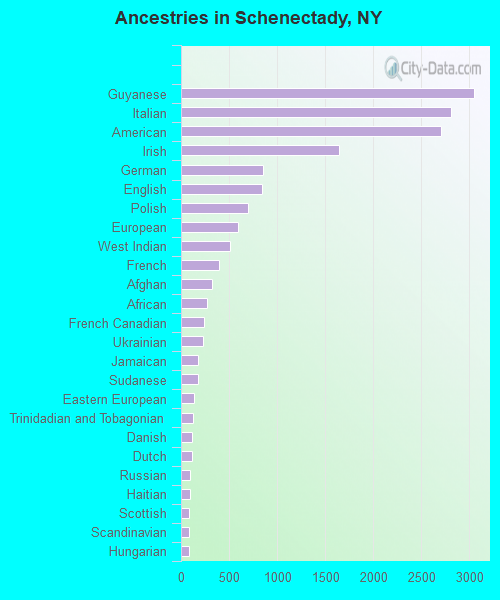
First ancestries reported:
Guyanese: 3,055 (9.0%)
Italian: 2,816 (8.3%)
American: 2,705 (7.9%)
Irish: 1,648 (4.8%)
German: 852 (2.5%)
English: 845 (2.5%)
Polish: 697 (2.0%)
European: 596 (1.8%)
West Indian: 507 (1.5%)
French: 392 (1.2%)
Afghan: 319 (0.9%)
African: 270 (0.8%)
French Canadian: 243 (0.7%)
Ukrainian: 226 (0.7%)
Jamaican: 181 (0.5%)
Sudanese: 178 (0.5%)
Eastern European: 133 (0.4%)
Trinidadian and Tobagonian: 125 (0.4%)
Danish: 116 (0.3%)
Dutch: 115 (0.3%)
Russian: 93 (0.3%)
Haitian: 92 (0.3%)
Scottish: 84 (0.2%)
Scandinavian: 82 (0.2%)
Hungarian: 80 (0.2%)
Arab: 75 (0.2%)
British West Indian: 65 (0.2%)
Welsh: 57 (0.2%)
Swedish: 55 (0.2%)
Egyptian: 54 (0.2%)
Greek: 50 (0.1%)
Slovak: 43 (0.1%)
Finnish: 41 (0.1%)
Scotch-Irish: 40 (0.1%)
Nigerian: 36 (0.1%)
Canadian: 34 (0.10%)
Czech: 31 (0.09%)
Lithuanian: 31 (0.09%)
British: 30 (0.09%)
Armenian: 29 (0.09%)
Northern European: 28 (0.08%)
Romanian: 23 (0.07%)
Portuguese: 22 (0.06%)
U.S. Virgin Islander: 22 (0.06%)
Norwegian: 15 (0.04%)
Croatian: 9 (0.03%)
Czechoslovakian: 6 (0.02%)
Latvian: 5 (0.01%)
Most common places of birth for foreign-born residents (%): Guyana Schenectady:
54.2% (5,714)New York:
3.8% (172,129)
Afghanistan Schenectady:
4.3% (458)New York:
0.2% (8,745)
India Schenectady:
3.8% (406)New York:
3.5% (158,432)
Trinidad and Tobago Schenectady:
2.6% (270)New York:
2.0% (91,428)
Peru Schenectady:
2.5% (264)New York:
1.2% (54,759)
Dominican Republic Schenectady:
2.3% (245)New York:
11.1% (501,040)
Other Western Africa Schenectady:
2.3% (244)New York:
0.4% (19,133)
Jamaica Schenectady:
2.0% (211)New York:
5.0% (227,557)
China, excluding Hong Kong and Taiwan Schenectady:
1.8% (190)New York:
9.1% (410,910)
Kuwait Schenectady:
1.5% (161)New York:
0.0% (1,860)
Place of birth for U.S.-born residents:
This state: 46,550Other state: 8,147Northeast: 3,940Midwest: 1,701South: 1,444West: 1,062 84.1% of Schenectady residents lived in the same house 1 years ago.
Out of people who lived in different houses, 26.2% lived in this county.
Out of people who lived in different counties, 68.1% lived in New York.
Schenectady:
84.1%State average:
89.6%
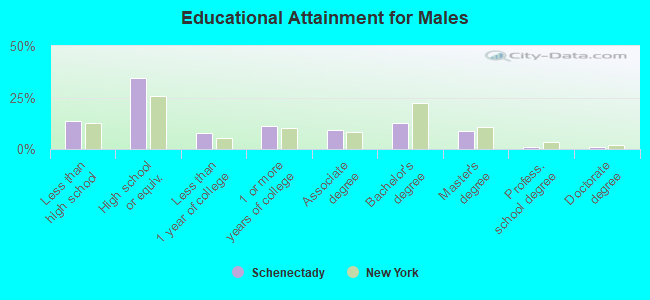
Education attainment for males 25 years and older:
No schooling: 699Nursery to 4th grade: 865th and 6th grade: 2167th and 8th grade: 1859th grade: 33410th grade: 51111th grade: 27312th grade, no diploma: 677High school graduate (or equivalency): 7,598Less than 1 year of college: 1,721Some college more than 1 year, no degree: 2,449Associate degree: 2,063Bachelor's degree: 2,817Master's degree: 1,884Professional school degree: 260Doctorate degree: 162
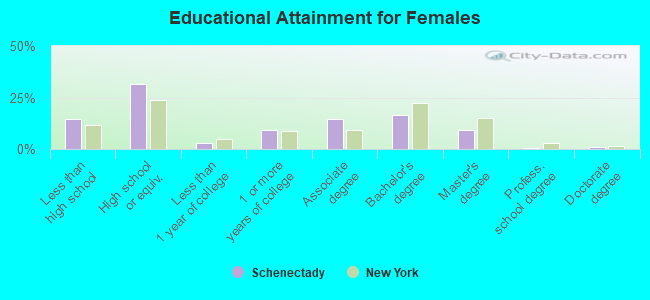
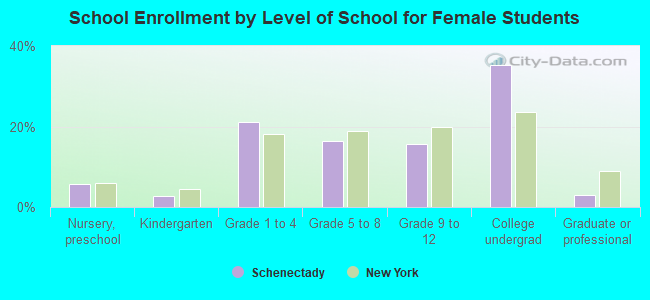
Education attainment for females 25 years and older:
No schooling: 814Nursery to 4th grade: 3665th and 6th grade: 1997th and 8th grade: 09th grade: 5910th grade: 011th grade: 43512th grade, no diploma: 1,526High school graduate (or equivalency): 7,381Less than 1 year of college: 689Some college more than 1 year, no degree: 2,159Associate degree: 3,407Bachelor's degree: 3,837Master's degree: 2,098Professional school degree: 161Doctorate degree: 210
Housing units in structures:
One, detached: 13,862One, attached: 847Two: 7,0533 or 4: 2,7705 to 9: 1,53710 to 19: 1,21920 to 49: 1,00150 or more: 2,013Housing units lacking complete plumbing facilities in 2022: 0.5%Housing units lacking complete kitchen facilities in 2022: 1.1%House/condo owner moved in on average 9 years ago
Renter moved in on average 3 years ago
Private vs. public school enrollment:
Students in private schools in grades 1 to 8 (elementary and middle school): 291 Students in private schools in grades 9 to 12 (high school): 152 Students in private undergraduate colleges: 3,828