Seneca, SC (South Carolina) Houses and Residents
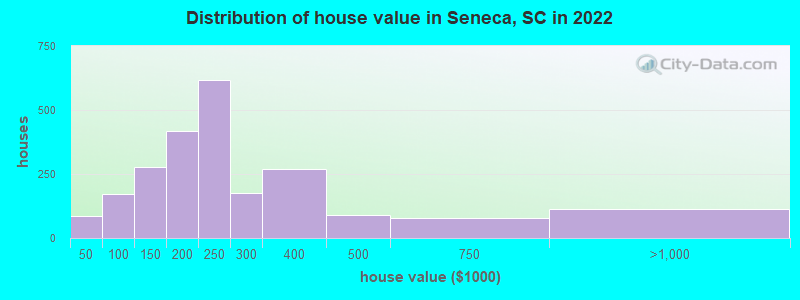
Estimated median house or condo value in 2022: $219,467 (it was $86,500 in 2000 )
Seneca:
$219,467South Carolina:
$254,600
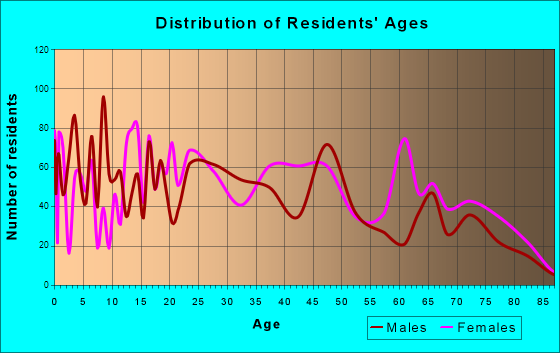
Lower value quartile - upper value quartile: $101,816 - $288,566Total population: 8,246 (Urban population: 7,660 (all inside urban clusters), Rural population: 289 (all nonfarm) )
Houses: 4,388 (4,048 occupied: 2,496 owner occupied, 1,966 renter occupied )
% of renters here:
44%State:
28%
Housing density: 622 houses/condos per square mile
Median price asked for vacant for-sale houses and condos in 2022: $195,656.
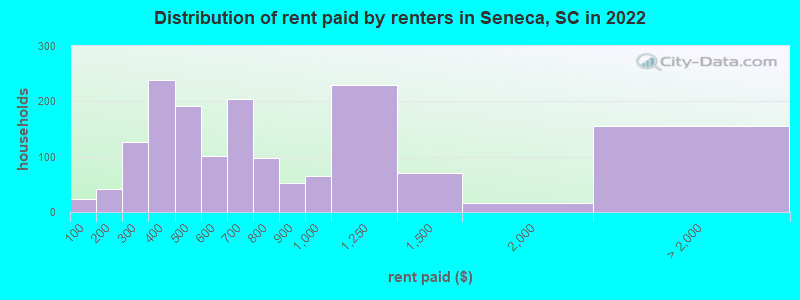
Median contract rent in 2022: $522 (lower quartile is $308, upper quartile is $821)
Median rent asked for vacant for-rent units in 2022: $7,736
Median gross rent in Seneca, SC in 2022: $619
Housing units in Seneca with a mortgage: 1,278 (43 second mortgage, 0 home equity loan, 44 both second mortgage and home equity loan )Houses without a mortgage: 75
Median household income for houses/condos with a mortgage: $78,234
Median household income for apartments without a mortgage: $63,202
Median monthly housing costs: $577
Data:
Median house or condo value ($)
Median house or condo value ($ change since 2000)
Median house or condo value ($) - White
Median house or condo value ($) - Black or African American
Median house or condo value ($) - Asian
Median house or condo value ($) - Hispanic or Latino
Median house or condo value ($) - American Indian and Alaska Native
Median house or condo value ($) - Multirace
Median house or condo value ($) - Other Race
Median price asked for mobile homes ($)
Household density (households per square mile)
Mean house or condo value by units in structure - 1, detached ($)
Mean house or condo value by units in structure - 1, attached ($)
Mean house or condo value by units in structure - 2 ($)
Mean house or condo value by units in structure by units in structure - 3 or 4 ($)
Mean house or condo value by units in structure - 5 or more ($)
Mean house or condo value by units in structure - Boat, RV, van, etc. ($)
Mean house or condo value by units in structure - Mobile home ($)
Median contract rent ($)
Median contract rent - Lower quartile ($)
Median contract rent - Upper quartile ($)
Median gross rent ($)
Urban houses (%)
Rural houses (%)
Houses occupied (%)
Houses occupied (% change since 2000)
Houses owner occupied (%)
Houses owner occupied (% change since 2000)
Houses renter occupied (%)
Houses renter occupied (% change since 2000)
Vacant housing units - For rent (%)
Vacant housing units - For rent (% change since 2000)
Vacant housing units - For sale only (%)
Vacant housing units - For sale only (% change since 2000)
Vacant housing units - Rented or sold, not occupied (%)
Vacant housing units - Rented or sold, not occupied (% change since 2000)
Vacant housing units - For seasonal, recreational, or occasional use (%)
Vacant housing units - For seasonal, recreational, or occasional use (% change since 2000)
Vacant housing units - For migrant workers (%)
Vacant housing units - For migrant workers (% change since 2000)
Vacant housing units - Other vacant (%)
Vacant housing units - Other vacant (% change since 2000)
Median monthly housing costs ($)
Median household income for houses/condos with a mortgage ($)
Median household income for houses/condos without a mortgage ($)
Median household income ($)
Median household income ($) - White
Median household income ($) - Black or African American
Median household income ($) - Asian
Median household income ($) - Hispanic or Latino
Median household income ($) - American Indian and Alaska Native
Median household income ($) - Multirace
Median household income ($) - Other Race
Mortgage status - with mortgage (%)
Mortgage status - with second mortgage (%)
Mortgage status - with home equity loan (%)
Mortgage status - with both second mortgage and home equity loan (%)
Mortgage status - without a mortgage (%)
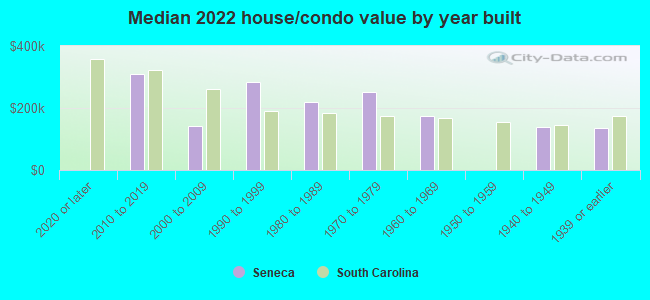
Median year house/condo built
Median year apartment built
Household type by relationship - Male householder living alone (%)
Household type by relationship - Male householder not living alone (%)
Household type by relationship - Female householder living alone (%)
Household type by relationship - Female householder not living alone (%)
Household type by relationship - Opposite-Sex spouse (%)
Household type by relationship - Same-Sex spouse (%)
Household type by relationship - Opposite-Sex unmarried partner (%)
Household type by relationship - Same-Sex unmarried partner (%)
Household type by relationship - In group quarters (%)
Size of family households - 2-person household (%)
Size of family households - 3-person household (%)
Size of family households - 4-person household (%)
Size of family households - 5-person household (%)
Size of family households - 6-person household (%)
Size of family households - 7-or-more-person household (%)
Size of nonfamily households - 1-person household (%)
Size of nonfamily households - 2-person household (%)
Size of nonfamily households - 3-person household (%)
Size of nonfamily households - 4-person household (%)
Size of nonfamily households - 5-person household (%)
Size of nonfamily households - 6-person household (%)
Size of nonfamily households - 7-or-moreperson household (%)
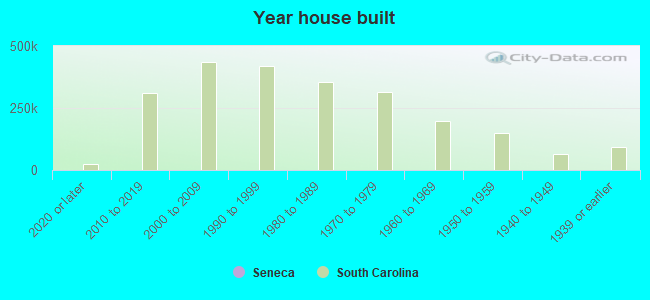
Year house built - Built 2010 or later (%)
Year house built - Built 2000 to 2009 (%)
Year house built - Built 1990 to 1999 (%)
Year house built - Built 1980 to 1989 (%)
Year house built - Built 1970 to 1979 (%)
Year house built - Built 1960 to 1969 (%)
Year house built - Built 1950 to 1959 (%)
Year house built - Built 1940 to 1949 (%)
Year house built - Built 1939 or earlier (%)
Median number of rooms in houses and condos
Median number of rooms in apartments
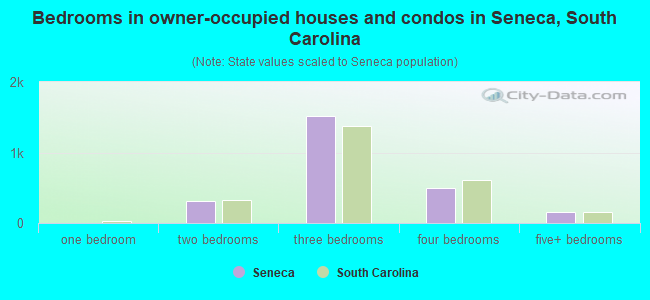
Median number of bedrooms in owner occupied houses
Mean number of bedrooms in owner occupied houses
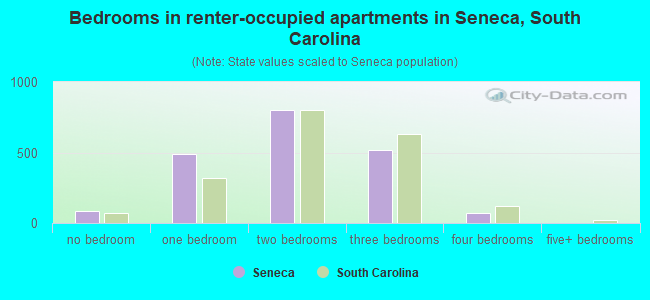
Median number of bedrooms in renter occupied houses
Mean number of bedrooms in renter occupied houses
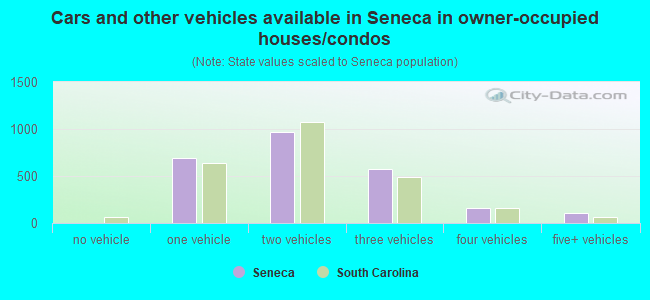
Median number of vehichles in owner occupied houses
Mean number of vehichles in owner occupied houses
Median number of vehichles in renter occupied houses
Mean number of vehichles in renter occupied houses
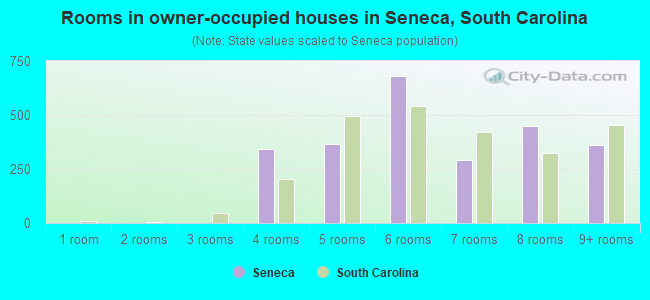
Rooms in owner-occupied houses - 1 room (%)
Rooms in owner-occupied houses - 2 rooms (%)
Rooms in owner-occupied houses - 3 rooms (%)
Rooms in owner-occupied houses - 4 rooms (%)
Rooms in owner-occupied houses - 5 rooms (%)
Rooms in owner-occupied houses - 6 rooms (%)
Rooms in owner-occupied houses - 7 rooms (%)
Rooms in owner-occupied houses - 8 rooms (%)
Rooms in owner-occupied houses - 9+ rooms (%)
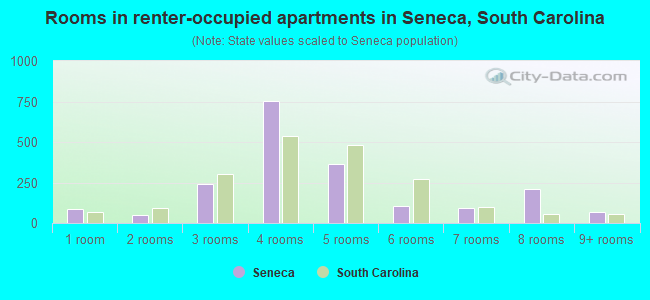
Rooms in renter-occupied houses - 1 room (%)
Rooms in renter-occupied houses - 2 rooms (%)
Rooms in renter-occupied houses - 3 rooms (%)
Rooms in renter-occupied houses - 4 rooms (%)
Rooms in renter-occupied houses - 5 rooms (%)
Rooms in renter-occupied houses - 6 rooms (%)
Rooms in renter-occupied houses - 7 rooms (%)
Rooms in renter-occupied houses - 8 rooms (%)
Rooms in renter-occupied houses - 9+ rooms (%)
Bedrooms in owner-occupied houses - no bedrooms (%)
Bedrooms in owner-occupied houses - 1 bedroom (%)
Bedrooms in owner-occupied houses - 2 bedrooms (%)
Bedrooms in owner-occupied houses - 3 bedrooms (%)
Bedrooms in owner-occupied houses - 4 bedrooms (%)
Bedrooms in owner-occupied houses - 5+ bedrooms (%)
Bedrooms in renter-occupied houses - no bedrooms (%)
Bedrooms in renter-occupied houses - 1 bedroom (%)
Bedrooms in renter-occupied houses - 2 bedrooms (%)
Bedrooms in renter-occupied houses - 3 bedrooms (%)
Bedrooms in renter-occupied houses - 4 bedrooms (%)
Bedrooms in renter-occupied houses - 5+ bedrooms (%)
Vehicles available in owner-occupied houses - no vehicle available (%)
Vehicles available in owner-occupied houses - 1 vehicle available(%)
Vehicles available in owner-occupied houses - 2 Vehicles available (%)
Vehicles available in owner-occupied houses - 3 Vehicles available (%)
Vehicles available in owner-occupied houses - 4 Vehicles available (%)
Vehicles available in owner-occupied houses - 5+ Vehicles available (%)
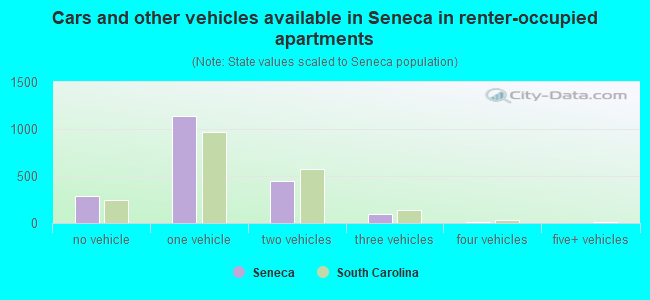
Vehicles available in renter-occupied houses - no vehicle available (%)
Vehicles available in renter-occupied houses - 1 vehicle available (%)
Vehicles available in renter-occupied houses - 2 Vehicles available (%)
Vehicles available in renter-occupied houses - 3 Vehicles available (%)
Vehicles available in renter-occupied houses - 4 Vehicles available (%)
Vehicles available in renter-occupied houses - 5+ Vehicles available (%)
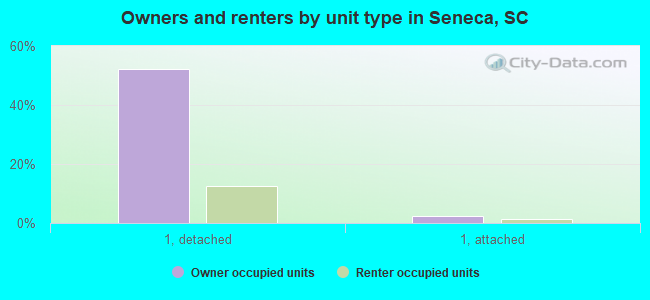
Housing units in structures - 1, detached (%)
Housing units in structures - 1, attached (%)
Housing units in structures - 2 (%)
Housing units in structures - 3 or 4 (%)
Housing units in structures - 5 to 9 (%)
Housing units in structures - 10 to 19 (%)
Housing units in structures - 20 to 49 (%)
Housing units in structures - 50 or more (%)
Housing units in structures - Mobile home (%)
Housing units in structures - Boat, RV, van, etc. (%)
Housing units in structures - Owners - 1, detached (%)
Housing units in structures - Owners - 1, attached (%)
Housing units in structures - Owners - 2 (%)
Housing units in structures - Owners - 3 or 4 (%)
Housing units in structures - Owners - 5 to 9 (%)
Housing units in structures - Owners - 10 to 19 (%)
Housing units in structures - Owners - 20 to 49 (%)
Housing units in structures - Owners - 50 or more (%)
Housing units in structures - Owners - Mobile home (%)
Housing units in structures - Owners - Boat, RV, van, etc. (%)
Housing units in structures - Renters - 1, detached (%)
Housing units in structures - Renters - 1, attached (%)
Housing units in structures - Renters - 2 (%)
Housing units in structures - Renters - 3 or 4 (%)
Housing units in structures - Renters - 5 to 9 (%)
Housing units in structures - Renters - 10 to 19 (%)
Housing units in structures - Renters - 20 to 49 (%)
Housing units in structures - Renters - 50 or more (%)
Housing units in structures - Renters - Mobile home (%)
Housing units in structures - Renters - Boat, RV, van, etc. (%)
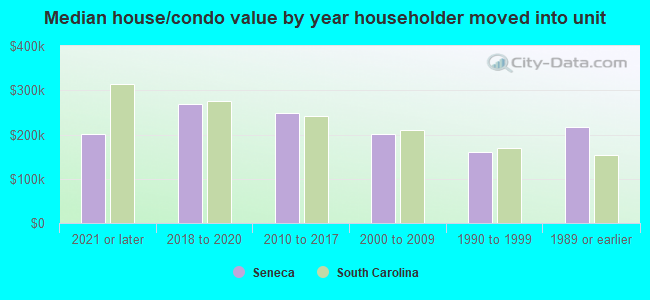
House/condo owner moved in on average (years ago)
Renter moved in on average (years ago)
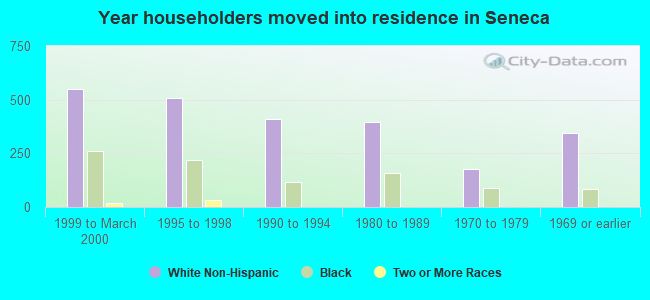
Year householder moved into unit - Moved in 1999 to March 2000 (%)
Year householder moved into unit - Moved in 1999 to March 2000 (%) - White
Year householder moved into unit - Moved in 1999 to March 2000 (%) - Black or African American
Year householder moved into unit - Moved in 1999 to March 2000 (%) - Asian
Year householder moved into unit - Moved in 1999 to March 2000 (%) - Hispanic or Latino
Year householder moved into unit - Moved in 1999 to March 2000 (%) - American Indian and Alaska Native
Year householder moved into unit - Moved in 1999 to March 2000 (%) - Multirace
Year householder moved into unit - Moved in 1999 to March 2000 (%) - Other Race
Year householder moved into unit - Moved in 1995 to 1998 (%)
Year householder moved into unit - Moved in 1995 to 1998 (%) - White
Year householder moved into unit - Moved in 1995 to 1998 (%) - Black or African American
Year householder moved into unit - Moved in 1995 to 1998 (%) - Asian
Year householder moved into unit - Moved in 1995 to 1998 (%) - Hispanic or Latino
Year householder moved into unit - Moved in 1995 to 1998 (%) - American Indian and Alaska Native
Year householder moved into unit - Moved in 1995 to 1998 (%) - Multirace
Year householder moved into unit - Moved in 1995 to 1998 (%) - Other Race
Year householder moved into unit - Moved in 1990 to 1994 (%)
Year householder moved into unit - Moved in 1990 to 1994 (%) - White
Year householder moved into unit - Moved in 1990 to 1994 (%) - Black or African American
Year householder moved into unit - Moved in 1990 to 1994 (%) - Asian
Year householder moved into unit - Moved in 1990 to 1994 (%) - Hispanic or Latino
Year householder moved into unit - Moved in 1990 to 1994 (%) - American Indian and Alaska Native
Year householder moved into unit - Moved in 1990 to 1994 (%) - Multirace
Year householder moved into unit - Moved in 1990 to 1994 (%) - Other Race
Year householder moved into unit - Moved in 1980 to 1989 (%)
Year householder moved into unit - Moved in 1980 to 1989 (%) - White
Year householder moved into unit - Moved in 1980 to 1989 (%) - Black or African American
Year householder moved into unit - Moved in 1980 to 1989 (%) - Asian
Year householder moved into unit - Moved in 1980 to 1989 (%) - Hispanic or Latino
Year householder moved into unit - Moved in 1980 to 1989 (%) - American Indian and Alaska Native
Year householder moved into unit - Moved in 1980 to 1989 (%) - Multirace
Year householder moved into unit - Moved in 1980 to 1989 (%) - Other Race
Year householder moved into unit - Moved in 1970 to 1979 (%)
Year householder moved into unit - Moved in 1970 to 1979 (%) - White
Year householder moved into unit - Moved in 1970 to 1979 (%) - Black or African American
Year householder moved into unit - Moved in 1970 to 1979 (%) - Asian
Year householder moved into unit - Moved in 1970 to 1979 (%) - Hispanic or Latino
Year householder moved into unit - Moved in 1970 to 1979 (%) - American Indian and Alaska Native
Year householder moved into unit - Moved in 1970 to 1979 (%) - Multirace
Year householder moved into unit - Moved in 1970 to 1979 (%) - Other Race
Year householder moved into unit - Moved in 1969 or earlier (%)
Year householder moved into unit - Moved in 1969 or earlier (%) - White
Year householder moved into unit - Moved in 1969 or earlier (%) - Black or African American
Year householder moved into unit - Moved in 1969 or earlier (%) - Asian
Year householder moved into unit - Moved in 1969 or earlier (%) - Hispanic or Latino
Year householder moved into unit - Moved in 1969 or earlier (%) - American Indian and Alaska Native
Year householder moved into unit - Moved in 1969 or earlier (%) - Multirace
Year householder moved into unit - Moved in 1969 or earlier (%) - Other Race
Housing units lacking complete plumbing facilities (%)
Housing units lacking complete kitchen facilities (%)
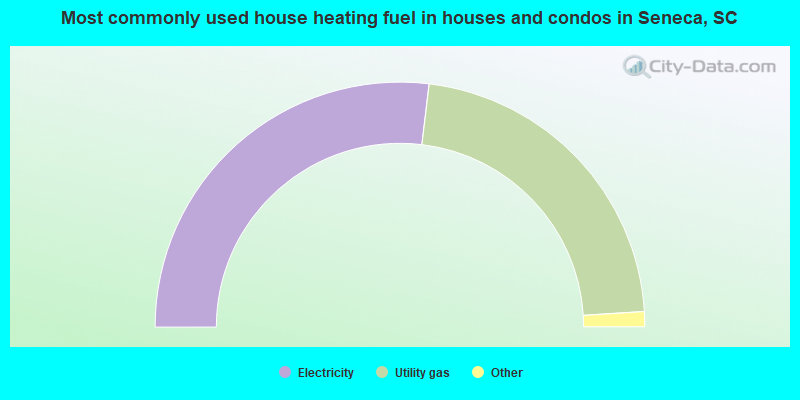
House heating fuel used in houses and condos - Utility gas (%)
House heating fuel used in houses and condos - Bottled, tank, or LP gas (%)
House heating fuel used in houses and condos - Electricity (%)
House heating fuel used in houses and condos - Fuel oil, kerosene, etc. (%)
House heating fuel used in houses and condos - Coal or coke (%)
House heating fuel used in houses and condos - Wood (%)
House heating fuel used in houses and condos - Solar energy (%)
House heating fuel used in houses and condos - Other fuel (%)
House heating fuel used in houses and condos - No fuel used (%)
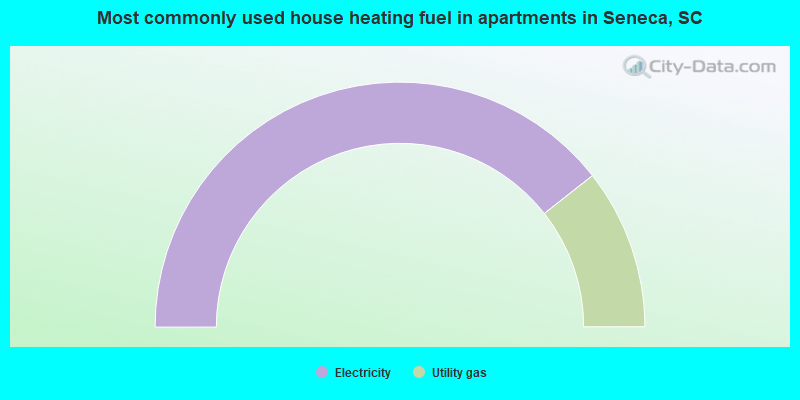
House heating fuel used in apartments - Utility gas (%)
House heating fuel used in apartments - Bottled, tank, or LP gas (%)
House heating fuel used in apartments - Electricity (%)
House heating fuel used in apartments - Fuel oil, kerosene, etc. (%)
House heating fuel used in apartments - Coal or coke (%)
House heating fuel used in apartments - Wood (%)
House heating fuel used in apartments - Solar energy (%)
House heating fuel used in apartments - Other fuel (%)
House heating fuel used in apartments - No fuel used (%)
Latest news about housing in Seneca, SC collected exclusively by city-data.com from local newspapers, TV, and radio stations
Median year house/condo built: 1980Median year apartment built: 1984Household type by relationship:
Households: 8,991
Male householders: 1,824 (860 living alone ), Female householders: 2,199 (879 living alone )1,478 spouses (1,478 opposite-sex spouses ), 109 unmarried partners , (109 opposite-sex unmarried partners ), 2,255 children (2,192 natural , 36 adopted , 26 stepchildren ), 477 grandchildren , 75 brothers or sisters , 64 parents , 0 foster children , 129 other relatives , 241 non-relatives In group quarters: 135
Size of family households: 1,202 2-persons , 510 3-persons , 643 4-persons , 155 5-persons , 45 6-persons .
Size of nonfamily households: 1,640 1-person , 114 2-persons , 31 3-persons .
780 married couples with children. single-parent households (22 men , 402 women ).
97.1% of residents of Seneca speak English at home. of residents speak Spanish at home (48% speak English very well , 35% speak English well , 17% speak English not well ).of residents speak other Indo-European language at home (62% speak English very well , 34% speak English well , 4% speak English not well ).of residents speak Asian or Pacific Island language at home (74% speak English very well , 26% speak English well ).
Foreign born population: 262 (2.9%)of them are naturalized citizens )
Median number of rooms in houses and condos:
Median number of rooms in apartments
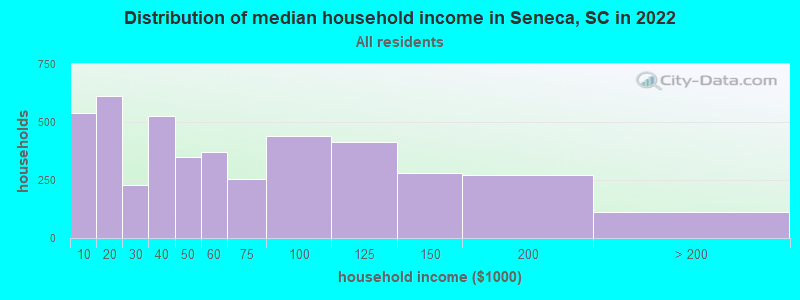
Seneca, SC household income distribution 539 Less than $10,000612 $10,000 to $19,999227 $20,000 to $29,999526 $30,000 to $39,999349 $40,000 to $49,999371 $50,000 to $59,999255 $60,000 to $74,999440 $75,000 to $99,999412 $100,000 to $124,999280 $125,000 to $149,999272 $150,000 to $199,999114 $200,000 or more
Home value of owner - occupied houses in 2022 in Seneca, SC 50 Less than $10,00021 $15,000 to $19,9997 $35,000 to $39,9997 $40,000 to $49,99981 $50,000 to $59,99926 $70,000 to $79,99919 $80,000 to $89,99938 $90,000 to $99,999184 $100,000 to $124,99993 $125,000 to $149,999164 $150,000 to $174,999253 $175,000 to $199,999619 $200,000 to $249,999176 $250,000 to $299,999269 $300,000 to $399,99988 $400,000 to $499,99978 $500,000 to $749,999111 $750,000 to $999,999Rent paid by renters in 2022 in Seneca, SC 24 Less than $10022 $100 to $14919 $150 to $19961 $200 to $24965 $250 to $299158 $300 to $34979 $350 to $39977 $400 to $449113 $450 to $49918 $500 to $54982 $550 to $599167 $600 to $64937 $650 to $69932 $700 to $74964 $750 to $79952 $800 to $89964 $900 to $999228 $1,000 to $1,24970 $1,250 to $1,49916 $1,500 to $1,999155 No cash rent
Percentage of workers working in this county: 64.4%Number of people working at home: 131 (3.2% of all workers )
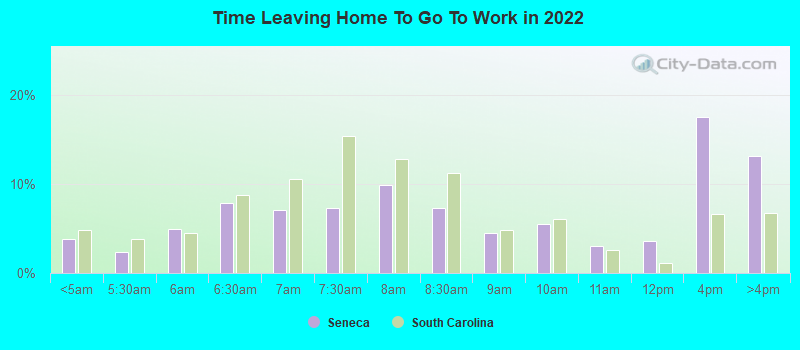
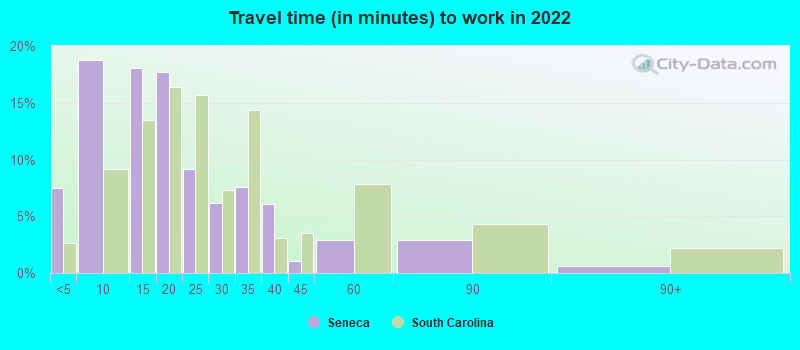
Travel time to work (commute)
Less than 5 minutes: 3185 to 9 minutes: 97910 to 14 minutes: 76515 to 19 minutes: 54920 to 24 minutes: 36525 to 29 minutes: 14530 to 34 minutes: 8335 to 39 minutes: 18940 to 44 minutes: 12545 to 59 minutes: 23360 to 89 minutes: 21890 or more minutes: 38
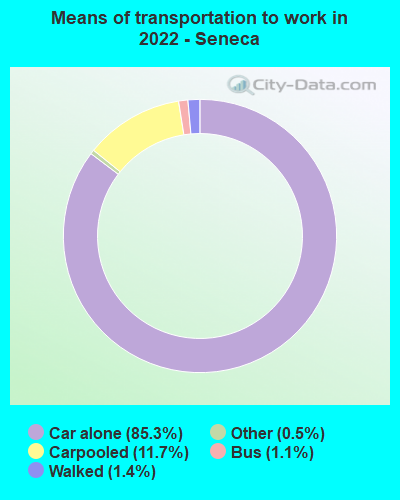
Means of transportation to work:
Drove a car alone: 3,361 (80.2%)Carpooled: 482 (11.5%)Bus : 41 (1.0%)Taxi: 23 (0.5%)Walked: 51 (1.2%)Worked at home: 131 (3.1%)
Unemployment by race in 2022
Unemployment rate for White non-Hispanic residents 8.8% Males2.8% FemalesUnemployment rate for two or more race residents 96.2% FemalesUnemployment rate for Hispanic or Latino residents 84.0% Females
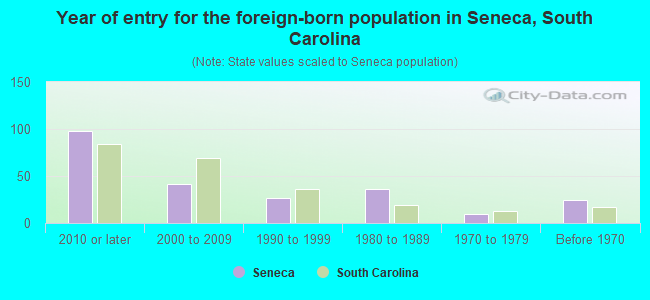
Year of entry for the foreign-born population in Seneca, South Carolina
98 2010 or later 42 2000 to 2009 27 1990 to 1999 36 1980 to 1989 10 1970 to 1979 24 Before 1970
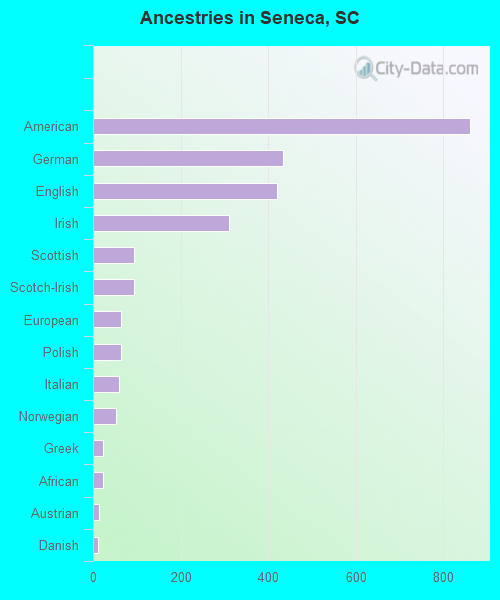
First ancestries reported:
American: 861 (20.5%)
German: 434 (10.3%)
English: 421 (10.0%)
Irish: 311 (7.4%)
Scottish: 94 (2.2%)
Scotch-Irish: 93 (2.2%)
European: 64 (1.5%)
Polish: 64 (1.5%)
Italian: 60 (1.4%)
Norwegian: 52 (1.2%)
Greek: 23 (0.5%)
African: 22 (0.5%)
Austrian: 14 (0.3%)
Danish: 12 (0.3%)
British: 6 (0.1%)
Northern European: 6 (0.1%)
Russian: 1 (0.02%) Most common places of birth for foreign-born residents (%): Dominican Republic Seneca:
24.7% (53)South Carolina:
0.9% (2,357)
Ecuador Seneca:
16.7% (36)South Carolina:
0.9% (2,502)
China, excluding Hong Kong and Taiwan Seneca:
10.2% (22)South Carolina:
3.2% (8,721)
Other Eastern Europe Seneca:
7.4% (16)South Carolina:
0.3% (753)
Philippines Seneca:
7.4% (16)South Carolina:
4.1% (11,031)
Germany Seneca:
7.4% (16)South Carolina:
3.7% (9,982)
Bolivia Seneca:
7.4% (16)South Carolina:
0.3% (698)
England Seneca:
4.2% (9)South Carolina:
1.9% (5,117)
Mexico Seneca:
4.2% (9)South Carolina:
22.5% (60,774)
United Kingdom, excluding England and Scotland Seneca:
3.7% (8)South Carolina:
1.2% (3,296)
Place of birth for U.S.-born residents:
This state: 4,836Other state: 3,733Northeast: 964Midwest: 894South: 1,631West: 131 78.8% of Seneca residents lived in the same house 1 years ago.
Out of people who lived in different houses, 31.8% lived in this county.
Out of people who lived in different counties, 18.7% lived in South Carolina.
Seneca:
78.8%State average:
86.5%
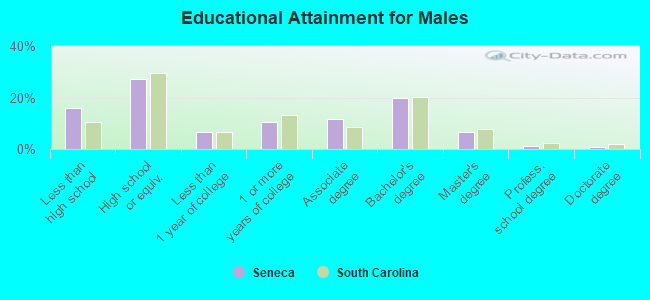
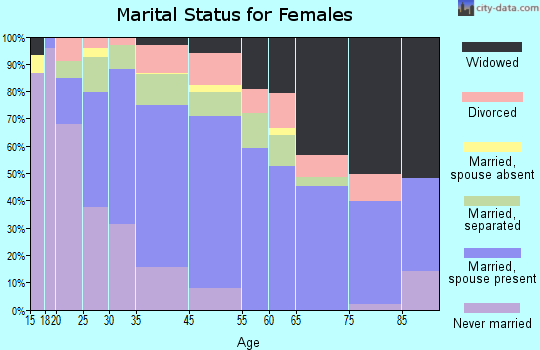
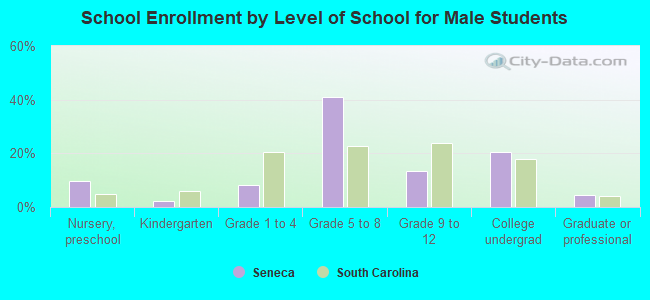
Education attainment for males 25 years and older:
No schooling: 60Nursery to 4th grade: 05th and 6th grade: 07th and 8th grade: 1439th grade: 610th grade: 21311th grade: 9012th grade, no diploma: 0High school graduate (or equivalency): 863Less than 1 year of college: 209Some college more than 1 year, no degree: 332Associate degree: 376Bachelor's degree: 633Master's degree: 210Professional school degree: 40Doctorate degree: 19
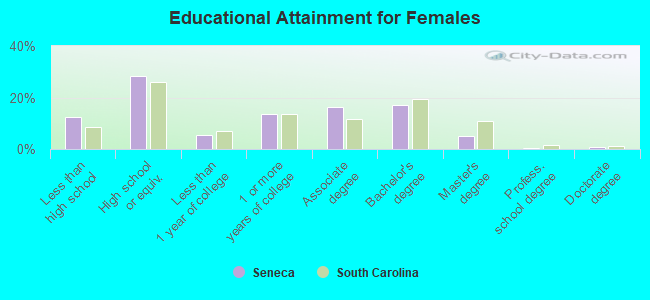
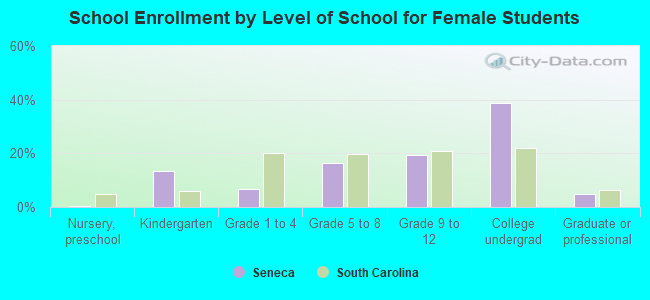
Education attainment for females 25 years and older:
No schooling: 0Nursery to 4th grade: 135th and 6th grade: 87th and 8th grade: 409th grade: 8310th grade: 6511th grade: 14512th grade, no diploma: 120High school graduate (or equivalency): 1,058Less than 1 year of college: 205Some college more than 1 year, no degree: 517Associate degree: 612Bachelor's degree: 647Master's degree: 188Professional school degree: 19Doctorate degree: 35
Housing units in structures:
One, detached: 2,854One, attached: 176Two: 1793 or 4: 3535 to 9: 23210 to 19: 17220 to 49: 14150 or more: 134Mobile homes: 145Housing units lacking complete plumbing facilities in 2022: 2.9%Housing units lacking complete kitchen facilities in 2022: 3.6%House/condo owner moved in on average 11 years ago
Renter moved in on average 5 years ago
Private vs. public school enrollment:
Students in private schools in grades 1 to 8 (elementary and middle school): 105 Here:
19.2%South Carolina:
14.4%
Students in private schools in grades 9 to 12 (high school): 32 Here:
12.7%South Carolina:
11.1%
Students in private undergraduate colleges: 165 Here:
36.2%South Carolina:
21.9%