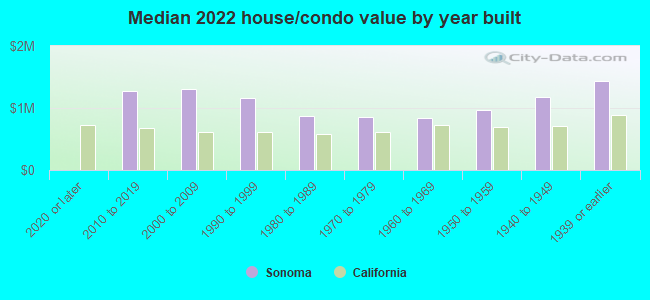
Sonoma, CA (California) Houses and Residents
| Sonoma: | $952,497 |
| California: | $715,900 |
Mean price in 2022:
Detached houses: $1,455,474
Here: $1,455,474 State: $988,808 Townhouses or other attached units: $778,653
Here: $778,653 State: $838,546 In 2-unit structures: $1,170,903
Here: $1,170,903 State: $1,138,100 In 3-to-4-unit structures: $633,892
Here: $633,892 State: $824,253 In 5-or-more-unit structures: $503,013
Here: $503,013 State: $730,996 Mobile homes: $130,899
Here: $130,899 State: $184,506
Total population: 11,017 (Urban population: 8,878 (all inside urban clusters), Rural population: 0)
Houses: 5,886 (5,417 occupied: 3,369 owner occupied, 2,110 renter occupied)
| % of renters here: | 39% |
| State: | 44% |
Housing density: 2,220 houses/condos per square mile
Median price asked for vacant for-sale houses and condos in 2022: $3,231,068.
Median contract rent in 2022: $1,923 (lower quartile is $1,414, upper quartile is over $2,000)
Median rent asked for vacant for-rent units in 2022: $14,087
Median gross rent in Sonoma, CA in 2022: over $2,000
Housing units in Sonoma with a mortgage: 1,870 (332 second mortgage, 64 home equity loan, 251 both second mortgage and home equity loan)
Houses without a mortgage: 0
Median household income for houses/condos with a mortgage: $163,490
Median household income for apartments without a mortgage: $77,747
Median monthly housing costs: $2,063
Compare current foreclosures near Sonoma, CA:
| Photo | Address | Area | Beds / Baths | Price | Details |
|---|---|---|---|---|---|

|
#1
Poplar Ave
Sonoma, CA 95476
|
1,295 sq. feet
|
2 baths 2 beds |
show details | |

|
#2
Melvin Ave
Sonoma, CA 95476
|
1,417 sq. feet
|
2 baths 3 beds |
show details | |

|
#3
Highway 12
Sonoma, CA 95476
|
1,170 sq. feet
|
2 baths 3 beds |
show details | |

|
#4
Comstock Ave
Sonoma, CA 95476
|
1,398 sq. feet
|
2 baths 3 beds |
show details | |

|
#5
Melvin Ave
Sonoma, CA 95476
|
1,417 sq. feet
|
2 baths 3 beds |
show details | |

|
#6
Serpilio Dr
Sonoma, CA 95476
|
1,322 sq. feet
|
2 baths 3 beds |
show details | |

|
#7
Cavedale Rd
Sonoma, CA 95476
|
2,731 sq. feet
|
2 baths 4 beds |
show details | |

|
#8
El Dorado Dr
Sonoma, CA 95476
|
1,216 sq. feet
|
2 baths 3 beds |
show details | |

|
#9
Ernest Dr
Sonoma, CA 95476
|
1,466 sq. feet
|
2 baths 3 beds |
show details | |

|
#10
Ernest Dr
Sonoma, CA 95476
|
1,466 sq. feet
|
2 baths 3 beds |
show details |
| Photo | Address | Area | Beds / Baths | Price | Details |
|---|---|---|---|---|---|

|
#11
W Macarthur St
Sonoma, CA 95476
|
1,968 sq. feet
|
3 baths 3 beds |
show details | |

|
#12
Barcelona Dr
Sonoma, CA 95476
|
2,355 sq. feet
|
3 baths 4 beds |
show details | |

|
#13
Ramon St # 7
Sonoma, CA 95476
|
- sq. feet
|
- baths - beds |
show details | |

|
#14
Beatrice Dr Apt 2
Sonoma, CA 95476
|
- sq. feet
|
- baths - beds |
show details | |

|
#15
Melrose Ct
Sonoma, CA 95476
|
- sq. feet
|
- baths - beds |
show details | |

|
#16
Napa Rd # 1035
Sonoma, CA 95476
|
- sq. feet
|
- baths - beds |
show details | |

|
#17
Vista Dr
Sonoma, CA 95476
|
- sq. feet
|
- baths - beds |
show details | |

|
#18
E Spain St
Sonoma, CA 95476
|
- sq. feet
|
- baths - beds |
show details | |

|
#19
Sonoma Hwy
Sonoma, CA 95476
|
- sq. feet
|
- baths - beds |
show details | |

|
#20
8th St E, Ste 6
Sonoma, CA 95476
|
- sq. feet
|
- baths - beds |
show details |
| Photo | Address | Area | Beds / Baths | Price | Details |
|---|---|---|---|---|---|

|
#21
Hastings Ave
Vallejo, CA 94589
|
1,104 sq. feet
|
2 baths 3 beds |
$529,000
|
show details |

|
#22
Petaluma Blvd S Apt 28
Petaluma, CA 94952
|
565 sq. feet
|
1 baths 1 beds |
$359,900
|
show details |

|
#23
Limestone Dr
Vallejo, CA 94589
|
1,677 sq. feet
|
2 baths 4 beds |
$609,000
|
show details |

|
#24
W Seven Flags Cir
Sonoma, CA 95476
|
- sq. feet
|
- baths - beds |
show details | |

|
#25
Kelliann Place
Rohnert Park, CA 94928
|
2,342 sq. feet
|
3 baths 4 beds |
show details | |

|
#26
Marquette Ave
Vallejo, CA 94589
|
1,536 sq. feet
|
2 baths 4 beds |
show details | |

|
#27
Mark Ave
Vallejo, CA 94589
|
1,457 sq. feet
|
2 baths 4 beds |
show details | |

|
#28
Jewett Rd
Petaluma, CA 94952
|
1,600 sq. feet
|
2 baths 4 beds |
show details | |

|
#29
N Camino Alto Unit 136
Vallejo, CA 94589
|
441 sq. feet
|
1 baths 1 beds |
show details | |

|
#30
Sunny Cove Dr
Novato, CA 94949
|
2,568 sq. feet
|
2 baths 4 beds |
show details |
| Photo | Address | Area | Beds / Baths | Price | Details |
|---|---|---|---|---|---|

|
#31
Taper Ave
Vallejo, CA 94589
|
1,618 sq. feet
|
2 baths 3 beds |
show details | |

|
#32
Berry Ln
Napa, CA 94558
|
840 sq. feet
|
1 baths 3 beds |
show details | |

|
#33
Meadowbrook Ct
Cotati, CA 94931
|
1,733 sq. feet
|
2 baths 2 beds |
show details | |

|
#34
Leonard St
Vallejo, CA 94589
|
1,620 sq. feet
|
2 baths 3 beds |
show details | |

|
#35
Terrace Dr
Napa, CA 94559
|
2,140 sq. feet
|
2 baths 4 beds |
show details | |

|
#36
Wilkins Ave
Napa, CA 94559
|
- sq. feet
|
2 baths 3 beds |
show details | |

|
#37
Daniels Ave
Vallejo, CA 94590
|
1,782 sq. feet
|
2 baths 4 beds |
show details | |

|
#38
Enterprise Rd
Glen Ellen, CA 95442
|
1,220 sq. feet
|
3 baths 3 beds |
show details | |

|
#39
Corby Ave
Santa Rosa, CA 95407
|
836 sq. feet
|
1 baths 2 beds |
show details | |

|
#40
Harris Hill Dr
Novato, CA 94947
|
2,773 sq. feet
|
3 baths 4 beds |
show details |
| Photo | Address | Area | Beds / Baths | Price | Details |
|---|---|---|---|---|---|

|
#41
Bernice Ave
Rohnert Park, CA 94928
|
1,400 sq. feet
|
2 baths 4 beds |
show details | |

|
#42
Downie Dr
Vallejo, CA 94589
|
1,102 sq. feet
|
2 baths 3 beds |
show details | |

|
#43
Falcon Dr
Vallejo, CA 94589
|
1,772 sq. feet
|
2 baths 3 beds |
show details | |

|
#44
Bret Harte Way
Vallejo, CA 94589
|
1,604 sq. feet
|
2 baths 3 beds |
show details | |

|
#45
Falcon Dr
Vallejo, CA 94589
|
1,772 sq. feet
|
2 baths 3 beds |
show details | |

|
#46
Tarton Dr
Santa Rosa, CA 95405
|
2,145 sq. feet
|
3 baths 4 beds |
show details | |

|
#47
Cactus Ave
Santa Rosa, CA 95405
|
1,505 sq. feet
|
2 baths 3 beds |
show details | |

|
#48
Center Rd
Novato, CA 94947
|
1,318 sq. feet
|
2 baths 4 beds |
show details | |

|
#49
Roleen Dr
Vallejo, CA 94589
|
1,680 sq. feet
|
2 baths 3 beds |
show details | |

|
Check over 1 million property listings on Foreclosure.com!
|
browse all offers | |||

Latest news about housing in Sonoma, CA collected exclusively by city-data.com from local newspapers, TV, and radio stations


Median year apartment built: 1986
Household type by relationship:
Households: 10,575- Male householders: 2,065 (531 living alone), Female householders: 3,209 (1,661 living alone)
2,251 spouses (2,140 opposite-sex spouses), 327 unmarried partners, (327 opposite-sex unmarried partners), 1,836 children (1,596 natural, 176 adopted, 63 stepchildren), 152 grandchildren, 66 brothers or sisters, 199 parents, 59 foster children, 18 other relatives, 125 non-relatives
- In group quarters: 263
Size of family households: 1,634 2-persons, 818 3-persons, 317 4-persons, 20 5-persons, 50 6-persons.
Size of nonfamily households: 2,413 1-person, 355 2-persons, 20 3-persons.
830 married couples with children.
401 single-parent households (166 men, 235 women).
84.6% of residents of Sonoma speak English at home.
12.2% of residents speak Spanish at home (76% speak English very well, 17% speak English well, 6% speak English not well).
3.6% of residents speak other Indo-European language at home (77% speak English very well, 21% speak English well, 2% speak English not well).
0.5% of residents speak Asian or Pacific Island language at home (22% speak English very well, 63% speak English well, 16% speak English not well).
0.4% of residents speak other language at home (100% speak English very well).
Foreign born population: 1,248 (11.8%)
(64.2% of them are naturalized citizens)
| Here: | 5.5 |
| State: | 6.0 |
| Here: | 4.0 |
| State: | 3.9 |
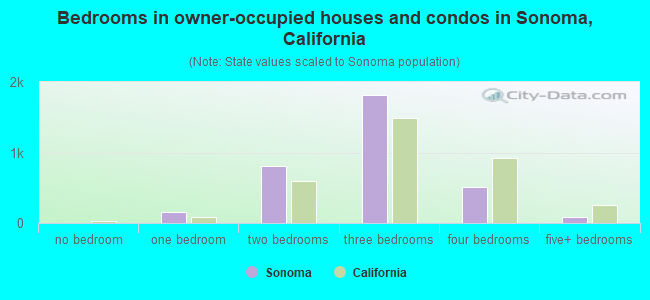
- Bedrooms in owner-occupied houses and condos in Sonoma, California
- 0no bedroom
- 1571 bedroom
- 8082 bedrooms
- 1,8113 bedrooms
- 5114 bedrooms
- 825+ bedrooms
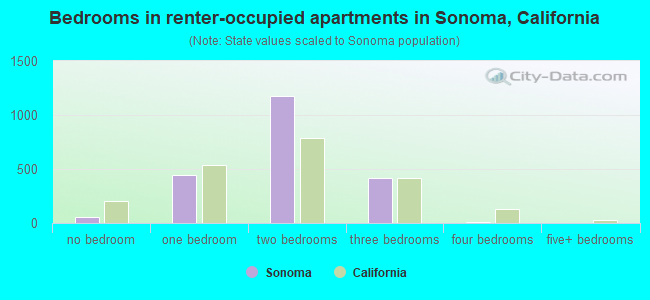
- Bedrooms in renter-occupied apartments in Sonoma, California
- 60no bedroom
- 4431 bedroom
- 1,1782 bedrooms
- 4213 bedrooms
- 94 bedrooms
- 05+ bedrooms
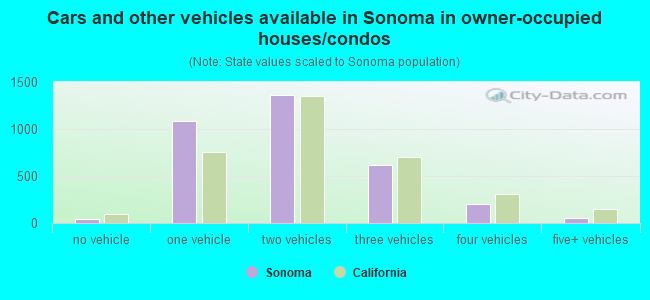
- Cars and other vehicles available in Sonoma in owner-occupied houses/condos
- 47no vehicle
- 1,0891 vehicle
- 1,3632 vehicles
- 6143 vehicles
- 2044 vehicles
- 515+ vehicles
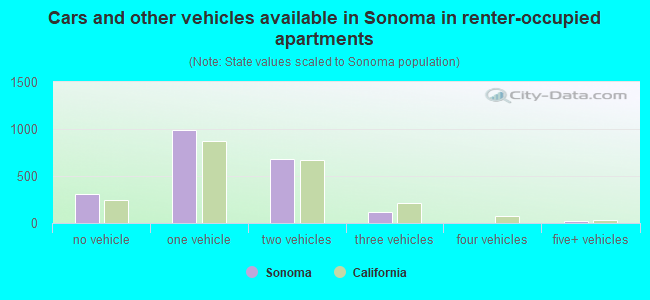
- Cars and other vehicles available in Sonoma in renter-occupied apartments
- 308no vehicle
- 9911 vehicle
- 6772 vehicles
- 1153 vehicles
- 04 vehicles
- 215+ vehicles
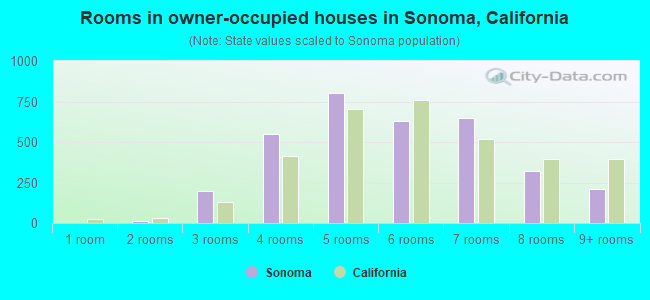
- Rooms in owner-occupied houses in Sonoma, California
- 01 room
- 142 rooms
- 1953 rooms
- 5504 rooms
- 8045 rooms
- 6326 rooms
- 6477 rooms
- 3188 rooms
- 2089+ rooms
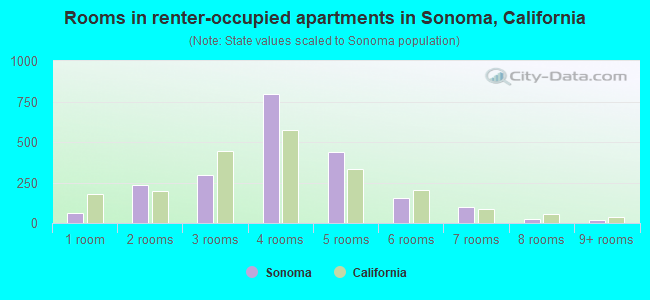
- Rooms in renter-occupied apartments in Sonoma, California
- 601 room
- 2342 rooms
- 2943 rooms
- 7964 rooms
- 4375 rooms
- 1566 rooms
- 977 rooms
- 228 rooms
- 169+ rooms
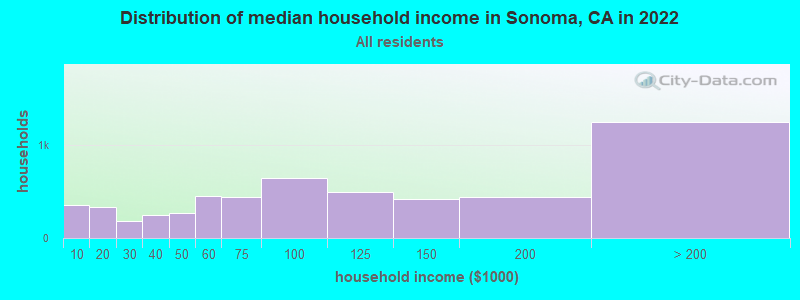
Sonoma, CA household income distribution

- 350Less than $10,000
- 332$10,000 to $19,999
- 178$20,000 to $29,999
- 251$30,000 to $39,999
- 268$40,000 to $49,999
- 451$50,000 to $59,999
- 445$60,000 to $74,999
- 646$75,000 to $99,999
- 491$100,000 to $124,999
- 413$125,000 to $149,999
- 436$150,000 to $199,999
- 1,244$200,000 or more
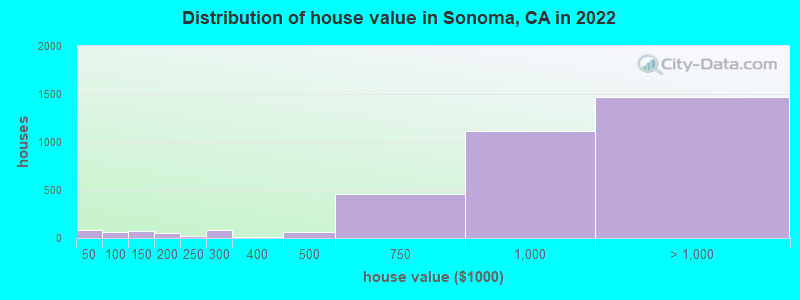
Home value of owner - occupied houses in 2022 in Sonoma, CA
-
- 69Less than $10,000
- 11$30,000 to $34,999
- 25$50,000 to $59,999
- 40$60,000 to $69,999
- 40$100,000 to $124,999
- 32$125,000 to $149,999
- 42$150,000 to $174,999
- 13$175,000 to $199,999
- 24$200,000 to $249,999
- 81$250,000 to $299,999
- 11$300,000 to $399,999
- 59$400,000 to $499,999
- 461$500,000 to $749,999
- 1,112$750,000 to $999,999
- 787$1,000,000 to $1,499,999
- 368$1,500,000 to $1,999,999
- 308$2,000,000 or more
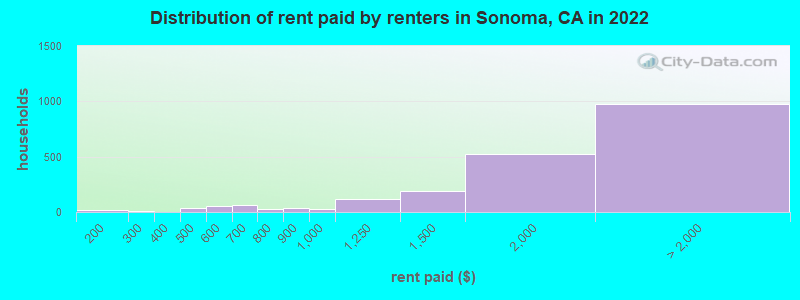
Rent paid by renters in 2022 in Sonoma, CA
-
- 15$100 to $149
- 11$250 to $299
- 33$400 to $449
- 54$550 to $599
- 16$600 to $649
- 43$650 to $699
- 26$750 to $799
- 33$800 to $899
- 25$900 to $999
- 115$1,000 to $1,249
- 190$1,250 to $1,499
- 521$1,500 to $1,999
- 409$2,000 to $2,499
- 253$2,500 to $2,999
- 205$3,000 to $3,499
- 89$3,500 or more
- 19No cash rent
Percentage of workers working in this county: 79.8%
Number of people working at home: 1,192 (24.6% of all workers)
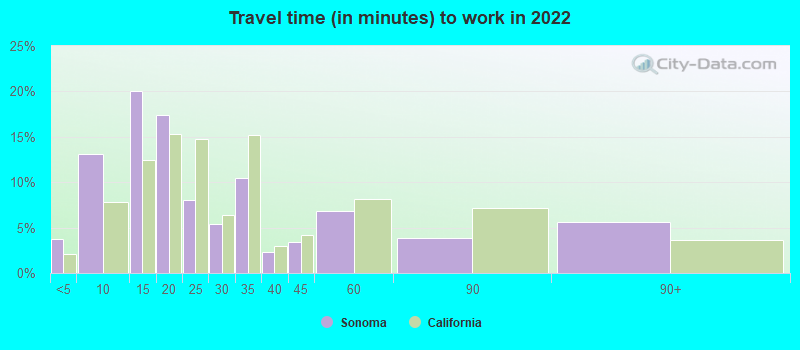
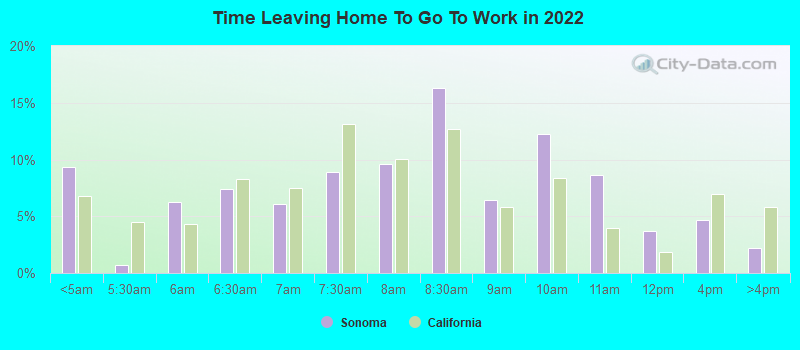
Travel time to work (commute)
- Less than 5 minutes: 217
- 5 to 9 minutes: 856
- 10 to 14 minutes: 369
- 15 to 19 minutes: 388
- 20 to 24 minutes: 296
- 25 to 29 minutes: 194
- 30 to 34 minutes: 450
- 35 to 39 minutes: 84
- 40 to 44 minutes: 142
- 45 to 59 minutes: 204
- 60 to 89 minutes: 296
- 90 or more minutes: 170
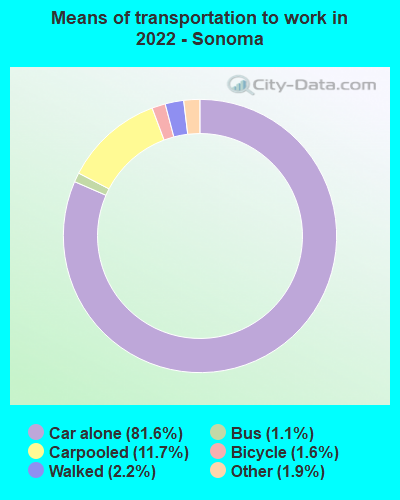
Means of transportation to work:
- Drove a car alone: 5,954 (71.1%)
- Carpooled: 709 (8.5%)
- Bus: 60 (0.7%)
- Taxi: 114 (1.4%)
- Bicycle: 134 (1.6%)
- Walked: 183 (2.2%)
- Worked at home: 1,192 (14.2%)
- Unemployment by race in 2022
- Unemployment rate for White non-Hispanic residents
- 5.8%Males
- 2.8%Females
- Unemployment rate for other race residents
- 3.2%Males
- Unemployment rate for two or more race residents
- 9.1%Females
- Unemployment rate for Hispanic or Latino residents
- 3.1%Males
- 9.3%Females
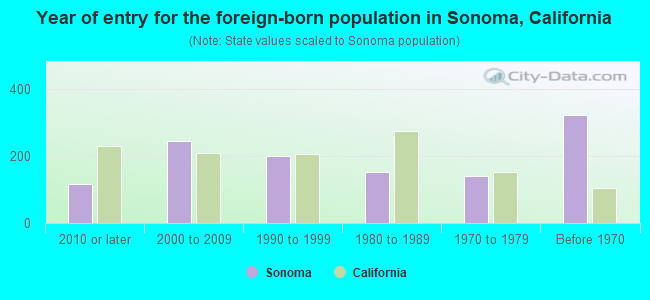
- Year of entry for the foreign-born population in Sonoma, California
- 1172010 or later
- 2462000 to 2009
- 2001990 to 1999
- 1531980 to 1989
- 1411970 to 1979
- 323Before 1970
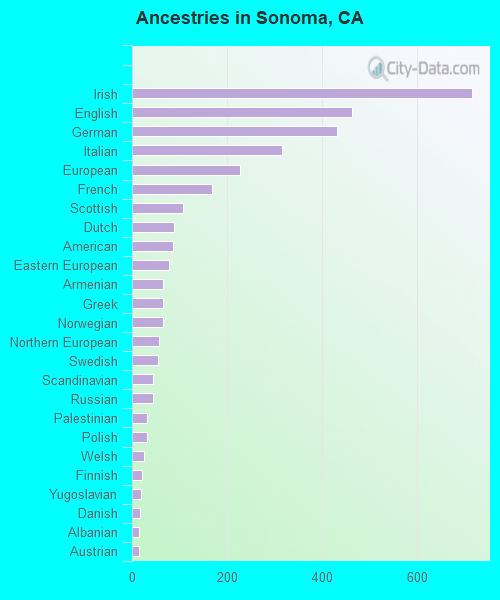
First ancestries reported:
- Irish: 717 (16.6%)
- English: 463 (10.7%)
- German: 432 (10.0%)
- Italian: 316 (7.3%)
- European: 228 (5.3%)
- French: 168 (3.9%)
- Scottish: 108 (2.5%)
- Dutch: 88 (2.0%)
- American: 86 (2.0%)
- Eastern European: 77 (1.8%)
- Armenian: 66 (1.5%)
- Greek: 66 (1.5%)
- Norwegian: 66 (1.5%)
- Northern European: 56 (1.3%)
- Swedish: 54 (1.2%)
- Scandinavian: 45 (1.0%)
- Russian: 44 (1.0%)
- Palestinian: 32 (0.7%)
- Polish: 31 (0.7%)
- Welsh: 25 (0.6%)
- Finnish: 22 (0.5%)
- Yugoslavian: 20 (0.5%)
- Danish: 17 (0.4%)
- Albanian: 15 (0.3%)
- Austrian: 14 (0.3%)
- Belgian: 11 (0.3%)
- Slovak: 11 (0.3%)
- Hungarian: 9 (0.2%)
- French Canadian: 8 (0.2%)
- Jordanian: 7 (0.2%)
- British: 7 (0.2%)
- Portuguese: 3 (0.07%)
Most common places of birth for foreign-born residents (%):
| Sonoma: | 26.6% (333) |
| California: | 37.2% (3,881,193) |
| Sonoma: | 6.1% (77) |
| California: | 1.2% (127,477) |
| Sonoma: | 6.1% (77) |
| California: | 0.2% (16,042) |
| Sonoma: | 5.9% (74) |
| California: | 0.2% (16,541) |
| Sonoma: | 5.7% (72) |
| California: | 0.6% (58,161) |
| Sonoma: | 4.2% (52) |
| California: | 0.4% (40,224) |
| Sonoma: | 4.1% (51) |
| California: | 0.6% (60,582) |
| Sonoma: | 3.8% (47) |
| California: | 0.3% (31,439) |
| Sonoma: | 3.6% (45) |
| California: | 5.2% (539,184) |
| Sonoma: | 3.0% (37) |
| California: | 0.3% (33,960) |
| Sonoma: | 2.6% (33) |
| California: | 0.1% (12,623) |
| Sonoma: | 2.2% (28) |
| California: | 0.1% (8,444) |
| Sonoma: | 1.9% (24) |
| California: | 4.2% (440,287) |
| Sonoma: | 1.8% (23) |
| California: | 0.5% (51,974) |
| Sonoma: | 1.8% (23) |
| California: | 6.6% (684,672) |
| Sonoma: | 1.8% (22) |
| California: | 0.1% (11,122) |
Place of birth for U.S.-born residents:
- This state: 6,394
- Other state: 2,951
- Northeast: 761
- Midwest: 1,055
- South: 606
- West: 499
86.7% of Sonoma residents lived in the same house 1 years ago.
Out of people who lived in different houses, 29.0% lived in this county.
Out of people who lived in different counties, 77.5% lived in California.
| Sonoma: | 86.7% |
| State average: | 88.9% |
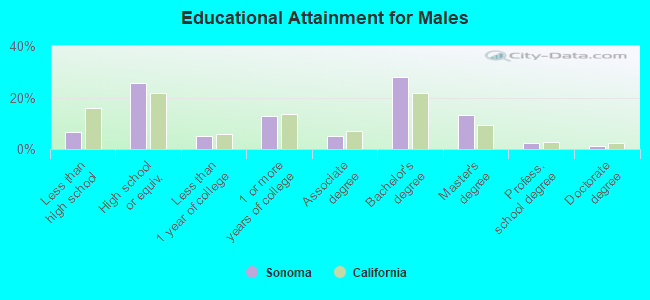
Education attainment for males 25 years and older:
- No schooling: 32
- Nursery to 4th grade: 22
- 5th and 6th grade: 40
- 7th and 8th grade: 0
- 9th grade: 0
- 10th grade: 13
- 11th grade: 12
- 12th grade, no diploma: 127
- High school graduate (or equivalency): 933
- Less than 1 year of college: 192
- Some college more than 1 year, no degree: 474
- Associate degree: 181
- Bachelor's degree: 1,023
- Master's degree: 477
- Professional school degree: 87
- Doctorate degree: 48
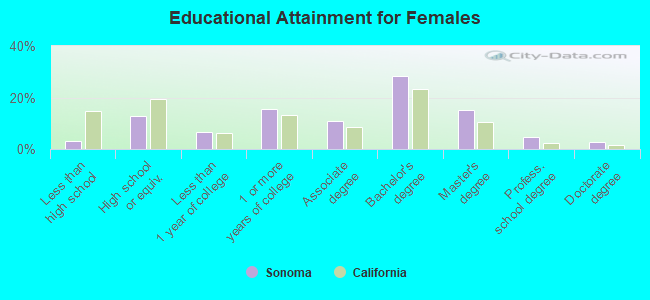
Education attainment for females 25 years and older:
- No schooling: 15
- Nursery to 4th grade: 0
- 5th and 6th grade: 54
- 7th and 8th grade: 0
- 9th grade: 0
- 10th grade: 14
- 11th grade: 23
- 12th grade, no diploma: 60
- High school graduate (or equivalency): 652
- Less than 1 year of college: 333
- Some college more than 1 year, no degree: 795
- Associate degree: 556
- Bachelor's degree: 1,442
- Master's degree: 767
- Professional school degree: 238
- Doctorate degree: 129
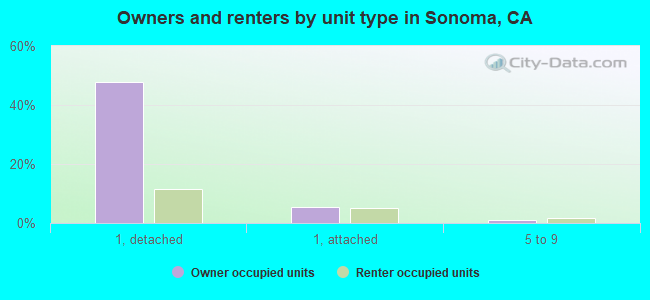
Housing units in structures:
- One, detached: 3,472
- One, attached: 590
- Two: 263
- 3 or 4: 389
- 5 to 9: 196
- 10 to 19: 214
- 20 to 49: 183
- 50 or more: 268
- Mobile homes: 305
Median worth of mobile homes: $163,362
Housing units lacking complete kitchen facilities in 2022: 3.5%
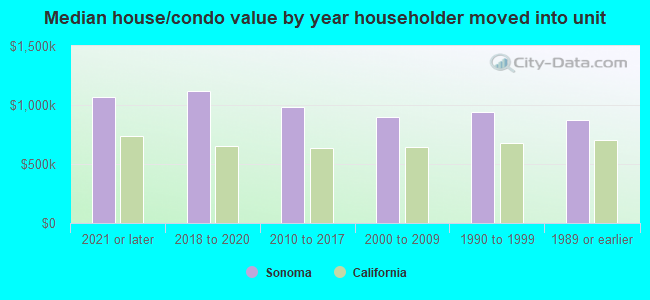
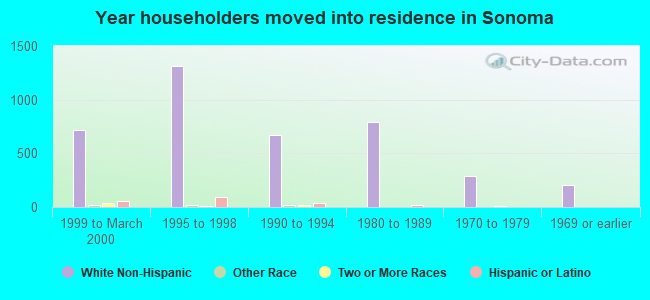
House/condo owner moved in on average 11 years ago
Renter moved in on average 5 years ago
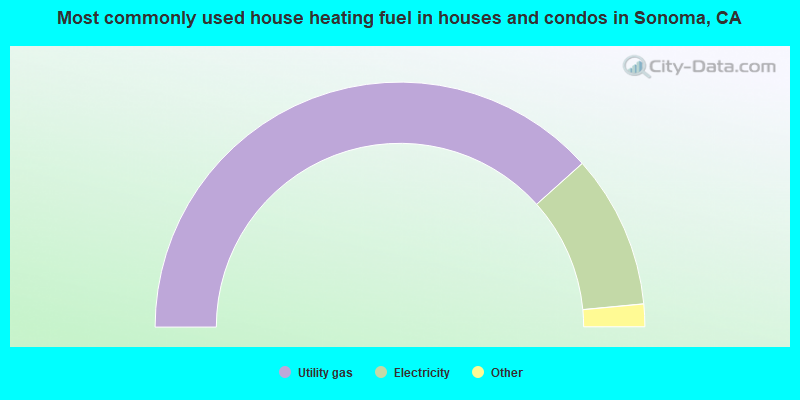
- 76.8%Utility gas
- 20.3%Electricity
- 1.6%Bottled, tank, or LP gas
- 0.8%Solar energy
- 0.6%Wood
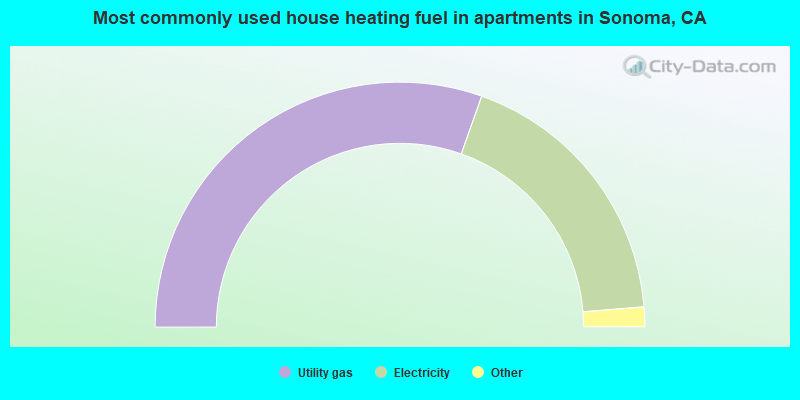
- 60.9%Utility gas
- 36.6%Electricity
- 1.4%Bottled, tank, or LP gas
- 1.1%Solar energy
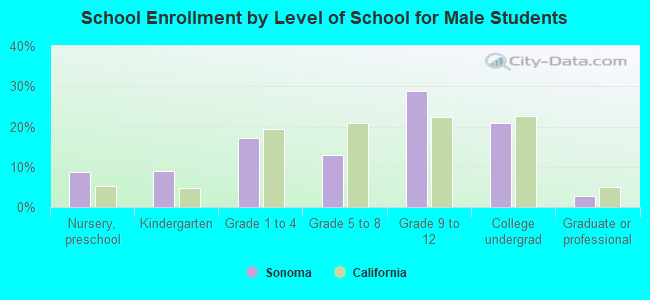
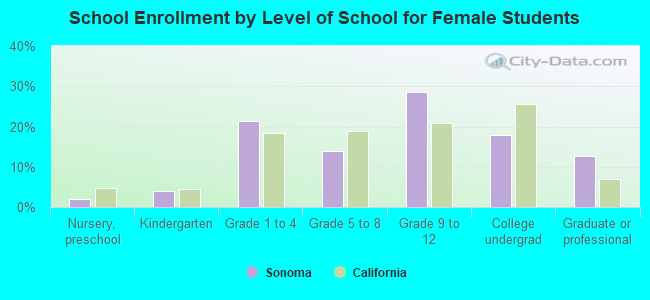
Private vs. public school enrollment:
| Here: | 9.1% |
| California: | 10.5% |
| Here: | 5.2% |
| California: | 8.5% |
| Here: | 39.0% |
| California: | 15.9% |