Talpa, TX (Texas) Houses and Residents
| Talpa: | $152,646 |
| Texas: | $275,400 |
Total population: 678 (Urban population: 0, Rural population: 764 (129 farm, 635 nonfarm))
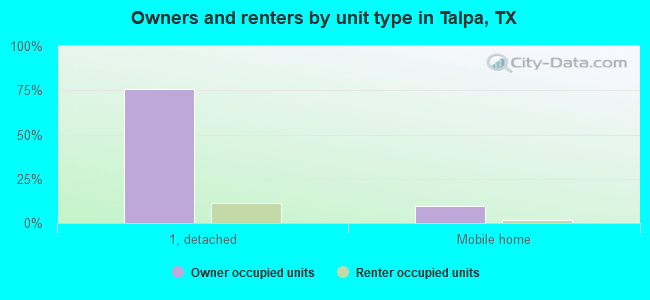
Houses: 613 (315 occupied: 271 owner occupied, 44 renter occupied)
| % of renters here: | 14% |
| State: | 38% |
Housing density: 2 houses/condos per square mile
Median price asked for vacant for-sale houses and condos in 2022 in this county: $143,124.
Median contract rent in 2022: $522 (lower quartile is $426, upper quartile is $568)
Median rent asked for vacant for-rent units in 2022: $572
Median gross rent in Talpa, TX in 2022: $682
Housing units in Talpa with a mortgage: 42 (0 second mortgage, 2 home equity loan, 0 both second mortgage and home equity loan)
Houses without a mortgage: 76


Household type by relationship:
Households: 8,855- In family households: 7,344 (1,815 male householders, 703 female householders)
1,922 spouses, 2,156 children (1,894 natural, 69 adopted, 193 stepchildren), 276 grandchildren, 56 brothers or sisters, 55 parents, foster children, 115 other relatives, 186 non-relatives
- In nonfamily households: 1,511 (675 male householders (597 living alone)), 664 female householders (597 living alone)), 172 nonrelatives
- In group quarters: 40 (37 institutionalized population)
1,470 married couples with children.
477 single-parent households (120 men, 357 women).
91.0% of residents of Talpa speak English at home.
8.5% of residents speak Spanish at home (61% speak English very well, 19% speak English well, 18% speak English not well, 2% don't speak English at all).
0.4% of residents speak Asian or Pacific Island language at home (67% speak English very well, 33% speak English well).
Foreign born population: 79 (7.6%)
(55.7% of them are naturalized citizens)
| Here: | 6.0 |
| State: | 6.3 |
| Here: | 6.0 |
| State: | 4.0 |
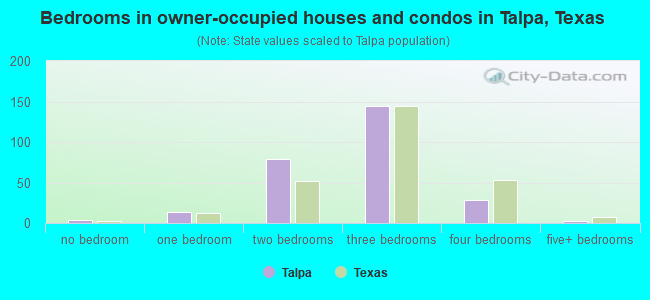
- Bedrooms in owner-occupied houses and condos in Talpa, Texas
- 4no bedroom
- 131 bedroom
- 792 bedrooms
- 1443 bedrooms
- 284 bedrooms
- 35+ bedrooms
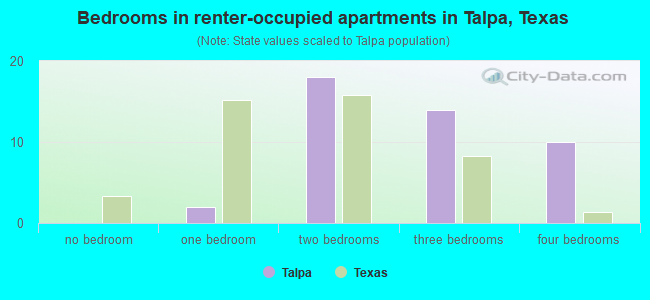
- Bedrooms in renter-occupied apartments in Talpa, Texas
- 0no bedroom
- 21 bedroom
- 182 bedrooms
- 143 bedrooms
- 104 bedrooms
- 05+ bedrooms
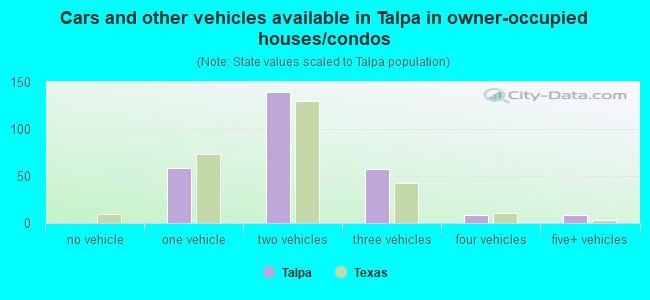
- Cars and other vehicles available in Talpa in owner-occupied houses/condos
- 0no vehicle
- 581 vehicle
- 1392 vehicles
- 573 vehicles
- 84 vehicles
- 95+ vehicles
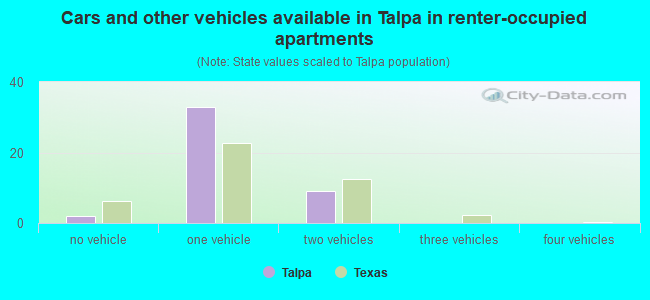
- Cars and other vehicles available in Talpa in renter-occupied apartments
- 2no vehicle
- 331 vehicle
- 92 vehicles
- 03 vehicles
- 04 vehicles
- 05+ vehicles
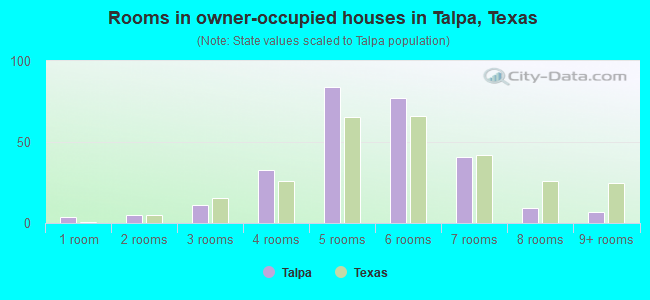
- Rooms in owner-occupied houses in Talpa, Texas
- 41 room
- 52 rooms
- 113 rooms
- 334 rooms
- 845 rooms
- 776 rooms
- 417 rooms
- 98 rooms
- 79+ rooms
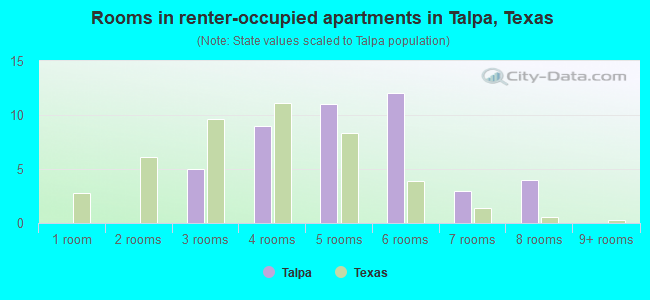
- Rooms in renter-occupied apartments in Talpa, Texas
- 01 room
- 02 rooms
- 53 rooms
- 94 rooms
- 115 rooms
- 126 rooms
- 37 rooms
- 48 rooms
- 09+ rooms
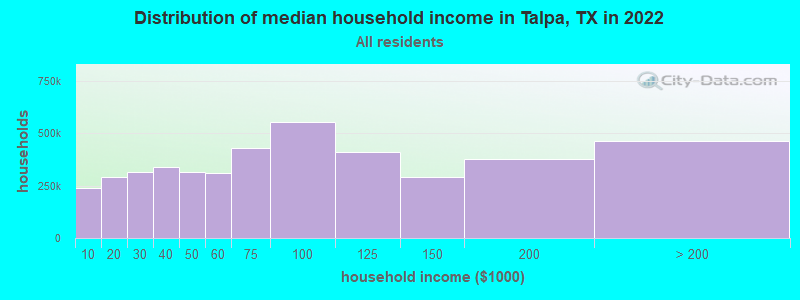
Talpa, TX household income distribution

- 70,140Less than $10,000
- 95,355$10,000 to $19,999
- 103,736$20,000 to $29,999
- 109,261$30,000 to $39,999
- 103,083$40,000 to $49,999
- 98,932$50,000 to $59,999
- 136,952$60,000 to $74,999
- 187,519$75,000 to $99,999
- 142,150$100,000 to $124,999
- 104,799$125,000 to $149,999
- 121,870$150,000 to $199,999
- 136,986$200,000 or more
Percentage of workers working in this county: 75.4%
Number of people working at home: 54 (11.1% of all workers)
Travel time to work (commute)
- Less than 5 minutes: 29
- 5 to 9 minutes: 31
- 10 to 14 minutes: 30
- 15 to 19 minutes: 58
- 20 to 24 minutes: 39
- 25 to 29 minutes: 19
- 30 to 34 minutes: 44
- 35 to 39 minutes: 2
- 40 to 44 minutes: 4
- 45 to 59 minutes: 42
- 60 to 89 minutes: 13
- 90 or more minutes: 26
Means of transportation to work:
- Drove a car alone: 250 (70.0%)
- Carpooled: 63 (17.6%)
- Bus or trolley bus: 4 (1.1%)
- Bicycle: 3 (0.8%)
- Walked: 13 (3.6%)
- Other means: 4 (1.1%)
- Worked at home: 20 (5.6%)
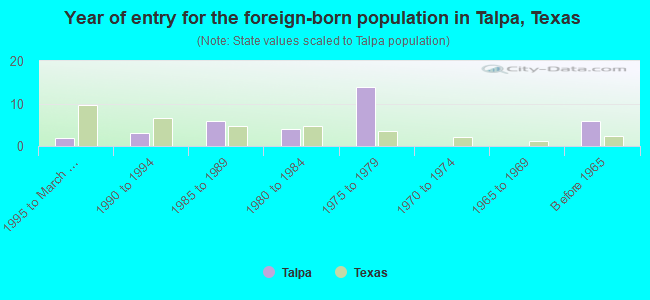
- Year of entry for the foreign-born population in Talpa, Texas
- 21995 to March 2000
- 31990 to 1994
- 61985 to 1989
- 41980 to 1984
- 141975 to 1979
- 01970 to 1974
- 01965 to 1969
- 6Before 1965
Most common places of birth for foreign-born residents (%):
| Talpa: | 82.9% (29) |
| Texas: | 64.8% (1,879,369) |
| Talpa: | 11.4% (4) |
| Texas: | 1.6% (45,907) |
| Talpa: | 5.7% (2) |
| Texas: | 1.2% (36,176) |
Place of birth for U.S.-born residents:
- This state: 663
- Other state: 66
- Northeast: 3
- Midwest: 20
- South: 21
- West: 22
60% of Talpa residents lived in the same house 5 years ago.
Out of people who lived in different houses, 60% lived in this county.
Out of people who lived in different counties, 86% lived in Texas.
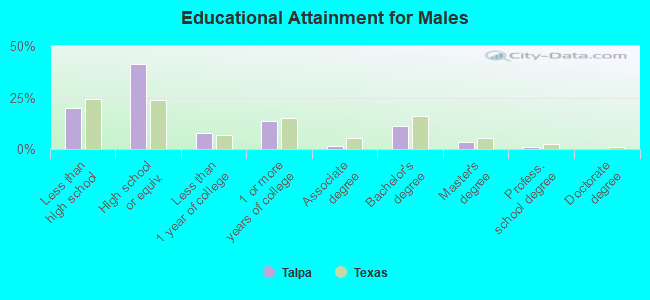
Education attainment for males 25 years and older:
- No schooling: 0
- Nursery to 4th grade: 7
- 5th and 6th grade: 4
- 7th and 8th grade: 7
- 9th grade: 2
- 10th grade: 19
- 11th grade: 13
- 12th grade, no diploma: 4
- High school graduate (or equivalency): 115
- Less than 1 year of college: 21
- Some college more than 1 year, no degree: 38
- Associate degree: 4
- Bachelor's degree: 31
- Master's degree: 10
- Professional school degree: 3
- Doctorate degree: 0
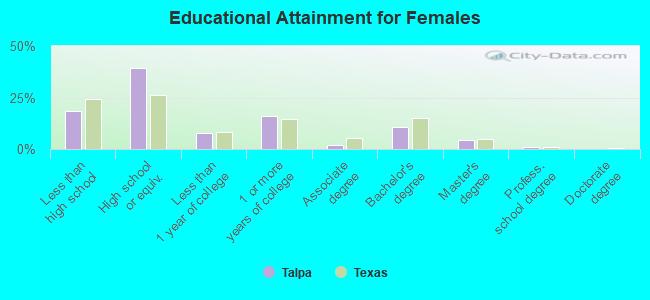
Education attainment for females 25 years and older:
- No schooling: 2
- Nursery to 4th grade: 4
- 5th and 6th grade: 5
- 7th and 8th grade: 8
- 9th grade: 9
- 10th grade: 16
- 11th grade: 4
- 12th grade, no diploma: 5
- High school graduate (or equivalency): 112
- Less than 1 year of college: 22
- Some college more than 1 year, no degree: 46
- Associate degree: 6
- Bachelor's degree: 31
- Master's degree: 13
- Professional school degree: 3
- Doctorate degree: 0


Housing units in structures:
- One, detached: 393
- One, attached: 2
- Two: 3
- 3 or 4: 2
- Mobile homes: 166
- Boats, RVs, vans, etc.: 47
Median worth of mobile homes: $92,191
Housing units lacking complete kitchen facilities: 2.4%
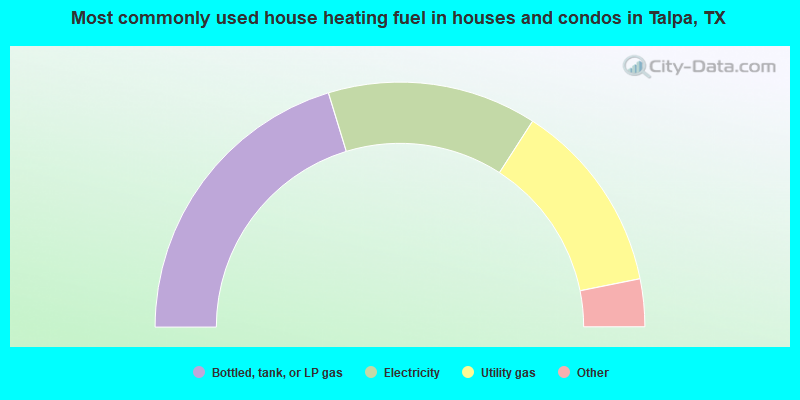
- 40.6%Bottled, tank, or LP gas
- 27.7%Electricity
- 25.5%Utility gas
- 3.3%Wood
- 3.0%Other fuel
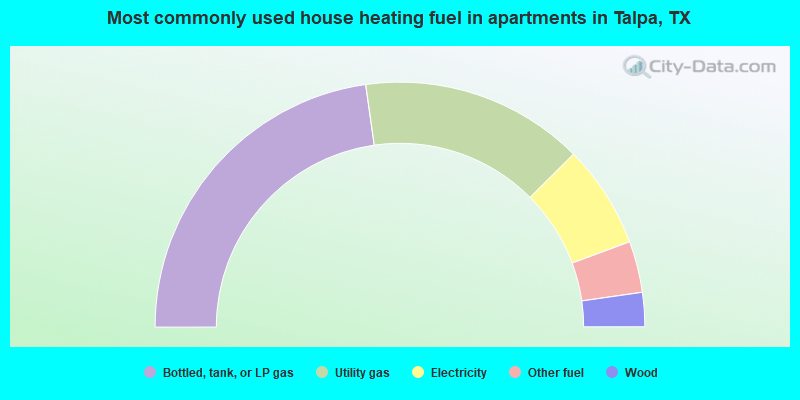
- 45.5%Bottled, tank, or LP gas
- 29.5%Utility gas
- 13.6%Electricity
- 6.8%Other fuel
- 4.5%Wood
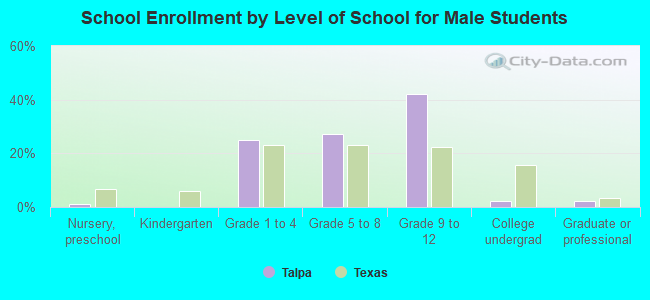
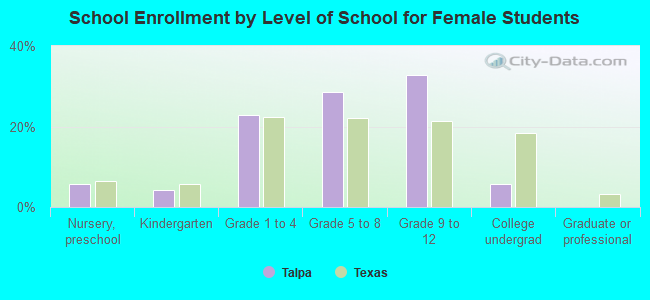
Private vs. public school enrollment:
| Here: | 1.2% |
| Texas: | 6.8% |
| Here: | 3.3% |
| Texas: | 6.2% |
| Here: | 33.3% |
| Texas: | 15.4% |