Housing density: 1,575 houses/condos per square mile
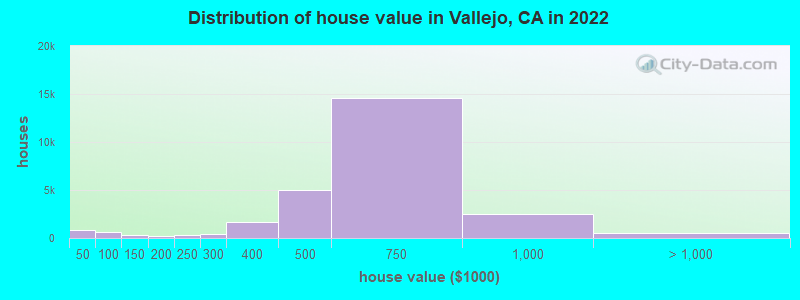
Median price asked for vacant for-sale houses and condos in 2022: $495,599.
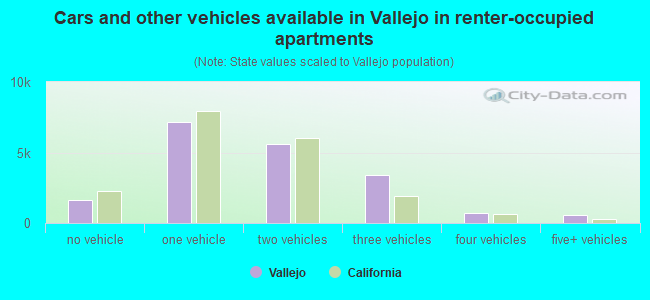
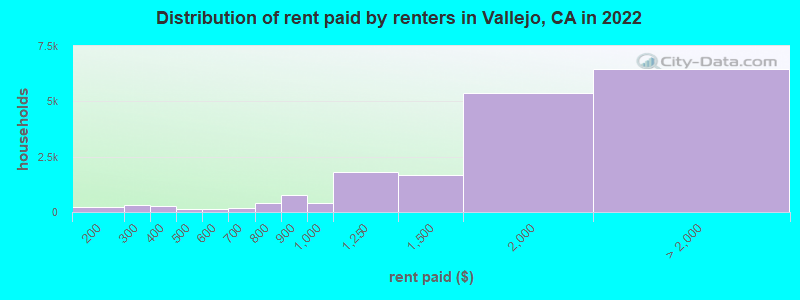
Median contract rent in 2022: $1,780 (lower quartile is $1,370, upper quartile is over $2,000)
Median rent asked for vacant for-rent units in 2022: $2,269
Median gross rent in Vallejo, CA in 2022: $1,993
Housing units in Vallejo with a mortgage: 20,653 (2,217 second mortgage, 0 home equity loan, 1,953 both second mortgage and home equity loan) Houses without a mortgage: 318
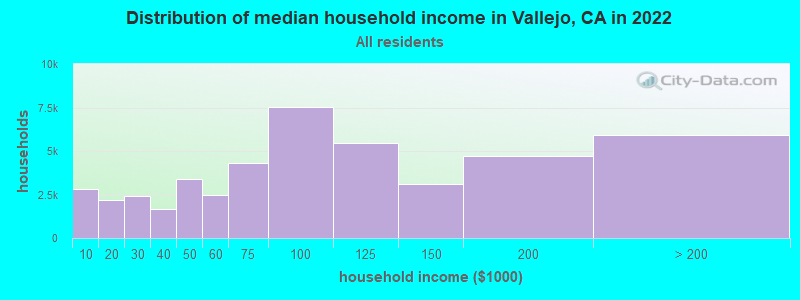
Median household income for houses/condos with a mortgage: $115,576
Median household income for apartments without a mortgage: $75,477
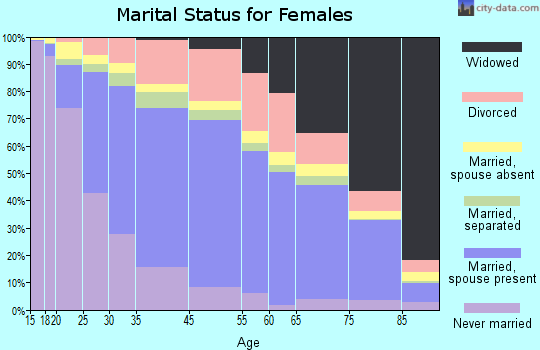
9,060 married couples with children.
8,173 single-parent households (1,787 men, 6,386 women).
57.8% of residents of Vallejo speak English at home.
20.2% of residents speak Spanish at home (50% speak English very well, 28% speak English well, 15% speak English not well, 6% don't speak English at all).
2.6% of residents speak other Indo-European language at home (57% speak English very well, 22% speak English well, 18% speak English not well, 2% don't speak English at all).
18.4% of residents speak Asian or Pacific Island language at home (56% speak English very well, 35% speak English well, 9% speak English not well, 1% don't speak English at all).
1.0% of residents speak other language at home (76% speak English very well, 9% speak English well, 15% speak English not well).
Foreign born population: 38,965 (31.5%)
(58.1% of them are naturalized citizens)
Percentage of workers working in this county: 48.8% Number of people working at home: 8,199 (14.2% of all workers)
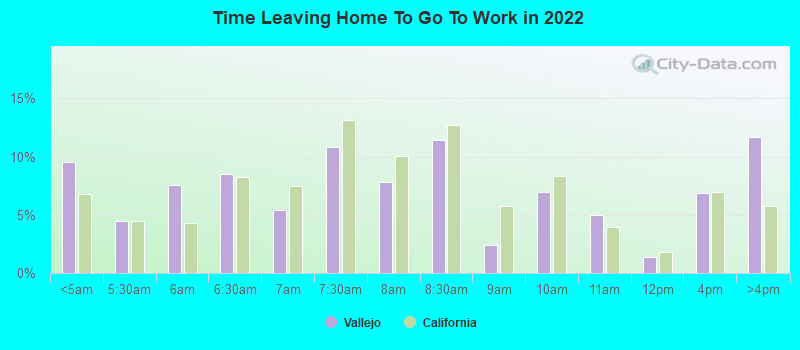
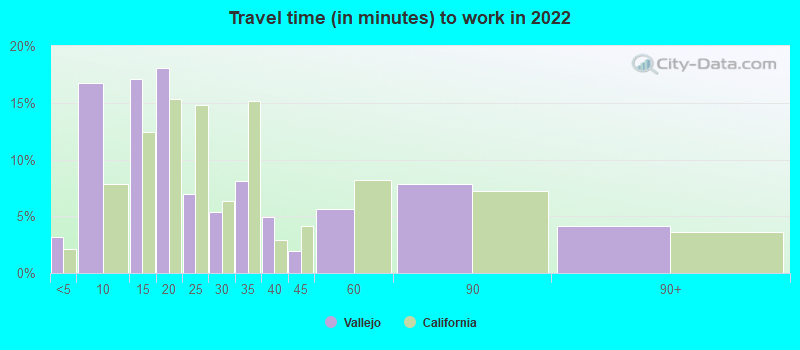
Travel time to work (commute)
Less than 5 minutes: 1,479
5 to 9 minutes: 4,527
10 to 14 minutes: 4,905
15 to 19 minutes: 4,789
20 to 24 minutes: 4,131
25 to 29 minutes: 2,688
30 to 34 minutes: 7,137
35 to 39 minutes: 1,813
40 to 44 minutes: 2,882
45 to 59 minutes: 5,257
60 to 89 minutes: 5,709
90 or more minutes: 4,311
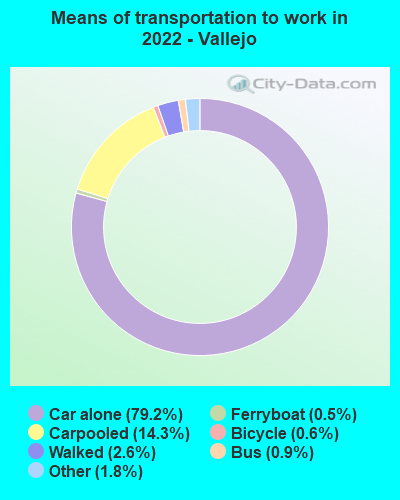
Means of transportation to work:
Drove a car alone: 20,730 (63.7%)
Carpooled: 4,458 (13.7%)
Bus: 196 (0.6%)
Subway or elevated rail: 14 (0.0%)
Long-distance train or commuter rail: 13 (0.0%)
Light rail, streetcar or trolley: 29 (0.1%)
Ferryboat: 155 (0.5%)
Taxi: 441 (1.4%)
Bicycle: 162 (0.5%)
Walked: 595 (1.8%)
Worked at home: 6,202 (19.1%)
Unemployment by race in 2022
Unemployment rate for White non-Hispanic residents
4.1%Males
9.1%Females
Unemployment rate for Black residents
6.4%Males
4.8%Females
Unemployment rate for American Indian and Alaska Native residents
12.1%Males
26.6%Females
Unemployment rate for Asian residents
4.7%Males
4.6%Females
Unemployment rate for other race residents
12.0%Males
9.2%Females
Unemployment rate for two or more race residents
3.4%Males
1.1%Females
Unemployment rate for Hispanic or Latino residents
10.3%Males
7.4%Females
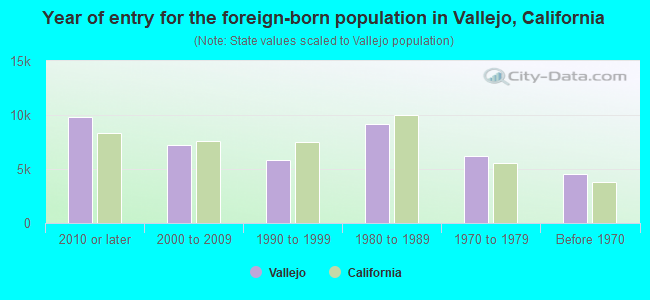
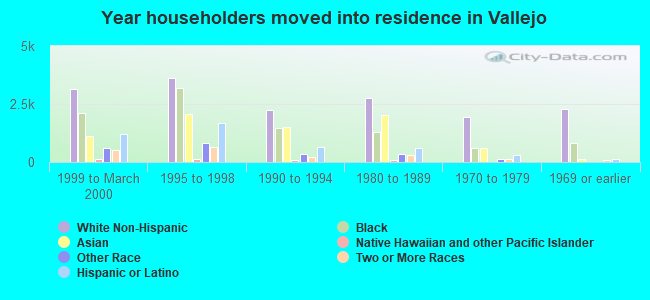
Year of entry for the foreign-born population in Vallejo, California
9,8032010 or later
7,1942000 to 2009
5,8631990 to 1999
9,1851980 to 1989
6,2471970 to 1979
4,497Before 1970
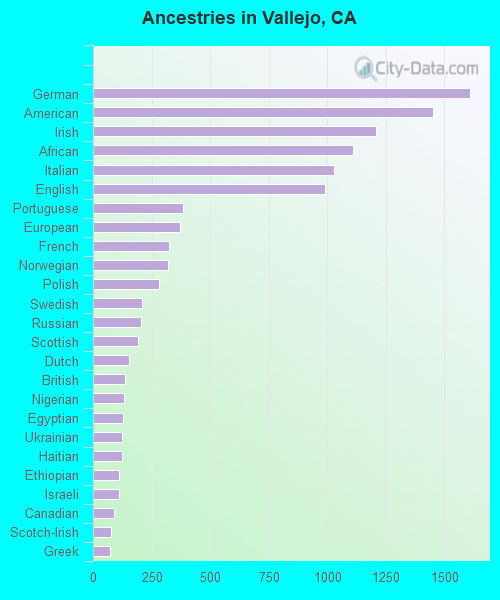
First ancestries reported:
German: 1,610 (2.2%)
American: 1,453 (2.0%)
Irish: 1,207 (1.6%)
African: 1,112 (1.5%)
Italian: 1,027 (1.4%)
English: 989 (1.3%)
Portuguese: 383 (0.5%)
European: 372 (0.5%)
French: 323 (0.4%)
Norwegian: 322 (0.4%)
Polish: 280 (0.4%)
Swedish: 210 (0.3%)
Russian: 206 (0.3%)
Scottish: 190 (0.3%)
Dutch: 155 (0.2%)
British: 135 (0.2%)
Nigerian: 134 (0.2%)
Egyptian: 129 (0.2%)
Ukrainian: 125 (0.2%)
Haitian: 123 (0.2%)
Ethiopian: 113 (0.2%)
Israeli: 113 (0.2%)
Canadian: 90 (0.1%)
Scotch-Irish: 78 (0.1%)
Greek: 73 (0.10%)
Brazilian: 64 (0.09%)
Welsh: 60 (0.08%)
Bulgarian: 56 (0.08%)
Eastern European: 55 (0.07%)
Danish: 55 (0.07%)
Arab: 53 (0.07%)
French Canadian: 45 (0.06%)
Turkish: 45 (0.06%)
Austrian: 44 (0.06%)
Scandinavian: 43 (0.06%)
Jamaican: 41 (0.06%)
Jordanian: 37 (0.05%)
Armenian: 32 (0.04%)
Hungarian: 27 (0.04%)
Iranian: 27 (0.04%)
Basque: 26 (0.04%)
Lebanese: 24 (0.03%)
Northern European: 23 (0.03%)
Slovak: 23 (0.03%)
Kenyan: 20 (0.03%)
Finnish: 19 (0.03%)
Swiss: 16 (0.02%)
Cape Verdean: 14 (0.02%)
Icelander: 13 (0.02%)
Somali: 11 (0.01%)
Maltese: 11 (0.01%)
Belgian: 10 (0.01%)
Serbian: 10 (0.01%)
Romanian: 9 (0.01%)
Lithuanian: 9 (0.01%)
Iraqi: 7 (0.01%)
Croatian: 6 (0.01%)
Most common places of birth for foreign-born residents (%):
Philippines
Vallejo:
42.7% (14,144)
California:
7.8% (818,297)
Mexico
Vallejo:
23.2% (7,693)
California:
37.2% (3,881,193)
El Salvador
Vallejo:
6.5% (2,139)
California:
4.2% (440,287)
Guatemala
Vallejo:
2.6% (853)
California:
2.8% (290,436)
Vietnam
Vallejo:
2.4% (794)
California:
4.9% (512,335)
Nicaragua
Vallejo:
2.2% (717)
California:
0.6% (58,161)
India
Vallejo:
2.1% (711)
California:
5.2% (539,184)
China, excluding Hong Kong and Taiwan
Vallejo:
2.1% (686)
California:
6.6% (684,672)
Place of birth for U.S.-born residents:
This state: 65,984
Other state: 16,096
Northeast: 3,342
Midwest: 4,366
South: 5,088
West: 3,300
90.5% of Vallejo residents lived in the same house 1 years ago. Out of people who lived in different houses, 36.0% lived in this county. Out of people who lived in different counties, 92.3% lived in California.
Vallejo:
90.5%
State average:
88.9%
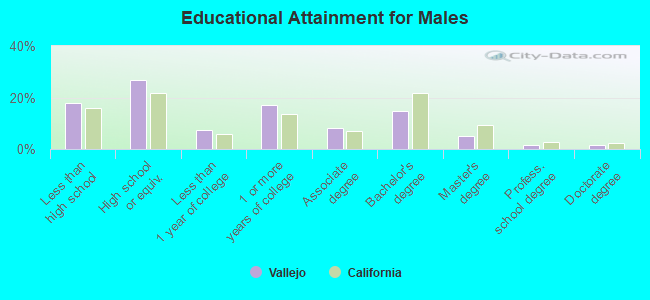
Education attainment for males 25 years and older:
No schooling: 1,717
Nursery to 4th grade: 168
5th and 6th grade: 1,316
7th and 8th grade: 0
9th grade: 393
10th grade: 1,420
11th grade: 652
12th grade, no diploma: 2,037
High school graduate (or equivalency): 11,685
Less than 1 year of college: 3,289
Some college more than 1 year, no degree: 7,428
Associate degree: 3,576
Bachelor's degree: 6,468
Master's degree: 2,168
Professional school degree: 609
Doctorate degree: 611
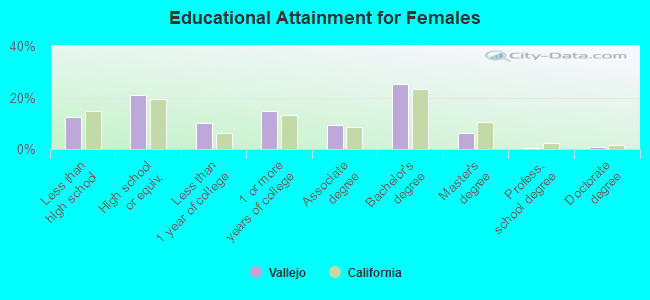
Education attainment for females 25 years and older:
No schooling: 1,777
Nursery to 4th grade: 151
5th and 6th grade: 287
7th and 8th grade: 217
9th grade: 493
10th grade: 898
11th grade: 863
12th grade, no diploma: 1,065
High school graduate (or equivalency): 9,722
Less than 1 year of college: 4,666
Some college more than 1 year, no degree: 6,826
Associate degree: 4,326
Bachelor's degree: 11,633
Master's degree: 2,913
Professional school degree: 169
Doctorate degree: 382
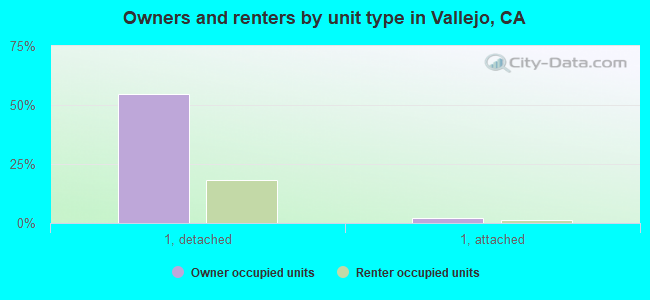
Housing units in structures:
One, detached: 33,337
One, attached: 2,333
Two: 994
3 or 4: 2,057
5 to 9: 1,955
10 to 19: 1,559
20 to 49: 652
50 or more: 2,913
Mobile homes: 1,390
Boats, RVs, vans, etc.: 347
Median worth of mobile homes: $135,945
Housing units lacking complete plumbing facilities in 2022: 0.6%
Housing units lacking complete kitchen facilities in 2022: 0.9%
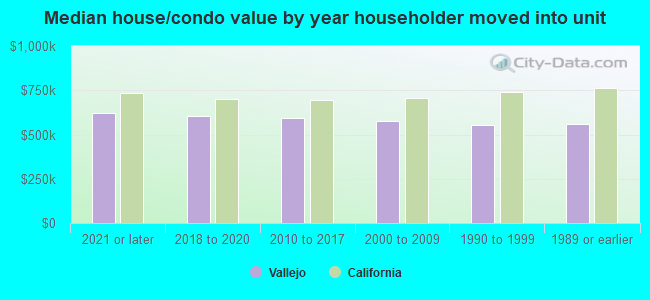
House/condo owner moved in on average 11 years ago