Waukegan, IL (Illinois) Houses and Residents
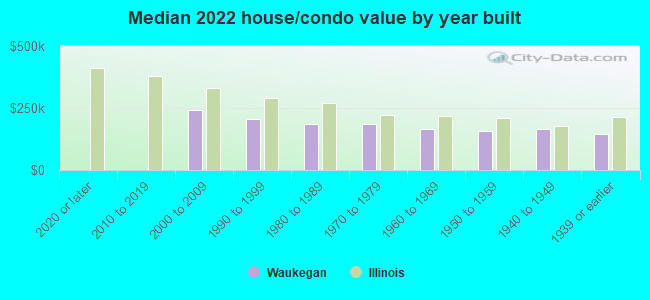
Estimated median house or condo value in 2022: $172,600 (it was $118,700 in 2000 )
Waukegan:
$172,600Illinois:
$251,600
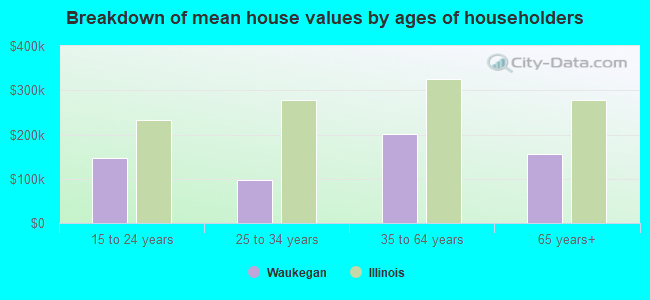
Lower value quartile - upper value quartile: $136,300 - $226,600Mean price in 2022: Detached houses: $216,609 Here:
$216,609State:
$310,164
Townhouses or other attached units: $195,344 Here:
$195,344State:
$286,230
In 2-unit structures: $166,222 Here:
$166,222State:
$299,638
In 3-to-4-unit structures: $213,255 Here:
$213,255State:
$330,907
In 5-or-more-unit structures: $502,478 Here:
$502,478State:
$318,887
Mobile homes: $36,110 Here:
$36,110State:
$78,855
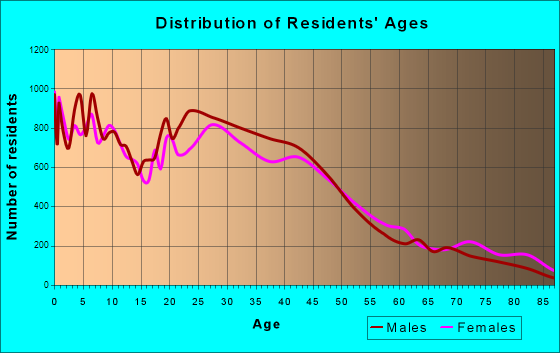
Total population: 88,915 (Urban population: 87,838, Rural population: 131 (31 farm, 100 nonfarm ))
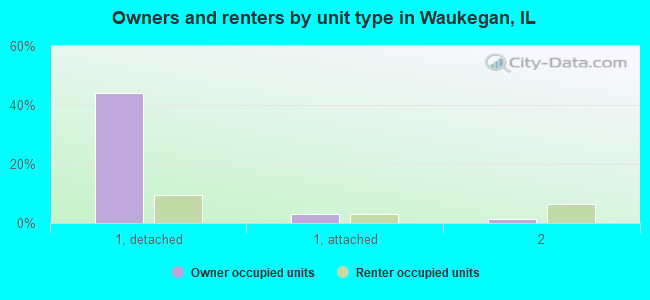
Houses: 33,846 (33,033 occupied: 17,827 owner occupied, 15,206 renter occupied )
% of renters here:
46%State:
33%
Housing density: 1,471 houses/condos per square mile
Median price asked for vacant for-sale houses and condos in 2022: $145,212.
Median contract rent in 2022: $968 (lower quartile is $811, upper quartile is $1,209)
Median rent asked for vacant for-rent units in 2022: $1,045
Median gross rent in Waukegan, IL in 2022: $1,144
Housing units in Waukegan with a mortgage: 8,462 (615 second mortgage, 12 home equity loan, 491 both second mortgage and home equity loan )Houses without a mortgage: 115
Median household income for houses/condos with a mortgage: $97,095
Median household income for apartments without a mortgage: $82,561
Median monthly housing costs: $1,079
Data:
Median house or condo value ($)
Median house or condo value ($ change since 2000)
Median house or condo value ($) - White
Median house or condo value ($) - Black or African American
Median house or condo value ($) - Asian
Median house or condo value ($) - Hispanic or Latino
Median house or condo value ($) - American Indian and Alaska Native
Median house or condo value ($) - Multirace
Median house or condo value ($) - Other Race
Median price asked for mobile homes ($)
Household density (households per square mile)
Mean house or condo value by units in structure - 1, detached ($)
Mean house or condo value by units in structure - 1, attached ($)
Mean house or condo value by units in structure - 2 ($)
Mean house or condo value by units in structure by units in structure - 3 or 4 ($)
Mean house or condo value by units in structure - 5 or more ($)
Mean house or condo value by units in structure - Boat, RV, van, etc. ($)
Mean house or condo value by units in structure - Mobile home ($)
Median contract rent ($)
Median contract rent - Lower quartile ($)
Median contract rent - Upper quartile ($)
Median gross rent ($)
Urban houses (%)
Rural houses (%)
Houses occupied (%)
Houses occupied (% change since 2000)
Houses owner occupied (%)
Houses owner occupied (% change since 2000)
Houses renter occupied (%)
Houses renter occupied (% change since 2000)
Vacant housing units - For rent (%)
Vacant housing units - For rent (% change since 2000)
Vacant housing units - For sale only (%)
Vacant housing units - For sale only (% change since 2000)
Vacant housing units - Rented or sold, not occupied (%)
Vacant housing units - Rented or sold, not occupied (% change since 2000)
Vacant housing units - For seasonal, recreational, or occasional use (%)
Vacant housing units - For seasonal, recreational, or occasional use (% change since 2000)
Vacant housing units - For migrant workers (%)
Vacant housing units - For migrant workers (% change since 2000)
Vacant housing units - Other vacant (%)
Vacant housing units - Other vacant (% change since 2000)
Median monthly housing costs ($)
Median household income for houses/condos with a mortgage ($)
Median household income for houses/condos without a mortgage ($)
Median household income ($)
Median household income ($) - White
Median household income ($) - Black or African American
Median household income ($) - Asian
Median household income ($) - Hispanic or Latino
Median household income ($) - American Indian and Alaska Native
Median household income ($) - Multirace
Median household income ($) - Other Race
Mortgage status - with mortgage (%)
Mortgage status - with second mortgage (%)
Mortgage status - with home equity loan (%)
Mortgage status - with both second mortgage and home equity loan (%)
Mortgage status - without a mortgage (%)
Median year house/condo built
Median year apartment built
Household type by relationship - Male householder living alone (%)
Household type by relationship - Male householder not living alone (%)
Household type by relationship - Female householder living alone (%)
Household type by relationship - Female householder not living alone (%)
Household type by relationship - Opposite-Sex spouse (%)
Household type by relationship - Same-Sex spouse (%)
Household type by relationship - Opposite-Sex unmarried partner (%)
Household type by relationship - Same-Sex unmarried partner (%)
Household type by relationship - In group quarters (%)
Size of family households - 2-person household (%)
Size of family households - 3-person household (%)
Size of family households - 4-person household (%)
Size of family households - 5-person household (%)
Size of family households - 6-person household (%)
Size of family households - 7-or-more-person household (%)
Size of nonfamily households - 1-person household (%)
Size of nonfamily households - 2-person household (%)
Size of nonfamily households - 3-person household (%)
Size of nonfamily households - 4-person household (%)
Size of nonfamily households - 5-person household (%)
Size of nonfamily households - 6-person household (%)
Size of nonfamily households - 7-or-moreperson household (%)
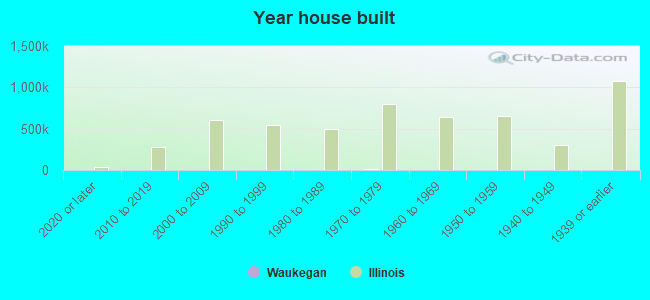
Year house built - Built 2010 or later (%)
Year house built - Built 2000 to 2009 (%)
Year house built - Built 1990 to 1999 (%)
Year house built - Built 1980 to 1989 (%)
Year house built - Built 1970 to 1979 (%)
Year house built - Built 1960 to 1969 (%)
Year house built - Built 1950 to 1959 (%)
Year house built - Built 1940 to 1949 (%)
Year house built - Built 1939 or earlier (%)
Median number of rooms in houses and condos
Median number of rooms in apartments
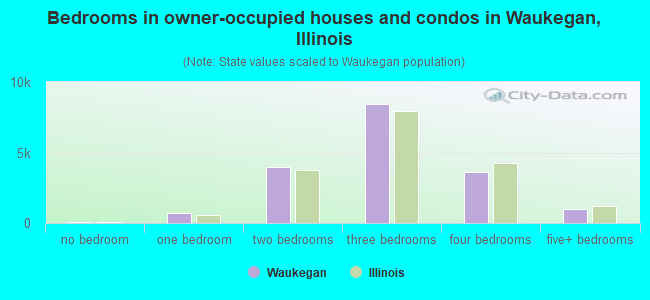
Median number of bedrooms in owner occupied houses
Mean number of bedrooms in owner occupied houses
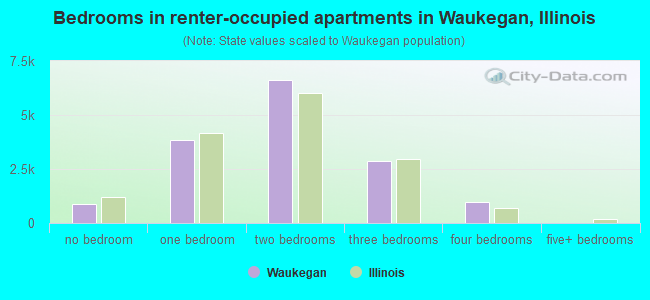
Median number of bedrooms in renter occupied houses
Mean number of bedrooms in renter occupied houses
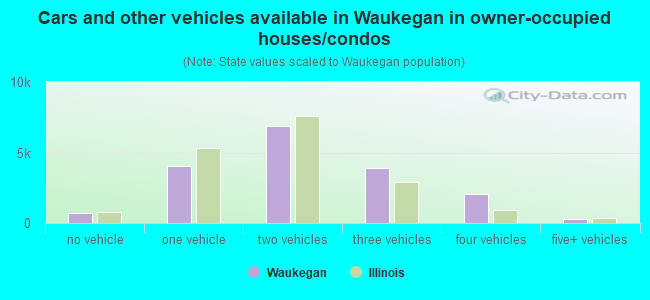
Median number of vehichles in owner occupied houses
Mean number of vehichles in owner occupied houses
Median number of vehichles in renter occupied houses
Mean number of vehichles in renter occupied houses
Rooms in owner-occupied houses - 1 room (%)
Rooms in owner-occupied houses - 2 rooms (%)
Rooms in owner-occupied houses - 3 rooms (%)
Rooms in owner-occupied houses - 4 rooms (%)
Rooms in owner-occupied houses - 5 rooms (%)
Rooms in owner-occupied houses - 6 rooms (%)
Rooms in owner-occupied houses - 7 rooms (%)
Rooms in owner-occupied houses - 8 rooms (%)
Rooms in owner-occupied houses - 9+ rooms (%)
Rooms in renter-occupied houses - 1 room (%)
Rooms in renter-occupied houses - 2 rooms (%)
Rooms in renter-occupied houses - 3 rooms (%)
Rooms in renter-occupied houses - 4 rooms (%)
Rooms in renter-occupied houses - 5 rooms (%)
Rooms in renter-occupied houses - 6 rooms (%)
Rooms in renter-occupied houses - 7 rooms (%)
Rooms in renter-occupied houses - 8 rooms (%)
Rooms in renter-occupied houses - 9+ rooms (%)
Bedrooms in owner-occupied houses - no bedrooms (%)
Bedrooms in owner-occupied houses - 1 bedroom (%)
Bedrooms in owner-occupied houses - 2 bedrooms (%)
Bedrooms in owner-occupied houses - 3 bedrooms (%)
Bedrooms in owner-occupied houses - 4 bedrooms (%)
Bedrooms in owner-occupied houses - 5+ bedrooms (%)
Bedrooms in renter-occupied houses - no bedrooms (%)
Bedrooms in renter-occupied houses - 1 bedroom (%)
Bedrooms in renter-occupied houses - 2 bedrooms (%)
Bedrooms in renter-occupied houses - 3 bedrooms (%)
Bedrooms in renter-occupied houses - 4 bedrooms (%)
Bedrooms in renter-occupied houses - 5+ bedrooms (%)
Vehicles available in owner-occupied houses - no vehicle available (%)
Vehicles available in owner-occupied houses - 1 vehicle available(%)
Vehicles available in owner-occupied houses - 2 Vehicles available (%)
Vehicles available in owner-occupied houses - 3 Vehicles available (%)
Vehicles available in owner-occupied houses - 4 Vehicles available (%)
Vehicles available in owner-occupied houses - 5+ Vehicles available (%)
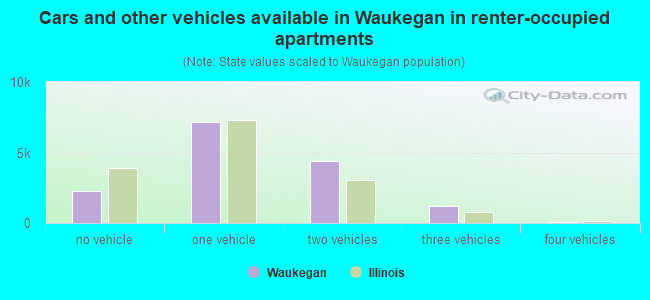
Vehicles available in renter-occupied houses - no vehicle available (%)
Vehicles available in renter-occupied houses - 1 vehicle available (%)
Vehicles available in renter-occupied houses - 2 Vehicles available (%)
Vehicles available in renter-occupied houses - 3 Vehicles available (%)
Vehicles available in renter-occupied houses - 4 Vehicles available (%)
Vehicles available in renter-occupied houses - 5+ Vehicles available (%)
Housing units in structures - 1, detached (%)
Housing units in structures - 1, attached (%)
Housing units in structures - 2 (%)
Housing units in structures - 3 or 4 (%)
Housing units in structures - 5 to 9 (%)
Housing units in structures - 10 to 19 (%)
Housing units in structures - 20 to 49 (%)
Housing units in structures - 50 or more (%)
Housing units in structures - Mobile home (%)
Housing units in structures - Boat, RV, van, etc. (%)
Housing units in structures - Owners - 1, detached (%)
Housing units in structures - Owners - 1, attached (%)
Housing units in structures - Owners - 2 (%)
Housing units in structures - Owners - 3 or 4 (%)
Housing units in structures - Owners - 5 to 9 (%)
Housing units in structures - Owners - 10 to 19 (%)
Housing units in structures - Owners - 20 to 49 (%)
Housing units in structures - Owners - 50 or more (%)
Housing units in structures - Owners - Mobile home (%)
Housing units in structures - Owners - Boat, RV, van, etc. (%)
Housing units in structures - Renters - 1, detached (%)
Housing units in structures - Renters - 1, attached (%)
Housing units in structures - Renters - 2 (%)
Housing units in structures - Renters - 3 or 4 (%)
Housing units in structures - Renters - 5 to 9 (%)
Housing units in structures - Renters - 10 to 19 (%)
Housing units in structures - Renters - 20 to 49 (%)
Housing units in structures - Renters - 50 or more (%)
Housing units in structures - Renters - Mobile home (%)
Housing units in structures - Renters - Boat, RV, van, etc. (%)
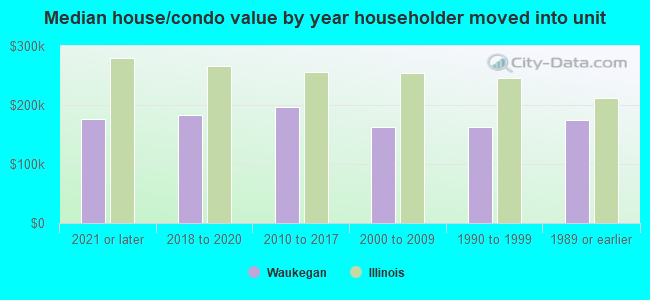
House/condo owner moved in on average (years ago)
Renter moved in on average (years ago)
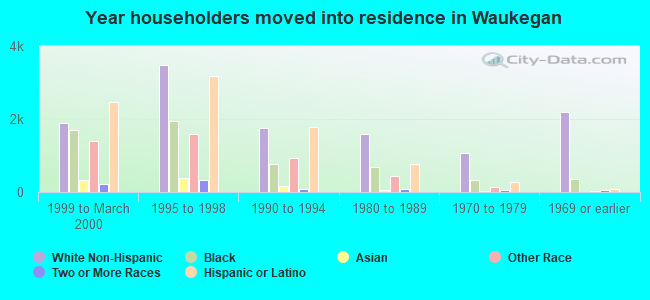
Year householder moved into unit - Moved in 1999 to March 2000 (%)
Year householder moved into unit - Moved in 1999 to March 2000 (%) - White
Year householder moved into unit - Moved in 1999 to March 2000 (%) - Black or African American
Year householder moved into unit - Moved in 1999 to March 2000 (%) - Asian
Year householder moved into unit - Moved in 1999 to March 2000 (%) - Hispanic or Latino
Year householder moved into unit - Moved in 1999 to March 2000 (%) - American Indian and Alaska Native
Year householder moved into unit - Moved in 1999 to March 2000 (%) - Multirace
Year householder moved into unit - Moved in 1999 to March 2000 (%) - Other Race
Year householder moved into unit - Moved in 1995 to 1998 (%)
Year householder moved into unit - Moved in 1995 to 1998 (%) - White
Year householder moved into unit - Moved in 1995 to 1998 (%) - Black or African American
Year householder moved into unit - Moved in 1995 to 1998 (%) - Asian
Year householder moved into unit - Moved in 1995 to 1998 (%) - Hispanic or Latino
Year householder moved into unit - Moved in 1995 to 1998 (%) - American Indian and Alaska Native
Year householder moved into unit - Moved in 1995 to 1998 (%) - Multirace
Year householder moved into unit - Moved in 1995 to 1998 (%) - Other Race
Year householder moved into unit - Moved in 1990 to 1994 (%)
Year householder moved into unit - Moved in 1990 to 1994 (%) - White
Year householder moved into unit - Moved in 1990 to 1994 (%) - Black or African American
Year householder moved into unit - Moved in 1990 to 1994 (%) - Asian
Year householder moved into unit - Moved in 1990 to 1994 (%) - Hispanic or Latino
Year householder moved into unit - Moved in 1990 to 1994 (%) - American Indian and Alaska Native
Year householder moved into unit - Moved in 1990 to 1994 (%) - Multirace
Year householder moved into unit - Moved in 1990 to 1994 (%) - Other Race
Year householder moved into unit - Moved in 1980 to 1989 (%)
Year householder moved into unit - Moved in 1980 to 1989 (%) - White
Year householder moved into unit - Moved in 1980 to 1989 (%) - Black or African American
Year householder moved into unit - Moved in 1980 to 1989 (%) - Asian
Year householder moved into unit - Moved in 1980 to 1989 (%) - Hispanic or Latino
Year householder moved into unit - Moved in 1980 to 1989 (%) - American Indian and Alaska Native
Year householder moved into unit - Moved in 1980 to 1989 (%) - Multirace
Year householder moved into unit - Moved in 1980 to 1989 (%) - Other Race
Year householder moved into unit - Moved in 1970 to 1979 (%)
Year householder moved into unit - Moved in 1970 to 1979 (%) - White
Year householder moved into unit - Moved in 1970 to 1979 (%) - Black or African American
Year householder moved into unit - Moved in 1970 to 1979 (%) - Asian
Year householder moved into unit - Moved in 1970 to 1979 (%) - Hispanic or Latino
Year householder moved into unit - Moved in 1970 to 1979 (%) - American Indian and Alaska Native
Year householder moved into unit - Moved in 1970 to 1979 (%) - Multirace
Year householder moved into unit - Moved in 1970 to 1979 (%) - Other Race
Year householder moved into unit - Moved in 1969 or earlier (%)
Year householder moved into unit - Moved in 1969 or earlier (%) - White
Year householder moved into unit - Moved in 1969 or earlier (%) - Black or African American
Year householder moved into unit - Moved in 1969 or earlier (%) - Asian
Year householder moved into unit - Moved in 1969 or earlier (%) - Hispanic or Latino
Year householder moved into unit - Moved in 1969 or earlier (%) - American Indian and Alaska Native
Year householder moved into unit - Moved in 1969 or earlier (%) - Multirace
Year householder moved into unit - Moved in 1969 or earlier (%) - Other Race
Housing units lacking complete plumbing facilities (%)
Housing units lacking complete kitchen facilities (%)
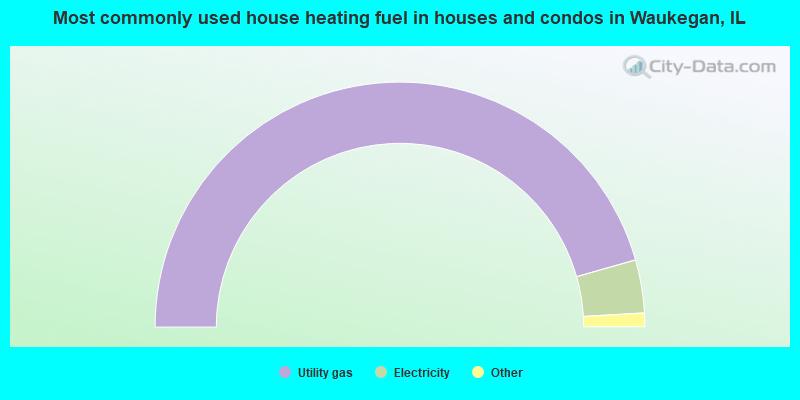
House heating fuel used in houses and condos - Utility gas (%)
House heating fuel used in houses and condos - Bottled, tank, or LP gas (%)
House heating fuel used in houses and condos - Electricity (%)
House heating fuel used in houses and condos - Fuel oil, kerosene, etc. (%)
House heating fuel used in houses and condos - Coal or coke (%)
House heating fuel used in houses and condos - Wood (%)
House heating fuel used in houses and condos - Solar energy (%)
House heating fuel used in houses and condos - Other fuel (%)
House heating fuel used in houses and condos - No fuel used (%)
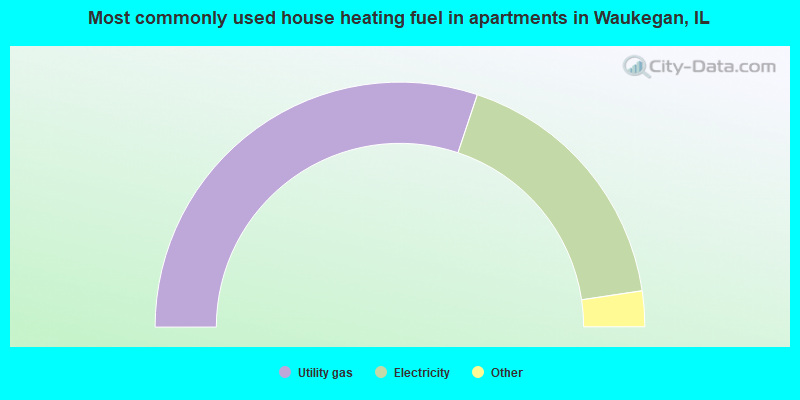
House heating fuel used in apartments - Utility gas (%)
House heating fuel used in apartments - Bottled, tank, or LP gas (%)
House heating fuel used in apartments - Electricity (%)
House heating fuel used in apartments - Fuel oil, kerosene, etc. (%)
House heating fuel used in apartments - Coal or coke (%)
House heating fuel used in apartments - Wood (%)
House heating fuel used in apartments - Solar energy (%)
House heating fuel used in apartments - Other fuel (%)
House heating fuel used in apartments - No fuel used (%)
Latest news about housing in Waukegan, IL collected exclusively by city-data.com from local newspapers, TV, and radio stations
Median year house/condo built: 1965Median year apartment built: 1974Household type by relationship:
Households: 86,472
Male householders: 18,602 (5,966 living alone ), Female householders: 14,431 (4,165 living alone )12,730 spouses (12,655 opposite-sex spouses ), 2,563 unmarried partners , (2,335 opposite-sex unmarried partners ), 26,519 children (25,357 natural , 811 adopted , 351 stepchildren ), 1,662 grandchildren , 2,367 brothers or sisters , 1,698 parents , 0 foster children , 2,715 other relatives , 1,673 non-relatives In group quarters: 1,512
Size of family households: 6,107 2-persons , 4,473 3-persons , 5,167 4-persons , 3,437 5-persons , 704 6-persons , 648 7-or-more-persons .
Size of nonfamily households: 10,131 1-person , 2,216 2-persons , 150 3-persons .
11,363 married couples with children. single-parent households (1,261 men , 5,528 women ).
46.6% of residents of Waukegan speak English at home. of residents speak Spanish at home (54% speak English very well , 23% speak English well , 14% speak English not well , 9% don't speak English at all ).of residents speak other Indo-European language at home (72% speak English very well , 17% speak English well , 9% speak English not well , 2% don't speak English at all ).of residents speak Asian or Pacific Island language at home (70% speak English very well , 25% speak English well , 4% speak English not well , 1% don't speak English at all ).of residents speak other language at home (52% speak English very well , 43% speak English well , 3% speak English not well , 3% don't speak English at all ).
Foreign born population: 27,052 (31.3%)of them are naturalized citizens )
Median number of rooms in houses and condos:
Median number of rooms in apartments
Owner-occupied Renter-occupied
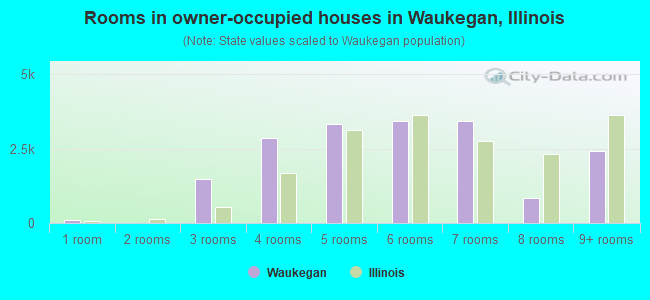
Rooms in owner-occupied houses in Waukegan, Illinois
89 1 room 0 2 rooms 1,487 3 rooms 2,842 4 rooms 3,319 5 rooms 3,418 6 rooms 3,415 7 rooms 827 8 rooms 2,430 9+ rooms
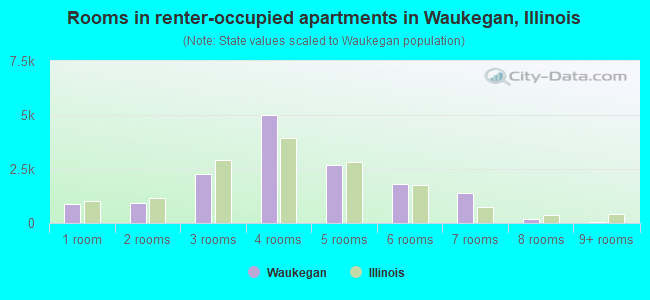
Rooms in renter-occupied apartments in Waukegan, Illinois
869 1 room 942 2 rooms 2,284 3 rooms 5,022 4 rooms 2,686 5 rooms 1,783 6 rooms 1,375 7 rooms 186 8 rooms 59 9+ rooms
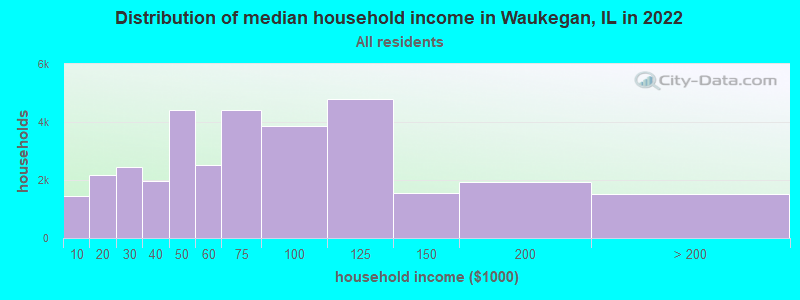
Waukegan, IL household income distribution 1,449 Less than $10,0002,174 $10,000 to $19,9992,451 $20,000 to $29,9991,950 $30,000 to $39,9994,408 $40,000 to $49,9992,517 $50,000 to $59,9994,409 $60,000 to $74,9993,871 $75,000 to $99,9994,806 $100,000 to $124,9991,549 $125,000 to $149,9991,922 $150,000 to $199,9991,527 $200,000 or more
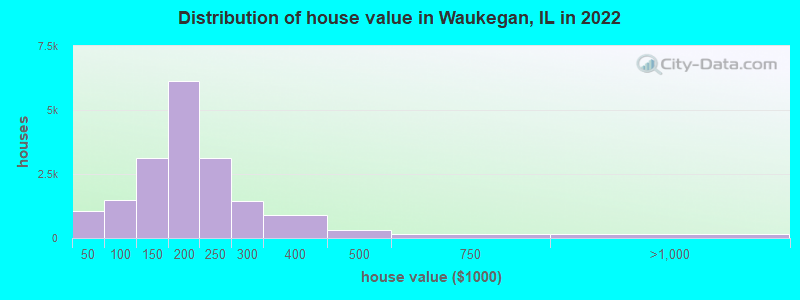
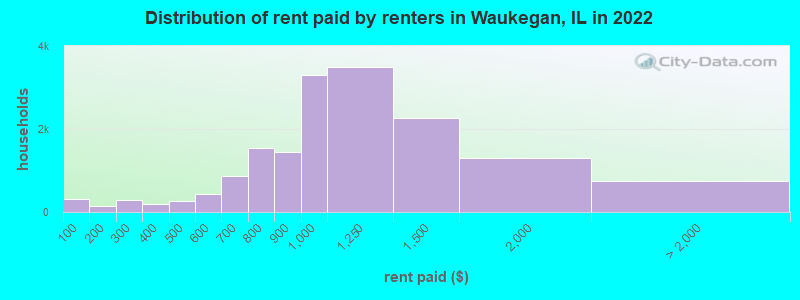
Home value of owner - occupied houses in 2022 in Waukegan, IL 512 Less than $10,000198 $20,000 to $24,999242 $30,000 to $34,99986 $40,000 to $49,999300 $60,000 to $69,999498 $70,000 to $79,999256 $80,000 to $89,999344 $90,000 to $99,9991,113 $100,000 to $124,9992,017 $125,000 to $149,9993,711 $150,000 to $174,9992,419 $175,000 to $199,9993,143 $200,000 to $249,9991,438 $250,000 to $299,999879 $300,000 to $399,999328 $400,000 to $499,999174 $500,000 to $749,99963 $750,000 to $999,999106 $1,000,000 to $1,499,999Rent paid by renters in 2022 in Waukegan, IL 311 Less than $100110 $100 to $14945 $150 to $199113 $200 to $249173 $250 to $299114 $300 to $34983 $350 to $399130 $400 to $449138 $450 to $499302 $500 to $549139 $550 to $599526 $600 to $649344 $650 to $699804 $700 to $749733 $750 to $7991,434 $800 to $8993,300 $900 to $9993,505 $1,000 to $1,2492,271 $1,250 to $1,4991,303 $1,500 to $1,99969 $2,000 to $2,49990 $2,500 to $2,999576 No cash rent
Percentage of workers working in this county: 78.8%Number of people working at home: 3,141 (7.2% of all workers )
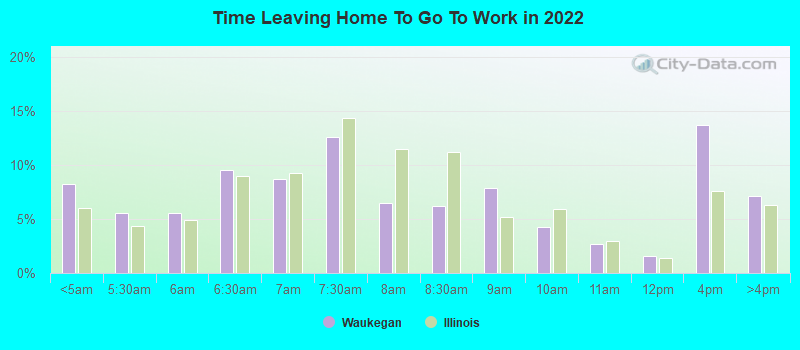
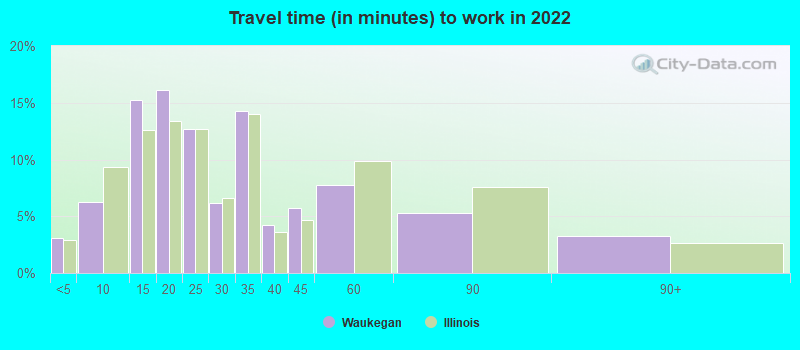
Travel time to work (commute)
Less than 5 minutes: 1,3865 to 9 minutes: 3,61910 to 14 minutes: 4,32415 to 19 minutes: 6,07920 to 24 minutes: 4,23725 to 29 minutes: 5,61830 to 34 minutes: 5,09735 to 39 minutes: 67040 to 44 minutes: 2,25545 to 59 minutes: 2,65560 to 89 minutes: 1,49690 or more minutes: 871
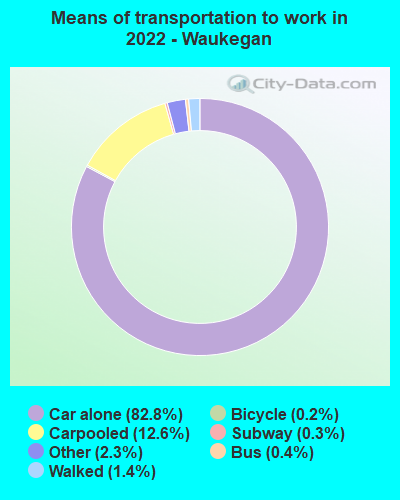
Means of transportation to work:
Drove a car alone: 24,318 (73.0%)Carpooled: 3,754 (11.3%)Bus : 143 (0.4%)Long-distance train or commuter rail : 69 (0.2%)Taxi: 698 (2.1%)Bicycle: 90 (0.3%)Walked: 400 (1.2%)Worked at home: 3,141 (9.4%)
Unemployment by race in 2022
Unemployment rate for White non-Hispanic residents 7.2% Males6.2% FemalesUnemployment rate for Black residents 2.9% Males5.0% FemalesUnemployment rate for American Indian and Alaska Native residents 0.4% Males1.5% FemalesUnemployment rate for Asian residents 2.4% Males0.9% FemalesUnemployment rate for other race residents 3.2% Males3.5% FemalesUnemployment rate for two or more race residents 1.8% Males5.5% FemalesUnemployment rate for Hispanic or Latino residents 1.4% Males0.9% Females
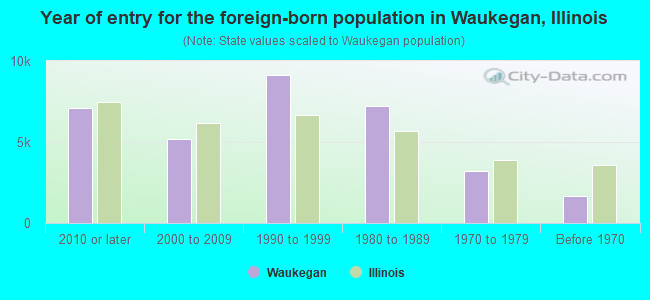
Year of entry for the foreign-born population in Waukegan, Illinois
7,086 2010 or later 5,187 2000 to 2009 9,117 1990 to 1999 7,247 1980 to 1989 3,189 1970 to 1979 1,642 Before 1970
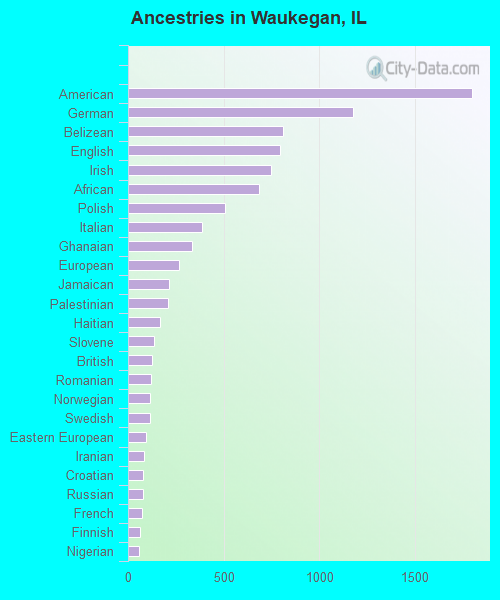
First ancestries reported:
American: 1,798 (3.3%)
German: 1,177 (2.2%)
Belizean: 813 (1.5%)
English: 794 (1.5%)
Irish: 746 (1.4%)
African: 686 (1.3%)
Polish: 506 (0.9%)
Italian: 387 (0.7%)
Ghanaian: 334 (0.6%)
European: 267 (0.5%)
Jamaican: 217 (0.4%)
Palestinian: 208 (0.4%)
Haitian: 165 (0.3%)
Slovene: 135 (0.2%)
British: 125 (0.2%)
Romanian: 120 (0.2%)
Norwegian: 115 (0.2%)
Swedish: 114 (0.2%)
Eastern European: 92 (0.2%)
Iranian: 86 (0.2%)
Croatian: 81 (0.1%)
Russian: 77 (0.1%)
French: 71 (0.1%)
Finnish: 62 (0.1%)
Nigerian: 58 (0.1%)
Greek: 50 (0.09%)
Brazilian: 46 (0.08%)
Kenyan: 43 (0.08%)
Scottish: 38 (0.07%)
Iraqi: 37 (0.07%)
Austrian: 31 (0.06%)
Danish: 29 (0.05%)
Czechoslovakian: 25 (0.05%)
Portuguese: 24 (0.04%)
Assyrian: 24 (0.04%)
Dutch: 23 (0.04%)
Slovak: 20 (0.04%)
Syrian: 19 (0.04%)
Scandinavian: 18 (0.03%)
Czech: 15 (0.03%)
Armenian: 15 (0.03%)
Egyptian: 15 (0.03%)
Trinidadian and Tobagonian: 15 (0.03%)
Hungarian: 14 (0.03%)
Jordanian: 14 (0.03%)
Swiss: 10 (0.02%)
Lithuanian: 9 (0.02%)
Northern European: 9 (0.02%)
Moroccan: 9 (0.02%)
French Canadian: 6 (0.01%)
Yugoslavian: 6 (0.01%)
Israeli: 5 (0.01%)
Canadian: 3 (0.01%)
Most common places of birth for foreign-born residents (%): Mexico Waukegan:
59.7% (15,922)Illinois:
34.7% (626,958)
Honduras Waukegan:
7.7% (2,063)Illinois:
0.6% (10,762)
Philippines Waukegan:
7.4% (1,985)Illinois:
5.2% (93,003)
India Waukegan:
6.2% (1,643)Illinois:
9.2% (166,409)
Belize Waukegan:
4.4% (1,162)Illinois:
0.3% (4,639)
El Salvador Waukegan:
1.8% (473)Illinois:
0.6% (11,009)
Place of birth for U.S.-born residents:
This state: 44,488Other state: 12,325Northeast: 1,097Midwest: 3,471South: 4,703West: 3,054 84.6% of Waukegan residents lived in the same house 1 years ago.
Out of people who lived in different houses, 39.4% lived in this county.
Out of people who lived in different counties, 58.4% lived in Illinois.
Waukegan:
84.6%State average:
88.3%
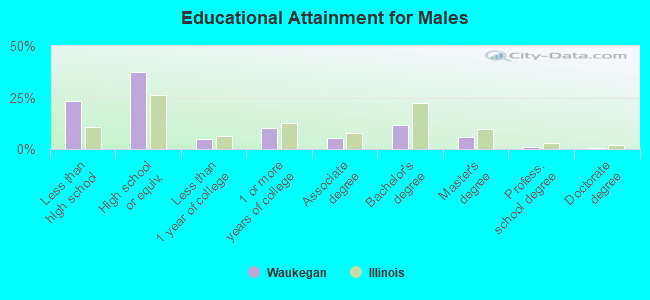
Education attainment for males 25 years and older:
No schooling: 1,075Nursery to 4th grade: 5525th and 6th grade: 6737th and 8th grade: 1,2069th grade: 87410th grade: 96911th grade: 40212th grade, no diploma: 1,050High school graduate (or equivalency): 10,985Less than 1 year of college: 1,491Some college more than 1 year, no degree: 2,981Associate degree: 1,538Bachelor's degree: 3,432Master's degree: 1,747Professional school degree: 213Doctorate degree: 154
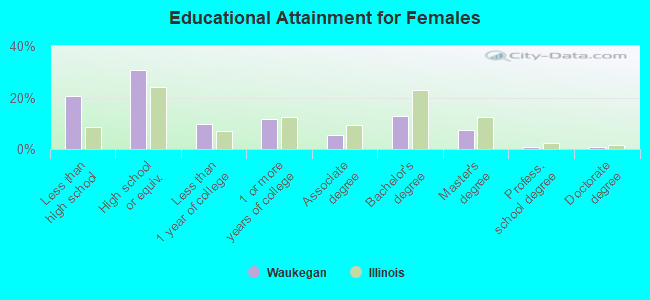
Education attainment for females 25 years and older:
No schooling: 1,926Nursery to 4th grade: 4355th and 6th grade: 5947th and 8th grade: 1,1349th grade: 51710th grade: 19311th grade: 49212th grade, no diploma: 424High school graduate (or equivalency): 8,451Less than 1 year of college: 2,729Some college more than 1 year, no degree: 3,281Associate degree: 1,496Bachelor's degree: 3,571Master's degree: 2,095Professional school degree: 207Doctorate degree: 172
Housing units in structures:
One, detached: 19,210One, attached: 2,420Two: 1,4883 or 4: 1,2935 to 9: 2,59010 to 19: 2,08020 to 49: 1,60650 or more: 3,069Mobile homes: 90Housing units lacking complete plumbing facilities in 2022: 0.4%Housing units lacking complete kitchen facilities in 2022: 2.0%House/condo owner moved in on average 16 years ago
Renter moved in on average 3 years ago
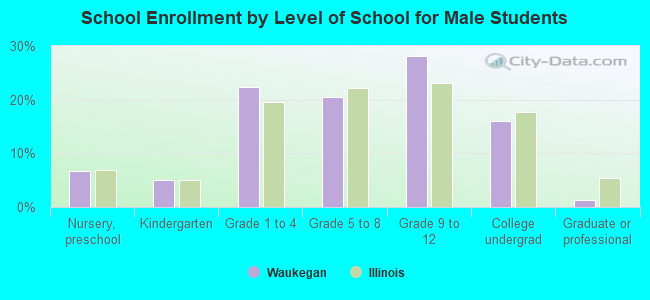
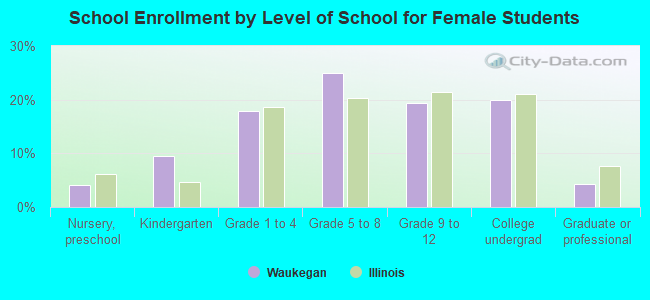
Private vs. public school enrollment:
Students in private schools in grades 1 to 8 (elementary and middle school): 1,283 Students in private schools in grades 9 to 12 (high school): 431 Students in private undergraduate colleges: 804