Waukegan, Illinois Submit your own pictures of this city and show them to the world
OSM Map
General Map
Google Map
MSN Map
OSM Map
General Map
Google Map
MSN Map
OSM Map
General Map
Google Map
MSN Map
OSM Map
General Map
Google Map
MSN Map
Please wait while loading the map...
Population in 2022: 87,976 (100% urban, 0% rural). Population change since 2000: +0.1%Males: 44,073 Females: 43,903
March 2022 cost of living index in Waukegan: 94.9 (less than average, U.S. average is 100) Percentage of residents living in poverty in 2022: 11.6%for White Non-Hispanic residents , 20.2% for Black residents , 15.6% for Hispanic or Latino residents , 13.6% for American Indian residents , 13.5% for other race residents , 13.5% for two or more races residents )
Profiles of local businesses
Business Search - 14 Million verified businesses
Data:
Median household income ($)
Median household income (% change since 2000)
Household income diversity
Ratio of average income to average house value (%)
Ratio of average income to average rent
Median household income ($) - White
Median household income ($) - Black or African American
Median household income ($) - Asian
Median household income ($) - Hispanic or Latino
Median household income ($) - American Indian and Alaska Native
Median household income ($) - Multirace
Median household income ($) - Other Race
Median household income for houses/condos with a mortgage ($)
Median household income for apartments without a mortgage ($)
Races - White alone (%)
Races - White alone (% change since 2000)
Races - Black alone (%)
Races - Black alone (% change since 2000)
Races - American Indian alone (%)
Races - American Indian alone (% change since 2000)
Races - Asian alone (%)
Races - Asian alone (% change since 2000)
Races - Hispanic (%)
Races - Hispanic (% change since 2000)
Races - Native Hawaiian and Other Pacific Islander alone (%)
Races - Native Hawaiian and Other Pacific Islander alone (% change since 2000)
Races - Two or more races (%)
Races - Two or more races (% change since 2000)
Races - Other race alone (%)
Races - Other race alone (% change since 2000)
Racial diversity
Unemployment (%)
Unemployment (% change since 2000)
Unemployment (%) - White
Unemployment (%) - Black or African American
Unemployment (%) - Asian
Unemployment (%) - Hispanic or Latino
Unemployment (%) - American Indian and Alaska Native
Unemployment (%) - Multirace
Unemployment (%) - Other Race
Population density (people per square mile)
Population - Males (%)
Population - Females (%)
Population - Males (%) - White
Population - Males (%) - Black or African American
Population - Males (%) - Asian
Population - Males (%) - Hispanic or Latino
Population - Males (%) - American Indian and Alaska Native
Population - Males (%) - Multirace
Population - Males (%) - Other Race
Population - Females (%) - White
Population - Females (%) - Black or African American
Population - Females (%) - Asian
Population - Females (%) - Hispanic or Latino
Population - Females (%) - American Indian and Alaska Native
Population - Females (%) - Multirace
Population - Females (%) - Other Race
Coronavirus confirmed cases (Apr 27, 2024)
Deaths caused by coronavirus (Apr 27, 2024)
Coronavirus confirmed cases (per 100k population) (Apr 27, 2024)
Deaths caused by coronavirus (per 100k population) (Apr 27, 2024)
Daily increase in number of cases (Apr 27, 2024)
Weekly increase in number of cases (Apr 27, 2024)
Cases doubled (in days) (Apr 27, 2024)
Hospitalized patients (Apr 18, 2022)
Negative test results (Apr 18, 2022)
Total test results (Apr 18, 2022)
COVID Vaccine doses distributed (per 100k population) (Sep 19, 2023)
COVID Vaccine doses administered (per 100k population) (Sep 19, 2023)
COVID Vaccine doses distributed (Sep 19, 2023)
COVID Vaccine doses administered (Sep 19, 2023)
Likely homosexual households (%)
Likely homosexual households (% change since 2000)
Likely homosexual households - Lesbian couples (%)
Likely homosexual households - Lesbian couples (% change since 2000)
Likely homosexual households - Gay men (%)
Likely homosexual households - Gay men (% change since 2000)
Cost of living index
Median gross rent ($)
Median contract rent ($)
Median monthly housing costs ($)
Median house or condo value ($)
Median house or condo value ($ change since 2000)
Mean house or condo value by units in structure - 1, detached ($)
Mean house or condo value by units in structure - 1, attached ($)
Mean house or condo value by units in structure - 2 ($)
Mean house or condo value by units in structure by units in structure - 3 or 4 ($)
Mean house or condo value by units in structure - 5 or more ($)
Mean house or condo value by units in structure - Boat, RV, van, etc. ($)
Mean house or condo value by units in structure - Mobile home ($)
Median house or condo value ($) - White
Median house or condo value ($) - Black or African American
Median house or condo value ($) - Asian
Median house or condo value ($) - Hispanic or Latino
Median house or condo value ($) - American Indian and Alaska Native
Median house or condo value ($) - Multirace
Median house or condo value ($) - Other Race
Median resident age
Resident age diversity
Median resident age - Males
Median resident age - Females
Median resident age - White
Median resident age - Black or African American
Median resident age - Asian
Median resident age - Hispanic or Latino
Median resident age - American Indian and Alaska Native
Median resident age - Multirace
Median resident age - Other Race
Median resident age - Males - White
Median resident age - Males - Black or African American
Median resident age - Males - Asian
Median resident age - Males - Hispanic or Latino
Median resident age - Males - American Indian and Alaska Native
Median resident age - Males - Multirace
Median resident age - Males - Other Race
Median resident age - Females - White
Median resident age - Females - Black or African American
Median resident age - Females - Asian
Median resident age - Females - Hispanic or Latino
Median resident age - Females - American Indian and Alaska Native
Median resident age - Females - Multirace
Median resident age - Females - Other Race
Commute - mean travel time to work (minutes)
Travel time to work - Less than 5 minutes (%)
Travel time to work - Less than 5 minutes (% change since 2000)
Travel time to work - 5 to 9 minutes (%)
Travel time to work - 5 to 9 minutes (% change since 2000)
Travel time to work - 10 to 19 minutes (%)
Travel time to work - 10 to 19 minutes (% change since 2000)
Travel time to work - 20 to 29 minutes (%)
Travel time to work - 20 to 29 minutes (% change since 2000)
Travel time to work - 30 to 39 minutes (%)
Travel time to work - 30 to 39 minutes (% change since 2000)
Travel time to work - 40 to 59 minutes (%)
Travel time to work - 40 to 59 minutes (% change since 2000)
Travel time to work - 60 to 89 minutes (%)
Travel time to work - 60 to 89 minutes (% change since 2000)
Travel time to work - 90 or more minutes (%)
Travel time to work - 90 or more minutes (% change since 2000)
Marital status - Never married (%)
Marital status - Now married (%)
Marital status - Separated (%)
Marital status - Widowed (%)
Marital status - Divorced (%)
Median family income ($)
Median family income (% change since 2000)
Median non-family income ($)
Median non-family income (% change since 2000)
Median per capita income ($)
Median per capita income (% change since 2000)
Median family income ($) - White
Median family income ($) - Black or African American
Median family income ($) - Asian
Median family income ($) - Hispanic or Latino
Median family income ($) - American Indian and Alaska Native
Median family income ($) - Multirace
Median family income ($) - Other Race
Median year house/condo built
Median year apartment built
Year house built - Built 2005 or later (%)
Year house built - Built 2000 to 2004 (%)
Year house built - Built 1990 to 1999 (%)
Year house built - Built 1980 to 1989 (%)
Year house built - Built 1970 to 1979 (%)
Year house built - Built 1960 to 1969 (%)
Year house built - Built 1950 to 1959 (%)
Year house built - Built 1940 to 1949 (%)
Year house built - Built 1939 or earlier (%)
Average household size
Household density (households per square mile)
Average household size - White
Average household size - Black or African American
Average household size - Asian
Average household size - Hispanic or Latino
Average household size - American Indian and Alaska Native
Average household size - Multirace
Average household size - Other Race
Occupied housing units (%)
Vacant housing units (%)
Owner occupied housing units (%)
Renter occupied housing units (%)
Vacancy status - For rent (%)
Vacancy status - For sale only (%)
Vacancy status - Rented or sold, not occupied (%)
Vacancy status - For seasonal, recreational, or occasional use (%)
Vacancy status - For migrant workers (%)
Vacancy status - Other vacant (%)
Residents with income below the poverty level (%)
Residents with income below 50% of the poverty level (%)
Children below poverty level (%)
Poor families by family type - Married-couple family (%)
Poor families by family type - Male, no wife present (%)
Poor families by family type - Female, no husband present (%)
Poverty status for native-born residents (%)
Poverty status for foreign-born residents (%)
Poverty among high school graduates not in families (%)
Poverty among people who did not graduate high school not in families (%)
Residents with income below the poverty level (%) - White
Residents with income below the poverty level (%) - Black or African American
Residents with income below the poverty level (%) - Asian
Residents with income below the poverty level (%) - Hispanic or Latino
Residents with income below the poverty level (%) - American Indian and Alaska Native
Residents with income below the poverty level (%) - Multirace
Residents with income below the poverty level (%) - Other Race
Air pollution - Air Quality Index (AQI)
Air pollution - CO
Air pollution - NO2
Air pollution - SO2
Air pollution - Ozone
Air pollution - PM10
Air pollution - PM25
Air pollution - Pb
Crime - Murders per 100,000 population
Crime - Rapes per 100,000 population
Crime - Robberies per 100,000 population
Crime - Assaults per 100,000 population
Crime - Burglaries per 100,000 population
Crime - Thefts per 100,000 population
Crime - Auto thefts per 100,000 population
Crime - Arson per 100,000 population
Crime - City-data.com crime index
Crime - Violent crime index
Crime - Property crime index
Crime - Murders per 100,000 population (5 year average)
Crime - Rapes per 100,000 population (5 year average)
Crime - Robberies per 100,000 population (5 year average)
Crime - Assaults per 100,000 population (5 year average)
Crime - Burglaries per 100,000 population (5 year average)
Crime - Thefts per 100,000 population (5 year average)
Crime - Auto thefts per 100,000 population (5 year average)
Crime - Arson per 100,000 population (5 year average)
Crime - City-data.com crime index (5 year average)
Crime - Violent crime index (5 year average)
Crime - Property crime index (5 year average)
1996 Presidential Elections Results (%) - Democratic Party (Clinton)
1996 Presidential Elections Results (%) - Republican Party (Dole)
1996 Presidential Elections Results (%) - Other
2000 Presidential Elections Results (%) - Democratic Party (Gore)
2000 Presidential Elections Results (%) - Republican Party (Bush)
2000 Presidential Elections Results (%) - Other
2004 Presidential Elections Results (%) - Democratic Party (Kerry)
2004 Presidential Elections Results (%) - Republican Party (Bush)
2004 Presidential Elections Results (%) - Other
2008 Presidential Elections Results (%) - Democratic Party (Obama)
2008 Presidential Elections Results (%) - Republican Party (McCain)
2008 Presidential Elections Results (%) - Other
2012 Presidential Elections Results (%) - Democratic Party (Obama)
2012 Presidential Elections Results (%) - Republican Party (Romney)
2012 Presidential Elections Results (%) - Other
2016 Presidential Elections Results (%) - Democratic Party (Clinton)
2016 Presidential Elections Results (%) - Republican Party (Trump)
2016 Presidential Elections Results (%) - Other
2020 Presidential Elections Results (%) - Democratic Party (Biden)
2020 Presidential Elections Results (%) - Republican Party (Trump)
2020 Presidential Elections Results (%) - Other
Ancestries Reported - Arab (%)
Ancestries Reported - Czech (%)
Ancestries Reported - Danish (%)
Ancestries Reported - Dutch (%)
Ancestries Reported - English (%)
Ancestries Reported - French (%)
Ancestries Reported - French Canadian (%)
Ancestries Reported - German (%)
Ancestries Reported - Greek (%)
Ancestries Reported - Hungarian (%)
Ancestries Reported - Irish (%)
Ancestries Reported - Italian (%)
Ancestries Reported - Lithuanian (%)
Ancestries Reported - Norwegian (%)
Ancestries Reported - Polish (%)
Ancestries Reported - Portuguese (%)
Ancestries Reported - Russian (%)
Ancestries Reported - Scotch-Irish (%)
Ancestries Reported - Scottish (%)
Ancestries Reported - Slovak (%)
Ancestries Reported - Subsaharan African (%)
Ancestries Reported - Swedish (%)
Ancestries Reported - Swiss (%)
Ancestries Reported - Ukrainian (%)
Ancestries Reported - United States (%)
Ancestries Reported - Welsh (%)
Ancestries Reported - West Indian (%)
Ancestries Reported - Other (%)
Educational Attainment - No schooling completed (%)
Educational Attainment - Less than high school (%)
Educational Attainment - High school or equivalent (%)
Educational Attainment - Less than 1 year of college (%)
Educational Attainment - 1 or more years of college (%)
Educational Attainment - Associate degree (%)
Educational Attainment - Bachelor's degree (%)
Educational Attainment - Master's degree (%)
Educational Attainment - Professional school degree (%)
Educational Attainment - Doctorate degree (%)
School Enrollment - Nursery, preschool (%)
School Enrollment - Kindergarten (%)
School Enrollment - Grade 1 to 4 (%)
School Enrollment - Grade 5 to 8 (%)
School Enrollment - Grade 9 to 12 (%)
School Enrollment - College undergrad (%)
School Enrollment - Graduate or professional (%)
School Enrollment - Not enrolled in school (%)
School enrollment - Public schools (%)
School enrollment - Private schools (%)
School enrollment - Not enrolled (%)
Median number of rooms in houses and condos
Median number of rooms in apartments
Housing units lacking complete plumbing facilities (%)
Housing units lacking complete kitchen facilities (%)
Density of houses
Urban houses (%)
Rural houses (%)
Households with people 60 years and over (%)
Households with people 65 years and over (%)
Households with people 75 years and over (%)
Households with one or more nonrelatives (%)
Households with no nonrelatives (%)
Population in households (%)
Family households (%)
Nonfamily households (%)
Population in families (%)
Family households with own children (%)
Median number of bedrooms in owner occupied houses
Mean number of bedrooms in owner occupied houses
Median number of bedrooms in renter occupied houses
Mean number of bedrooms in renter occupied houses
Median number of vehichles in owner occupied houses
Mean number of vehichles in owner occupied houses
Median number of vehichles in renter occupied houses
Mean number of vehichles in renter occupied houses
Mortgage status - with mortgage (%)
Mortgage status - with second mortgage (%)
Mortgage status - with home equity loan (%)
Mortgage status - with both second mortgage and home equity loan (%)
Mortgage status - without a mortgage (%)
Average family size
Average family size - White
Average family size - Black or African American
Average family size - Asian
Average family size - Hispanic or Latino
Average family size - American Indian and Alaska Native
Average family size - Multirace
Average family size - Other Race
Geographical mobility - Same house 1 year ago (%)
Geographical mobility - Moved within same county (%)
Geographical mobility - Moved from different county within same state (%)
Geographical mobility - Moved from different state (%)
Geographical mobility - Moved from abroad (%)
Place of birth - Born in state of residence (%)
Place of birth - Born in other state (%)
Place of birth - Native, outside of US (%)
Place of birth - Foreign born (%)
Housing units in structures - 1, detached (%)
Housing units in structures - 1, attached (%)
Housing units in structures - 2 (%)
Housing units in structures - 3 or 4 (%)
Housing units in structures - 5 to 9 (%)
Housing units in structures - 10 to 19 (%)
Housing units in structures - 20 to 49 (%)
Housing units in structures - 50 or more (%)
Housing units in structures - Mobile home (%)
Housing units in structures - Boat, RV, van, etc. (%)
House/condo owner moved in on average (years ago)
Renter moved in on average (years ago)
Year householder moved into unit - Moved in 1999 to March 2000 (%)
Year householder moved into unit - Moved in 1995 to 1998 (%)
Year householder moved into unit - Moved in 1990 to 1994 (%)
Year householder moved into unit - Moved in 1980 to 1989 (%)
Year householder moved into unit - Moved in 1970 to 1979 (%)
Year householder moved into unit - Moved in 1969 or earlier (%)
Means of transportation to work - Drove car alone (%)
Means of transportation to work - Carpooled (%)
Means of transportation to work - Public transportation (%)
Means of transportation to work - Bus or trolley bus (%)
Means of transportation to work - Streetcar or trolley car (%)
Means of transportation to work - Subway or elevated (%)
Means of transportation to work - Railroad (%)
Means of transportation to work - Ferryboat (%)
Means of transportation to work - Taxicab (%)
Means of transportation to work - Motorcycle (%)
Means of transportation to work - Bicycle (%)
Means of transportation to work - Walked (%)
Means of transportation to work - Other means (%)
Working at home (%)
Industry diversity
Most Common Industries - Agriculture, forestry, fishing and hunting, and mining (%)
Most Common Industries - Agriculture, forestry, fishing and hunting (%)
Most Common Industries - Mining, quarrying, and oil and gas extraction (%)
Most Common Industries - Construction (%)
Most Common Industries - Manufacturing (%)
Most Common Industries - Wholesale trade (%)
Most Common Industries - Retail trade (%)
Most Common Industries - Transportation and warehousing, and utilities (%)
Most Common Industries - Transportation and warehousing (%)
Most Common Industries - Utilities (%)
Most Common Industries - Information (%)
Most Common Industries - Finance and insurance, and real estate and rental and leasing (%)
Most Common Industries - Finance and insurance (%)
Most Common Industries - Real estate and rental and leasing (%)
Most Common Industries - Professional, scientific, and management, and administrative and waste management services (%)
Most Common Industries - Professional, scientific, and technical services (%)
Most Common Industries - Management of companies and enterprises (%)
Most Common Industries - Administrative and support and waste management services (%)
Most Common Industries - Educational services, and health care and social assistance (%)
Most Common Industries - Educational services (%)
Most Common Industries - Health care and social assistance (%)
Most Common Industries - Arts, entertainment, and recreation, and accommodation and food services (%)
Most Common Industries - Arts, entertainment, and recreation (%)
Most Common Industries - Accommodation and food services (%)
Most Common Industries - Other services, except public administration (%)
Most Common Industries - Public administration (%)
Occupation diversity
Most Common Occupations - Management, business, science, and arts occupations (%)
Most Common Occupations - Management, business, and financial occupations (%)
Most Common Occupations - Management occupations (%)
Most Common Occupations - Business and financial operations occupations (%)
Most Common Occupations - Computer, engineering, and science occupations (%)
Most Common Occupations - Computer and mathematical occupations (%)
Most Common Occupations - Architecture and engineering occupations (%)
Most Common Occupations - Life, physical, and social science occupations (%)
Most Common Occupations - Education, legal, community service, arts, and media occupations (%)
Most Common Occupations - Community and social service occupations (%)
Most Common Occupations - Legal occupations (%)
Most Common Occupations - Education, training, and library occupations (%)
Most Common Occupations - Arts, design, entertainment, sports, and media occupations (%)
Most Common Occupations - Healthcare practitioners and technical occupations (%)
Most Common Occupations - Health diagnosing and treating practitioners and other technical occupations (%)
Most Common Occupations - Health technologists and technicians (%)
Most Common Occupations - Service occupations (%)
Most Common Occupations - Healthcare support occupations (%)
Most Common Occupations - Protective service occupations (%)
Most Common Occupations - Fire fighting and prevention, and other protective service workers including supervisors (%)
Most Common Occupations - Law enforcement workers including supervisors (%)
Most Common Occupations - Food preparation and serving related occupations (%)
Most Common Occupations - Building and grounds cleaning and maintenance occupations (%)
Most Common Occupations - Personal care and service occupations (%)
Most Common Occupations - Sales and office occupations (%)
Most Common Occupations - Sales and related occupations (%)
Most Common Occupations - Office and administrative support occupations (%)
Most Common Occupations - Natural resources, construction, and maintenance occupations (%)
Most Common Occupations - Farming, fishing, and forestry occupations (%)
Most Common Occupations - Construction and extraction occupations (%)
Most Common Occupations - Installation, maintenance, and repair occupations (%)
Most Common Occupations - Production, transportation, and material moving occupations (%)
Most Common Occupations - Production occupations (%)
Most Common Occupations - Transportation occupations (%)
Most Common Occupations - Material moving occupations (%)
People in Group quarters - Institutionalized population (%)
People in Group quarters - Correctional institutions (%)
People in Group quarters - Federal prisons and detention centers (%)
People in Group quarters - Halfway houses (%)
People in Group quarters - Local jails and other confinement facilities (including police lockups) (%)
People in Group quarters - Military disciplinary barracks (%)
People in Group quarters - State prisons (%)
People in Group quarters - Other types of correctional institutions (%)
People in Group quarters - Nursing homes (%)
People in Group quarters - Hospitals/wards, hospices, and schools for the handicapped (%)
People in Group quarters - Hospitals/wards and hospices for chronically ill (%)
People in Group quarters - Hospices or homes for chronically ill (%)
People in Group quarters - Military hospitals or wards for chronically ill (%)
People in Group quarters - Other hospitals or wards for chronically ill (%)
People in Group quarters - Hospitals or wards for drug/alcohol abuse (%)
People in Group quarters - Mental (Psychiatric) hospitals or wards (%)
People in Group quarters - Schools, hospitals, or wards for the mentally retarded (%)
People in Group quarters - Schools, hospitals, or wards for the physically handicapped (%)
People in Group quarters - Institutions for the deaf (%)
People in Group quarters - Institutions for the blind (%)
People in Group quarters - Orthopedic wards and institutions for the physically handicapped (%)
People in Group quarters - Wards in general hospitals for patients who have no usual home elsewhere (%)
People in Group quarters - Wards in military hospitals for patients who have no usual home elsewhere (%)
People in Group quarters - Juvenile institutions (%)
People in Group quarters - Long-term care (%)
People in Group quarters - Homes for abused, dependent, and neglected children (%)
People in Group quarters - Residential treatment centers for emotionally disturbed children (%)
People in Group quarters - Training schools for juvenile delinquents (%)
People in Group quarters - Short-term care, detention or diagnostic centers for delinquent children (%)
People in Group quarters - Type of juvenile institution unknown (%)
People in Group quarters - Noninstitutionalized population (%)
People in Group quarters - College dormitories (includes college quarters off campus) (%)
People in Group quarters - Military quarters (%)
People in Group quarters - On base (%)
People in Group quarters - Barracks, unaccompanied personnel housing (UPH), (Enlisted/Officer), ;and similar group living quarters for military personnel (%)
People in Group quarters - Transient quarters for temporary residents (%)
People in Group quarters - Military ships (%)
People in Group quarters - Group homes (%)
People in Group quarters - Homes or halfway houses for drug/alcohol abuse (%)
People in Group quarters - Homes for the mentally ill (%)
People in Group quarters - Homes for the mentally retarded (%)
People in Group quarters - Homes for the physically handicapped (%)
People in Group quarters - Other group homes (%)
People in Group quarters - Religious group quarters (%)
People in Group quarters - Dormitories (%)
People in Group quarters - Agriculture workers' dormitories on farms (%)
People in Group quarters - Job Corps and vocational training facilities (%)
People in Group quarters - Other workers' dormitories (%)
People in Group quarters - Crews of maritime vessels (%)
People in Group quarters - Other nonhousehold living situations (%)
People in Group quarters - Other noninstitutional group quarters (%)
Residents speaking English at home (%)
Residents speaking English at home - Born in the United States (%)
Residents speaking English at home - Native, born elsewhere (%)
Residents speaking English at home - Foreign born (%)
Residents speaking Spanish at home (%)
Residents speaking Spanish at home - Born in the United States (%)
Residents speaking Spanish at home - Native, born elsewhere (%)
Residents speaking Spanish at home - Foreign born (%)
Residents speaking other language at home (%)
Residents speaking other language at home - Born in the United States (%)
Residents speaking other language at home - Native, born elsewhere (%)
Residents speaking other language at home - Foreign born (%)
Class of Workers - Employee of private company (%)
Class of Workers - Self-employed in own incorporated business (%)
Class of Workers - Private not-for-profit wage and salary workers (%)
Class of Workers - Local government workers (%)
Class of Workers - State government workers (%)
Class of Workers - Federal government workers (%)
Class of Workers - Self-employed workers in own not incorporated business and Unpaid family workers (%)
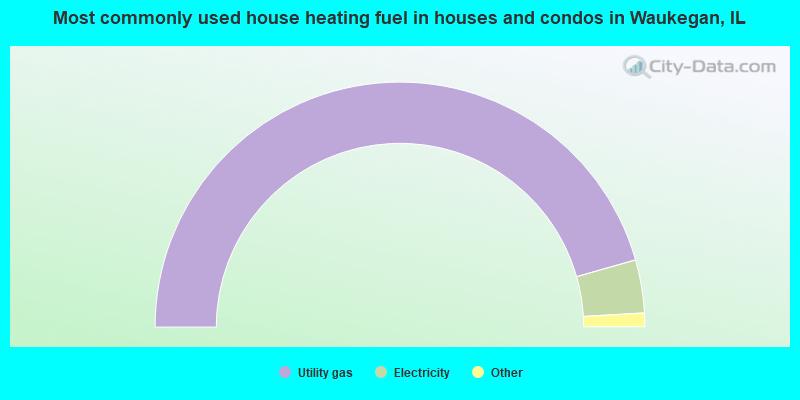
House heating fuel used in houses and condos - Utility gas (%)
House heating fuel used in houses and condos - Bottled, tank, or LP gas (%)
House heating fuel used in houses and condos - Electricity (%)
House heating fuel used in houses and condos - Fuel oil, kerosene, etc. (%)
House heating fuel used in houses and condos - Coal or coke (%)
House heating fuel used in houses and condos - Wood (%)
House heating fuel used in houses and condos - Solar energy (%)
House heating fuel used in houses and condos - Other fuel (%)
House heating fuel used in houses and condos - No fuel used (%)
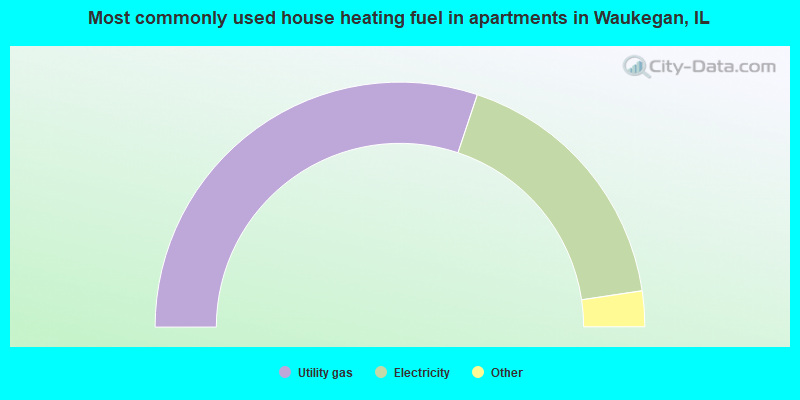
House heating fuel used in apartments - Utility gas (%)
House heating fuel used in apartments - Bottled, tank, or LP gas (%)
House heating fuel used in apartments - Electricity (%)
House heating fuel used in apartments - Fuel oil, kerosene, etc. (%)
House heating fuel used in apartments - Coal or coke (%)
House heating fuel used in apartments - Wood (%)
House heating fuel used in apartments - Solar energy (%)
House heating fuel used in apartments - Other fuel (%)
House heating fuel used in apartments - No fuel used (%)
Armed forces status - In Armed Forces (%)
Armed forces status - Civilian (%)
Armed forces status - Civilian - Veteran (%)
Armed forces status - Civilian - Nonveteran (%)
Fatal accidents locations in years 2005-2021
Fatal accidents locations in 2005
Fatal accidents locations in 2006
Fatal accidents locations in 2007
Fatal accidents locations in 2008
Fatal accidents locations in 2009
Fatal accidents locations in 2010
Fatal accidents locations in 2011
Fatal accidents locations in 2012
Fatal accidents locations in 2013
Fatal accidents locations in 2014
Fatal accidents locations in 2015
Fatal accidents locations in 2016
Fatal accidents locations in 2017
Fatal accidents locations in 2018
Fatal accidents locations in 2019
Fatal accidents locations in 2020
Fatal accidents locations in 2021
Alcohol use - People drinking some alcohol every month (%)
Alcohol use - People not drinking at all (%)
Alcohol use - Average days/month drinking alcohol
Alcohol use - Average drinks/week
Alcohol use - Average days/year people drink much
Audiometry - Average condition of hearing (%)
Audiometry - People that can hear a whisper from across a quiet room (%)
Audiometry - People that can hear normal voice from across a quiet room (%)
Audiometry - Ears ringing, roaring, buzzing (%)
Audiometry - Had a job exposure to loud noise (%)
Audiometry - Had off-work exposure to loud noise (%)
Blood Pressure & Cholesterol - Has high blood pressure (%)
Blood Pressure & Cholesterol - Checking blood pressure at home (%)
Blood Pressure & Cholesterol - Frequently checking blood cholesterol (%)
Blood Pressure & Cholesterol - Has high cholesterol level (%)
Consumer Behavior - Money monthly spent on food at supermarket/grocery store
Consumer Behavior - Money monthly spent on food at other stores
Consumer Behavior - Money monthly spent on eating out
Consumer Behavior - Money monthly spent on carryout/delivered foods
Consumer Behavior - Income spent on food at supermarket/grocery store (%)
Consumer Behavior - Income spent on food at other stores (%)
Consumer Behavior - Income spent on eating out (%)
Consumer Behavior - Income spent on carryout/delivered foods (%)
Current Health Status - General health condition (%)
Current Health Status - Blood donors (%)
Current Health Status - Has blood ever tested for HIV virus (%)
Current Health Status - Left-handed people (%)
Dermatology - People using sunscreen (%)
Diabetes - Diabetics (%)
Diabetes - Had a blood test for high blood sugar (%)
Diabetes - People taking insulin (%)
Diet Behavior & Nutrition - Diet health (%)
Diet Behavior & Nutrition - Milk product consumption (# of products/month)
Diet Behavior & Nutrition - Meals not home prepared (#/week)
Diet Behavior & Nutrition - Meals from fast food or pizza place (#/week)
Diet Behavior & Nutrition - Ready-to-eat foods (#/month)
Diet Behavior & Nutrition - Frozen meals/pizza (#/month)
Drug Use - People that ever used marijuana or hashish (%)
Drug Use - Ever used hard drugs (%)
Drug Use - Ever used any form of cocaine (%)
Drug Use - Ever used heroin (%)
Drug Use - Ever used methamphetamine (%)
Health Insurance - People covered by health insurance (%)
Kidney Conditions-Urology - Avg. # of times urinating at night
Medical Conditions - People with asthma (%)
Medical Conditions - People with anemia (%)
Medical Conditions - People with psoriasis (%)
Medical Conditions - People with overweight (%)
Medical Conditions - Elderly people having difficulties in thinking or remembering (%)
Medical Conditions - People who ever received blood transfusion (%)
Medical Conditions - People having trouble seeing even with glass/contacts (%)
Medical Conditions - People with arthritis (%)
Medical Conditions - People with gout (%)
Medical Conditions - People with congestive heart failure (%)
Medical Conditions - People with coronary heart disease (%)
Medical Conditions - People with angina pectoris (%)
Medical Conditions - People who ever had heart attack (%)
Medical Conditions - People who ever had stroke (%)
Medical Conditions - People with emphysema (%)
Medical Conditions - People with thyroid problem (%)
Medical Conditions - People with chronic bronchitis (%)
Medical Conditions - People with any liver condition (%)
Medical Conditions - People who ever had cancer or malignancy (%)
Mental Health - People who have little interest in doing things (%)
Mental Health - People feeling down, depressed, or hopeless (%)
Mental Health - People who have trouble sleeping or sleeping too much (%)
Mental Health - People feeling tired or having little energy (%)
Mental Health - People with poor appetite or overeating (%)
Mental Health - People feeling bad about themself (%)
Mental Health - People who have trouble concentrating on things (%)
Mental Health - People moving or speaking slowly or too fast (%)
Mental Health - People having thoughts they would be better off dead (%)
Oral Health - Average years since last visit a dentist
Oral Health - People embarrassed because of mouth (%)
Oral Health - People with gum disease (%)
Oral Health - General health of teeth and gums (%)
Oral Health - Average days a week using dental floss/device
Oral Health - Average days a week using mouthwash for dental problem
Oral Health - Average number of teeth
Pesticide Use - Households using pesticides to control insects (%)
Pesticide Use - Households using pesticides to kill weeds (%)
Physical Activity - People doing vigorous-intensity work activities (%)
Physical Activity - People doing moderate-intensity work activities (%)
Physical Activity - People walking or bicycling (%)
Physical Activity - People doing vigorous-intensity recreational activities (%)
Physical Activity - People doing moderate-intensity recreational activities (%)
Physical Activity - Average hours a day doing sedentary activities
Physical Activity - Average hours a day watching TV or videos
Physical Activity - Average hours a day using computer
Physical Functioning - People having limitations keeping them from working (%)
Physical Functioning - People limited in amount of work they can do (%)
Physical Functioning - People that need special equipment to walk (%)
Physical Functioning - People experiencing confusion/memory problems (%)
Physical Functioning - People requiring special healthcare equipment (%)
Prescription Medications - Average number of prescription medicines taking
Preventive Aspirin Use - Adults 40+ taking low-dose aspirin (%)
Reproductive Health - Vaginal deliveries (%)
Reproductive Health - Cesarean deliveries (%)
Reproductive Health - Deliveries resulted in a live birth (%)
Reproductive Health - Pregnancies resulted in a delivery (%)
Reproductive Health - Women breastfeeding newborns (%)
Reproductive Health - Women that had a hysterectomy (%)
Reproductive Health - Women that had both ovaries removed (%)
Reproductive Health - Women that have ever taken birth control pills (%)
Reproductive Health - Women taking birth control pills (%)
Reproductive Health - Women that have ever used Depo-Provera or injectables (%)
Reproductive Health - Women that have ever used female hormones (%)
Sexual Behavior - People 18+ that ever had sex (vaginal, anal, or oral) (%)
Sexual Behavior - Males 18+ that ever had vaginal sex with a woman (%)
Sexual Behavior - Males 18+ that ever performed oral sex on a woman (%)
Sexual Behavior - Males 18+ that ever had anal sex with a woman (%)
Sexual Behavior - Males 18+ that ever had any sex with a man (%)
Sexual Behavior - Females 18+ that ever had vaginal sex with a man (%)
Sexual Behavior - Females 18+ that ever performed oral sex on a man (%)
Sexual Behavior - Females 18+ that ever had anal sex with a man (%)
Sexual Behavior - Females 18+ that ever had any kind of sex with a woman (%)
Sexual Behavior - Average age people first had sex
Sexual Behavior - Average number of female sex partners in lifetime (males 18+)
Sexual Behavior - Average number of female vaginal sex partners in lifetime (males 18+)
Sexual Behavior - Average age people first performed oral sex on a woman (18+)
Sexual Behavior - Average number of woman performed oral sex on in lifetime (18+)
Sexual Behavior - Average number of male sex partners in lifetime (males 18+)
Sexual Behavior - Average number of male anal sex partners in lifetime (males 18+)
Sexual Behavior - Average age people first performed oral sex on a man (18+)
Sexual Behavior - Average number of male oral sex partners in lifetime (18+)
Sexual Behavior - People using protection when performing oral sex (%)
Sexual Behavior - Average number of times people have vaginal or anal sex a year
Sexual Behavior - People having sex without condom (%)
Sexual Behavior - Average number of male sex partners in lifetime (females 18+)
Sexual Behavior - Average number of male vaginal sex partners in lifetime (females 18+)
Sexual Behavior - Average number of female sex partners in lifetime (females 18+)
Sexual Behavior - Circumcised males 18+ (%)
Sleep Disorders - Average hours sleeping at night
Sleep Disorders - People that has trouble sleeping (%)
Smoking-Cigarette Use - People smoking cigarettes (%)
Taste & Smell - People 40+ having problems with smell (%)
Taste & Smell - People 40+ having problems with taste (%)
Taste & Smell - People 40+ that ever had wisdom teeth removed (%)
Taste & Smell - People 40+ that ever had tonsils teeth removed (%)
Taste & Smell - People 40+ that ever had a loss of consciousness because of a head injury (%)
Taste & Smell - People 40+ that ever had a broken nose or other serious injury to face or skull (%)
Taste & Smell - People 40+ that ever had two or more sinus infections (%)
Weight - Average height (inches)
Weight - Average weight (pounds)
Weight - Average BMI
Weight - People that are obese (%)
Weight - People that ever were obese (%)
Weight - People trying to lose weight (%)
The City-Data.com crime index weighs serious crimes and violent crimes more heavily. Higher means more crime, U.S. average is 246.1. It adjusts for the number of visitors and daily workers commuting into cities.
- means the value is smaller than the state average.
- means the value is about the same as the state average.
- means the value is bigger than the state average.
- means the value is much bigger than the state average.
Crime rate in Waukegan detailed stats: murders, rapes, robberies, assaults, burglaries, thefts, arson Officers per 1,000 residents here:
1.70Illinois average:
3.04
Latest news from Waukegan, IL collected exclusively by city-data.com from local newspapers, TV, and radio stations
Ancestries: American (3.2%), German (2.1%), Irish (1.3%), African (1.2%), English (1.2%), Belizean (1.2%).
Current Local Time:
Incorporated on 05/03/1890
Land area: 23.0 square miles.
Population density: 3,823 people per square mile (average).
26,651 residents are foreign born (22.5% Latin America , 5.5% Asia ).
This city:
30.0%Illinois:
14.1%
Median real estate property taxes paid for housing units with mortgages in 2022: $4,681 (2.7%)Median real estate property taxes paid for housing units with no mortgage in 2022: $4,165 (2.4%)
Nearest city with pop. 200,000+: Chicago, IL
Nearest cities:
Latitude: 42.37 N, Longitude: 87.86 W
Daytime population change due to commuting: -8,292 (-9.6%)Workers who live and work in this city: 13,092 (31.5%)
Property values in Waukegan, IL
Single-family new house construction building permits:
2022: 2 buildings , average cost: $176,0002021: 3 buildings , average cost: $127,0002020: 2 buildings , average cost: $154,5002019: 7 buildings , average cost: $145,0002018: 17 buildings , average cost: $166,3002017: 3 buildings , average cost: $187,4002016: 5 buildings , average cost: $210,6002015: 28 buildings , average cost: $171,9002014: 27 buildings , average cost: $171,9002013: 29 buildings , average cost: $171,9002012: 21 buildings , average cost: $171,9002011: 16 buildings , average cost: $171,9002010: 17 buildings , average cost: $172,0002009: 15 buildings , average cost: $171,4002008: 18 buildings , average cost: $174,0002007: 51 buildings , average cost: $154,2002006: 66 buildings , average cost: $189,6002005: 217 buildings , average cost: $174,6002004: 76 buildings , average cost: $203,3002003: 85 buildings , average cost: $157,3002002: 146 buildings , average cost: $127,3002001: 121 buildings , average cost: $140,8002000: 162 buildings , average cost: $124,8001999: 142 buildings , average cost: $137,3001998: 218 buildings , average cost: $136,4001997: 326 buildings , average cost: $127,200Unemployment in December 2023:
Population change in the 1990s: +17,807 (+25.4%).
Most common occupations in Waukegan, IL (%)
Both Males Females
Building and grounds cleaning and maintenance occupations (8.2%)
Cooks and food preparation workers (7.2%)
Other production occupations, including supervisors (5.9%)
Laborers and material movers, hand (5.8%)
Assemblers and fabricators (4.4%)
Other management occupations, except farmers and farm managers (4.0%)
Cashiers (4.0%)
Building and grounds cleaning and maintenance occupations (10.4%)
Laborers and material movers, hand (7.7%)
Cooks and food preparation workers (7.3%)
Other production occupations, including supervisors (5.3%)
Other management occupations, except farmers and farm managers (4.4%)
Material recording, scheduling, dispatching, and distributing workers (4.1%)
Driver/sales workers and truck drivers (3.7%)
Assemblers and fabricators (7.3%)
Cooks and food preparation workers (7.2%)
Other production occupations, including supervisors (6.6%)
Building and grounds cleaning and maintenance occupations (5.7%)
Cashiers (5.1%)
Information and record clerks, except customer service representatives (3.9%)
Other office and administrative support workers, including supervisors (3.9%)
Tornado activity:
Waukegan-area historical tornado activity is slightly below Illinois state average. It is 24% greater than the overall U.S. average.
On 9/28/1972, a category F4 (max. wind speeds 207-260 mph) tornado 1.6 miles away from the Waukegan city center injured 20 people and caused between $500,000 and $5,000,000 in damages.
On 4/21/1967, a category F4 tornado 16.1 miles away from the city center killed one person and injured 100 people and caused between $500,000 and $5,000,000 in damages.
Earthquake activity:
Waukegan-area historical earthquake activity is significantly above Illinois state average. It is 26% greater than the overall U.S. average. On 4/18/2008 at 09:36:59, a magnitude 5.4 (5.1 MB, 4.8 MS, 5.4 MW, 5.2 MW, Class: Moderate, Intensity: VI - VII) earthquake occurred 271.2 miles away from the city center On 6/10/1987 at 23:48:54, a magnitude 5.1 (4.9 MB, 4.4 MS, 4.6 MS, 5.1 LG) earthquake occurred 245.6 miles away from the city center On 4/18/2008 at 09:36:59, a magnitude 5.2 (5.2 MW, Depth: 8.9 mi) earthquake occurred 271.2 miles away from Waukegan center On 6/28/2004 at 06:10:52, a magnitude 4.2 (4.2 MW, Depth: 6.2 mi, Class: Light, Intensity: IV - V) earthquake occurred 82.7 miles away from Waukegan center On 2/10/2010 at 09:59:35, a magnitude 3.8 (3.8 MW, Depth: 6.2 mi, Class: Light, Intensity: II - III) earthquake occurred 42.9 miles away from the city center On 5/2/2015 at 16:23:07, a magnitude 4.2 (4.2 MW, Depth: 2.8 mi) earthquake occurred 124.8 miles away from the city center Magnitude types: regional Lg-wave magnitude (LG), body-wave magnitude (MB), surface-wave magnitude (MS), moment magnitude (MW) Natural disasters: The number of natural disasters in Lake County (16) is near the US average (15).Major Disasters (Presidential) Declared: 10Emergencies Declared: 5Storms: 9, Floods: 7, Tornadoes: 3, Snows: 2, Snowstorms: 2, Winter Storms: 2, Blizzard: 1, Hurricane: 1, Wind: 1, Other: 1 (Note: some incidents may be assigned to more than one category). Main business address for: NORTHERN STATES FINANCIAL CORP /DE/ STATE COMMERCIAL BANKS ), WMS INDUSTRIES INC /DE/ MISCELLANEOUS MANUFACTURING INDUSTRIES ).
Hospitals in Waukegan: PINE TERRACE (2017 NORTH PINE STREET) STAR HOSP OF VISTA HEALTH (99 GREENWOOD AVENUE) VISTA MEDICAL CENTER EAST (Voluntary non-profit - Other, 1324 NORTH SHERIDAN ROAD) VISTA MEDICAL CENTER WEST (Voluntary non-profit - Church, 2615 WASHINGTON ST) WAUKEGAN TERRACE (860 SOUTH LEWIS AVENUE) Nursing Homes in Waukegan: BAYSIDE TERRACE (1100 SOUTH LEWIS AVENUE) GLENLAKE TER NRSG AND REHAB CENTER (2222 WEST 14TH STREET) LAKE PARK CENTER (919 WASHINGTON PARK) NORTH SHORE TERRACE (2222 W 14TH ST) PAVILION OF WAUKEGAN (2217 WASHINGTON STREET) TERRACE NURSING HOME,THE (1615 SUNSET AVENUE) WAUKEGAN HEALTH CARE INC (919 WASHINGTON PARK) WAUKEGAN PAVILION NURSING HOME (2217 WASHINGTON ST) Dialysis Facilities in Waukegan: DSI - WAUKEGAN - HOME PROGRAM (1616 GRAND AVE STE F) DSI - WAUKEGAN RENAL CENTER (1616 GRAND AVE STE C) FMC - WAUKEGAN HARBOR (110 N. WEST STREET) Home Health Centers in Waukegan: HOME HLTH SERVICES OF LAKE CO HLTH DEP (3010 GRAND AVENUE) STAR HOME HEALTH OF WAUKEGAN (2645 WASHINGTON STREET)
College/University in Waukegan: State Career College Full-time enrollment: 94; Location: 2770 W. Grand Avenue; Private, for-profit; Website: www.statecareercollege.edu)
Colleges/universities with over 2000 students nearest to Waukegan:
College of Lake County (about 8 miles; Grayslake, IL ; Full-time enrollment: 11,041)
Gateway Technical College (about 17 miles; Kenosha, WI ; FT enrollment: 5,089)
Carthage College (about 18 miles; Kenosha, WI ; FT enrollment: 3,130)
University of Wisconsin-Parkside (about 19 miles; Kenosha, WI ; FT enrollment: 3,843)
Oakton Community College (about 22 miles; Des Plaines, IL ; FT enrollment: 7,271)
Harper College (about 23 miles; Palatine, IL ; FT enrollment: 10,800)
Computer Systems Institute (about 24 miles; Skokie, IL ; FT enrollment: 2,311)
Public high school in Waukegan:
Private high schools in Waukegan: ST MARTIN DE PORRES HIGH SCHOOL Students: 242, Location: 515 S MARTIN LUTHER KING JR AVE, Grades: 9-12)
LAKE COUNTY BAPTIST SCHOOL Students: 186, Location: 1550 W YORKHOUSE RD, Grades: PK-12)
Biggest public elementary/middle schools in Waukegan: THOMAS JEFFERSON MIDDLE SCHOOL Students: 850, Location: 600 S LEWIS AVE, Grades: 6-8)ROBERT E ABBOTT MIDDLE SCHOOL Students: 848, Location: 1319 WASHINGTON ST, Grades: 6-8)MIGUEL JUAREZ MIDDLE SCHOOL Students: 744, Location: 201 N BUTRICK ST, Grades: 6-8)CLEARVIEW ELEM SCHOOL Students: 722, Location: 1700 DELAWARE RD, Grades: PK-5)JACK BENNY MIDDLE SCHOOL Students: 694, Location: 1401 MONTESANO AVE, Grades: 6-8)DANIEL WEBSTER MIDDLE SCHOOL Students: 687, Location: 930 NEW YORK ST, Grades: 6-8)GLENWOOD ELEMENTARY SCHOOL Students: 628, Location: 2500 NORTHMOOR AVE, Grades: PK-5)LITTLE FORT ELEM SCHOOL Students: 600, Location: 1775 BLANCHARD RD, Grades: PK-5)LYON MAGNET ELEMENTARY SCHOOL Students: 563, Location: 800 S ELMWOOD AVE, Grades: KG-5)WASHINGTON ELEM SCHOOL Students: 560, Location: 110 S ORCHARD AVE, Grades: PK-5)Private elementary/middle schools in Waukegan: ACADEMY OF OUR LADY Students: 290, Location: 510 GRAND AVE, Grades: PK-8)
ST ANASTASIA SCHOOL Students: 282, Location: 629 W GLEN FLORA AVE, Grades: PK-8)
LIONS MATHEMATICS & SCIENCE CHRISTIAN ACADEMY Students: 52, Location: 1011 PORTER ST, Grades: PK-5)
SHELIA DANIELS CHRISTIAN ACADEMY Students: 47, Location: 422 10TH ST, Grades: PK-5)
IMMANUEL EVANGELICAL SCHOOL Students: 43, Location: 1310 N FROLIC AVE, Grades: KG-8)
See full list of schools located in Waukegan Library in Waukegan: WAUKEGAN PUBLIC LIBRARY Operating income: $4,129,377; Location: 128 NORTH COUNTY STREET; 252,427 books ; 554 e-books ; 15,613 audio materials ; 15,477 video materials ; 8 local licensed databases ; 14 state licensed databases ; 152 print serial subscriptions )
User-submitted facts and corrections:
James Grippando, author of 10 bestselling novels of suspense that are sold worldwide in over 20 languages, was also born in Waukegan, Illinois (Jan. 27 1958, St. Therese Hospital). He grew up in Antioch, Illinois
St. Therese Hospital is closed.
Notable locations in Waukegan: (A) , Glen Flora Country Club (B) , Janet Morrison Picnic Center (C) , Waukegan Sewage Treatment Plant (D) , City of Waukegan Water Treatment Plant (E) , Orchard Hills Golf Course and Country Club (F) , Golf Links (G) , Midlane Golf Course (H) , Waukegan Fire Department Station 2 (I) , Beach Park Fire Department (J) , Waukegan Fire Department Station 4 (K) , Waukegan Public Library (L) , Waukegan Fire Department Station 3 (M) , Waukegan Fire Department Station 1 (N) , Waukegan City Hall (O) , Lake County Courthouse (P) , A - Tec Ambulance (Q) , American Legion Homer Dahringer Post (R) , Superior Air - Ground Ambulance Service (S) , Kiley Developmental Center (T) . Display/hide their locations on the map
Shopping Centers: (1) , Lakehurst Shopping Center (2) . Display/hide their locations on the map
Main business address in Waukegan include: (A) , WMS INDUSTRIES INC /DE/ (B) . Display/hide their locations on the map
Churches in Waukegan include: (A) , Antioch Baptist Church (B) , Armenian Evangelical Church (C) , Central Christian Church (D) , Christ Episcopal Church (E) , Church of God in Christ (F) , Church of the Foursquare Gospel (G) , First Baptist Church (H) , First Christian Church (I) . Display/hide their locations on the map
Cemeteries: (1) , Am Echod Jewish Cemetery (2) , Saint Marys Cemetery (3) . Display/hide their locations on the map
River: (A) . Display/hide its location on the map
Parks in Waukegan include: (1) , Roosevelt Park (2) , Grand Avenue Park (3) , Armory Park (4) , Bedrosian Park (5) , Clark Park (6) , Lyons Woods Forest Preserve (7) , Victory Park (8) , Kocal Field (9) . Display/hide their locations on the map
Tourist attractions: (1) , Adult Learning and Technology Center (Cultural Attractions- Events- & Facilities; 2416 Washington Street) (2) , Midlane Golf Resort (Water Parks & Slides; 4555 Yorkhouse Road) (3) , Daves Amusement CO (Amusement & Theme Parks; 750 North Pioneer Road Apt 301) (4) , Belvidere Arcade (Amusement & Theme Parks; 2147 Belvidere Road) (5) , Fun Harbour Family Amusement Center (Amusement & Theme Parks; 651 Lakehurst Road) (6) . Display/hide their approximate locations on the map
Hotels: (1) , Candlewood Hotel (Ddddddd) (2) , Comfort Inn (3031 Belvidere Road) (3) , Bel-Lane Motel (3100 Belvidere Road) (4) , Courtyard by Marriott - Waukegan (800 Lakehurst Road) (5) , Belvidere-Slumberland Motel (3030 Belvidere Road) (6) , Crossland - Chicago (1177 S Northpoint Blvd) (7) , Days Inn (3633 N Lewis Ave) (8) , Best Western of Waukegan (411 South Greenbay Road) (9) . Display/hide their approximate locations on the map
Courts: (1) , Lake County - Arbitration Ctr- Waukegan- 19th Judical Circuit- Court Administr (20 South Martin Luther King J) (2) , Lake County - Waukegan- Circuit Court Clerk- Traffic Branch Courts- Munde (18945 West Il Route 60) (3) , Lake County - Waukegan- Circuit Court Clerk- Traffic Branch Courts- Lakeh (430 Lakehurst Road) (4) , Lake County - 19th Judical Circuit- Waukegan- Court Administrator- 19Th Judicial Cir (18 North County Street) (5) , Lake County - Waukegan- Circuit Court Clerk- Traffic Branch Courts- Grays (1854 Belvidere Street) (6) , Lake County - Admin Ofc- Waukegan- Administration Office- Circuit Court C (18 North County Street) (7) . Display/hide their approximate locations on the map
Birthplace of: Ray Bradbury - (born 1920), Science Fiction author, Kim Stanley Robinson - (born 1952), science fiction author, Bob O'Farrell - Baseball player, Ted Musgrave - Stock car racing driver, Bill Krueger - Baseball player, Terry Link - Politician, Gary Bennett - 2005 Major League Baseball player (Washington Nationals, born : Apr 17, 1972), Gary Bennett (baseball) - Baseball player, James Grippando - Novelist, Brothers Strause - Music video director.
Lake County has a predicted average indoor radon screening level between 2 and 4 pCi/L (pico curies per liter) - Moderate Potential Drinking water stations with addresses in Waukegan and their reported violations in the past:
MILBURN CHURCH EARLY LRNG CNTR (Population served: 440, Groundwater):
Past health violations:
MCL, Acute (TCR) - Between JAN-2007 and DEC-2007, Contaminant: Coliform. Follow-up actions: St Compliance achieved (FEB-27-2008)
Population served: 300, Groundwater):
Past monitoring violations:
One routine major monitoring violation
Population served: 200, Groundwater):
Past health violations:
MCL, Acute (TCR) - Between JAN-2007 and DEC-2007, Contaminant: Coliform. Follow-up actions: St Compliance achieved (FEB-04-2008)
Population served: 100, Groundwater):
Past health violations:
MCL, Monthly (TCR) - Between JAN-2008 and DEC-2008, Contaminant: Coliform. Follow-up actions: St Violation/Reminder Notice (DEC-17-2008), St Compliance achieved (FEB-17-2009)
Population served: 100, Groundwater):
Past health violations:
MCL, Monthly (TCR) - Between JAN-2007 and DEC-2007, Contaminant: Coliform. Follow-up actions: St Violation/Reminder Notice (APR-30-2007)
Population served: 100, Groundwater):
Past monitoring violations:
One regular monitoring violation
Population served: 85, Groundwater):
Past health violations:
MCL, Monthly (TCR) - Between JAN-2009 and DEC-2009, Contaminant: Coliform. Follow-up actions: St Compliance achieved (JUL-28-2009), St Violation/Reminder Notice (SEP-18-2009)
Past monitoring violations:
80 regular monitoring violations
Population served: 55, Groundwater):
Past monitoring violations:
Monitoring, Repeat Major (TCR) - Between JAN-2006 and DEC-2006, Contaminant: Coliform (TCR). Follow-up actions: St Compliance achieved (NOV-08-2006)
Drinking water stations with addresses in Waukegan that have no violations reported:
TEMPEL FARMS (Population served: 1,000, Primary Water Source Type: Groundwater)
ST BEDE CHURCH (Population served: 850, Primary Water Source Type: Groundwater)
SAINT PATRICKS CHURCH (Population served: 800, Primary Water Source Type: Groundwater)
TRI-STAR GAS & FOOD INC/CITGO (Population served: 798, Primary Water Source Type: Groundwater)
NORTHBROOKS SPORTS CLUB (Population served: 750, Primary Water Source Type: Groundwater)
MARATHON (112888) (Population served: 650, Primary Water Source Type: Groundwater)
LONG GROVE COMMUNITY CHURCH (Population served: 600, Primary Water Source Type: Groundwater)
FRATELLOS HOT DOGS (Population served: 600, Primary Water Source Type: Groundwater)
TEMPLE CHAI (Population served: 600, Primary Water Source Type: Groundwater)
NORTHPOINT COMMUNITY CHURCH (Population served: 550, Primary Water Source Type: Groundwater)
Average household size: This city:
3.1 peopleIllinois:
2.6 people
Percentage of family households: This city:
71.4%Whole state:
65.8%
Percentage of households with unmarried partners: This city:
8.2%Whole state:
6.3%
Likely homosexual households (counted as self-reported same-sex unmarried-partner households)
Lesbian couples: 0.4% of all households Gay men: 0.3% of all households
People in group quarters in Waukegan in 2010:
842 people in nursing facilities/skilled-nursing facilities
701 people in local jails and other municipal confinement facilities
250 people in group homes intended for adults
118 people in residential treatment centers for adults
64 people in emergency and transitional shelters (with sleeping facilities) for people experiencing homelessness
48 people in other noninstitutional facilities
24 people in group homes for juveniles (non-correctional)
19 people in residential treatment centers for juveniles (non-correctional)
11 people in maritime/merchant vessels
People in group quarters in Waukegan in 2000:
637 people in local jails and other confinement facilities (including police lockups)
470 people in other noninstitutional group quarters
353 people in nursing homes
237 people in other nonhousehold living situations
182 people in other group homes
121 people in homes or halfway houses for drug/alcohol abuse
38 people in college dormitories (includes college quarters off campus)
22 people in homes for the mentally ill
14 people in halfway houses
7 people in homes for abused, dependent, and neglected children
5 people in homes for the mentally retarded
4 people in religious group quarters
Banks with most branches in Waukegan (2011 data):
First Midwest Bank: Lakehurst Branch, Waukegan Main Branch, Northside Facility. Info updated 2011/12/22: Bank assets: $7,848.0 mil, Deposits: $6,529.2 mil, headquarters in Itasca, IL, positive income , Commercial Lending Specialization, 100 total offices , Holding Company: First Midwest Bancorp, Inc.
Norstates Bank: at 1601 North Lewis Avenue, Madison At County Branch, Westside Facility. Info updated 2008/09/29: Bank assets: $463.3 mil, Deposits: $399.4 mil, local headquarters , negative income in the last year , Commercial Lending Specialization, 8 total offices , Holding Company: Northern States Financial Corporation
TCF National Bank: North Lewis Jewel Branch #2255, Waukegan Branch #2080, North Green Bay Jewel Branch #2253. Info updated 2009/11/23: Bank assets: $19,007.0 mil, Deposits: $12,377.0 mil, headquarters in Sioux Falls, SD, positive income , Commercial Lending Specialization, 441 total offices , Holding Company: Tcf Financial Corporation
Fifth Third Bank: Waukegan Branch, Waukegan Sunset Motor Bank Branch, 800 South Waukegan Bc. Info updated 2009/10/05: Bank assets: $114,540.4 mil, Deposits: $89,689.1 mil, headquarters in Cincinnati, OH, positive income , Commercial Lending Specialization, 1378 total offices , Holding Company: Fifth Third Bancorp
Guaranty Bank: Fountain Square Branch at 3900 Fountain Square Place, branch established on 2006/01/19; Cub Foods Waukegan Branch at 1700 North Lewis, branch established on 2001/03/23. Info updated 2011/07/21: Bank assets: $1,179.1 mil, Deposits: $1,102.7 mil, headquarters in Milwaukee, WI, negative income in the last year , Mortgage Lending Specialization, 166 total offices
North Shore Trust and Savings: Waukegan Branch at 1233 N. Green Bay Road, branch established on 1996/02/20; North Shore Trust And Savings at 700 S Lewis Ave, branch established on 1921/01/01. Info updated 2011/07/21: Bank assets: $261.4 mil, Deposits: $216.2 mil, local headquarters , positive income , Mortgage Lending Specialization, 3 total offices
Waukegan Savings Bank: West Branch at 1075 N. Green Bay Road, branch established on 2004/07/01; at 1324 Golf Road, branch established on 1924/01/01. Info updated 2007/10/12: Bank assets: $88.6 mil, Deposits: $76.4 mil, local headquarters , negative income in the last year , Mortgage Lending Specialization, 2 total offices
PNC Bank, National Association: Waukegan Branch at 1802 Belvidere Street, branch established on 2007/12/10. Info updated 2012/03/20: Bank assets: $263,309.6 mil, Deposits: $197,343.0 mil, headquarters in Wilmington, DE, positive income , Commercial Lending Specialization, 3085 total offices , Holding Company: Pnc Financial Services Group, Inc., The
Bank of America, National Association: Waukegan-Fountain Square Branch at 920 South Waukegan Road, branch established on 2009/12/14. Info updated 2009/11/18: Bank assets: $1,451,969.3 mil, Deposits: $1,077,176.8 mil, headquarters in Charlotte, NC, positive income , 5782 total offices , Holding Company: Bank Of America Corporation
4 other banks with 4 local branches
For population 15 years and over in Waukegan:
Never married: 43.6%Now married: 41.5%Separated: 1.8%Widowed: 4.2%Divorced: 8.9% For population 25 years and over in Waukegan:
High school or higher: 78.1%Bachelor's degree or higher: 20.3%Graduate or professional degree: 8.0%Unemployed: 9.7%Mean travel time to work (commute): 22.9 minutes
Education Gini index (Inequality in education) Here:
17.0Illinois average:
12.5
Religion statistics for Waukegan, IL (based on Lake County data)
Religion Adherents Congregations Catholic 211,380 29 Evangelical Protestant 84,501 211 Mainline Protestant 36,967 76 Other 33,822 62 Black Protestant 7,824 16 Orthodox 4,610 8 None 324,358 -
Source: Clifford Grammich, Kirk Hadaway, Richard Houseal, Dale E.Jones, Alexei Krindatch, Richie Stanley and Richard H.Taylor. 2012. 2010 U.S.Religion Census: Religious Congregations & Membership Study. Association of Statisticians of American Religious Bodies. Jones, Dale E., et al. 2002. Congregations and Membership in the United States 2000. Nashville, TN: Glenmary Research Center. Graphs represent county-level data
Food Environment Statistics: Number of grocery stores : 121Lake County :
1.71 / 10,000 pop.Illinois :
2.24 / 10,000 pop.
Number of supercenters and club stores : 4This county :
0.06 / 10,000 pop.State :
0.08 / 10,000 pop.
Number of convenience stores (no gas) : 38Lake County :
0.54 / 10,000 pop.Illinois :
0.75 / 10,000 pop.
Number of convenience stores (with gas) : 174Here :
2.46 / 10,000 pop.Illinois :
2.61 / 10,000 pop.
Number of full-service restaurants : 457Lake County :
6.47 / 10,000 pop.State :
6.86 / 10,000 pop.
Adult diabetes rate : Lake County :
7.3%State :
8.3%
Adult obesity rate : Lake County :
24.2%Illinois :
25.2%
Low-income preschool obesity rate : Lake County :
16.3%Illinois :
14.5%
Health and Nutrition: Healthy diet rate : Waukegan:
46.5%State:
49.5%
Average overall health of teeth and gums : Waukegan:
46.4%State:
47.2%
Average BMI : This city:
28.6Illinois:
28.6
People feeling badly about themselves : People not drinking alcohol at all : This city:
10.7%State:
10.8%
Average hours sleeping at night : This city:
6.8Illinois:
6.8
Overweight people : This city:
32.3%Illinois:
33.4%
General health condition : This city:
55.8%Illinois:
56.4%
Average condition of hearing : This city:
81.9%State:
79.9%
More about Health and Nutrition of Waukegan, IL Residents
Local government employment and payroll (March 2022)
Function
Full-time employees
Monthly full-time payroll
Average yearly full-time wage
Part-time employees
Monthly part-time payroll
Police Protection - Officers
140 $1,354,157 $116,071 0 $0 Firefighters
107 $1,040,708 $116,715 0 $0 Police - Other
46 $324,833 $84,739 0 $0 Other Government Administration
43 $242,397 $67,646 0 $0 Local Libraries
42 $224,124 $64,035 6 $9,089 Water Supply
31 $187,867 $72,723 0 $0 Other and Unallocable
30 $192,316 $76,926 0 $0 Financial Administration
20 $118,353 $71,012 1 $1,154 Streets and Highways
19 $121,306 $76,614 0 $0 Sewerage
6 $34,687 $69,374 0 $0 Fire - Other
5 $51,941 $124,658 0 $0 Housing and Community Development (Local)
3 $19,231 $76,924 0 $0
Totals for Government
492 $3,911,920 $95,413 7 $10,243
Waukegan government finances - Expenditure in 2021 (per resident):
Construction - Solid Waste Management: $7,441,000 ($84.58)
Regular Highways: $709,000 ($8.06)Current Operations - Police Protection: $39,299,000 ($446.70)
Local Fire Protection: $23,607,000 ($268.33)Regular Highways: $8,159,000 ($92.74)Water Utilities: $7,846,000 ($89.18)Solid Waste Management: $5,297,000 ($60.21)Libraries: $4,786,000 ($54.40)Central Staff Services: $4,674,000 ($53.13)Protective Inspection and Regulation - Other: $2,430,000 ($27.62)Housing and Community Development: $1,545,000 ($17.56)Parks and Recreation: $1,177,000 ($13.38)General - Interest on Debt: $9,655,000 ($109.75)
Other Capital Outlay - Regular Highways: $8,946,000 ($101.69)
Solid Waste Management: $1,820,000 ($20.69)Police Protection: $372,000 ($4.23)Central Staff Services: $224,000 ($2.55)Total Salaries and Wages: $43,185,000 ($490.87)
Waukegan government finances - Revenue in 2021 (per resident):
Charges - Other: $5,280,000 ($60.02)
Parking Facilities: $101,000 ($1.15)Parks and Recreation: $4,000 ($0.05)Federal Intergovernmental - Other: $3,983,000 ($45.27)
Highways: $2,935,000 ($33.36)Housing and Community Development: $1,138,000 ($12.94)Public Welfare: $133,000 ($1.51)Miscellaneous - Fines and Forfeits: $3,915,000 ($44.50)
General Revenue - Other: $1,390,000 ($15.80)Interest Earnings: $149,000 ($1.69)Revenue - Water Utilities: $15,297,000 ($173.88)
State Intergovernmental - General Local Government Support: $26,015,000 ($295.71)
Highways: $3,284,000 ($37.33)Other: $2,588,000 ($29.42)Tax - Property: $42,390,000 ($481.84)
Other Selective Sales: $8,834,000 ($100.41)General Sales and Gross Receipts: $7,634,000 ($86.77)Public Utilities Sales: $6,554,000 ($74.50)Other License: $6,222,000 ($70.72)
Waukegan government finances - Debt in 2021 (per resident):
Long Term Debt - Outstanding Unspecified Public Purpose: $460,956,000 ($5239.57)
Beginning Outstanding - Unspecified Public Purpose: $456,373,000 ($5187.47)Issue, Unspecified Public Purpose: $79,413,000 ($902.67)Retired Unspecified Public Purpose: $74,830,000 ($850.57)Beginning Outstanding - Public Debt for Private Purpose: $17,231,000 ($195.86)Outstanding Nonguaranteed - Industrial Revenue: $15,974,000 ($181.57)Retired Nonguaranteed - Public Debt for Private Purpose: $1,257,000 ($14.29)
Waukegan government finances - Cash and Securities in 2021 (per resident):
Other Funds - Cash and Securities: $114,663,000 ($1303.34)
Sinking Funds - Cash and Securities: $15,974,000 ($181.57)
6.06% of this county's 2021 resident taxpayers lived in other counties in 2020 ($110,528 average adjusted gross income )
Here:
6.06%Illinois average:
5.09%
0.03% of residents moved from foreign countries ($301 average AGI )Lake County:
0.03%Illinois average:
0.01%
Top counties from which taxpayers relocated into this county between 2020 and 2021:
6.71% of this county's 2020 resident taxpayers moved to other counties in 2021 ($163,220 average adjusted gross income )
Here:
6.71%Illinois average:
6.10%
0.04% of residents moved to foreign countries ($308 average AGI )Lake County:
0.04%Illinois average:
0.01%
Top counties to which taxpayers relocated from this county between 2020 and 2021:
Businesses in Waukegan, IL
Name Count Name Count
ALDI 1 Little Caesars Pizza 1 AT&T 1 Long John Silver's 1 Ace Hardware 2 Marriott 2 Advance Auto Parts 2 Mazda 1 AutoZone 2 McDonald's 5 Baskin-Robbins 4 Motel 6 1 Blockbuster 1 Nike 3 Brunswick Bowling & Billiards 1 Office Depot 1 Buffalo Wild Wings 1 OfficeMax 1 Burger King 3 Payless 2 CVS 2 Penske 1 Chipotle 1 Pizza Hut 2 Comfort Inn 1 Popeyes 1 Cricket Wireless 10 Quality 1 Crossland Economy Studios 1 Quiznos 1 Curves 1 RadioShack 2 Days Inn 1 Ramada 1 Dennys 1 Starbucks 2 Domino's Pizza 1 Subway 5 Dunkin Donuts 6 T-Mobile 3 Fashion Bug 1 Taco Bell 3 FedEx 10 Target 1 GNC 2 Toyota 1 GameStop 2 U-Haul 7 H&R Block 7 U.S. Cellular 2 Holiday Inn 2 UPS 9 Home Depot 1 Walgreens 3 IHOP 1 Walmart 1 Jewel-Osco 2 Wendy's 1 KFC 1 White Castle 1 Kmart 1 YMCA 2 LA Fitness 1
Strongest AM radio stations in Waukegan:
WKRS (1220 AM; 1 kW; WAUKEGAN, IL; Owner: NM LICENSING, LLC)
WTMJ (620 AM; 50 kW; MILWAUKEE, WI; Owner: JOURNAL BROADCAST CORPORATION)
WGN (720 AM; 50 kW; CHICAGO, IL; Owner: WGN CONTINENTAL BROADCASTING CO.)
WBBM (780 AM; 50 kW; CHICAGO, IL; Owner: INFINITY BROADCASTING OPERATIONS, INC.)
WSCR (670 AM; 50 kW; CHICAGO, IL; Owner: INFINITY BROADCASTING OPERATIONS, INC.)
WISN (1130 AM; 50 kW; MILWAUKEE, WI; Owner: CAPSTAR TX LIMITED PARTNERSHIP)
WMVP (1000 AM; 50 kW; CHICAGO, IL; Owner: ABC, INC.)
WLS (890 AM; 50 kW; CHICAGO, IL; Owner: WLS, INC.)
WKTA (1330 AM; 5 kW; EVANSTON, IL; Owner: POLNET COMMUNICATIONS, LTD.)
WYLL (1160 AM; 50 kW; CHICAGO, IL; Owner: SCA LICENSE CORPORATION)
WVIV (1200 AM; 20 kW; CHICAGO, IL; Owner: WLXX-AM LICENSE CORP.)
WCSN (820 AM; 5 kW; CHICAGO, IL; Owner: WYPA, INC.)
WNVR (1030 AM; 5 kW; VERNON HILLS, IL; Owner: POLNET COMMUNICATIONS, LTD.)
Strongest FM radio stations in Waukegan:
WXLC (102.3 FM; WAUKEGAN, IL; Owner: NM LICENSING, LLC)
WWDV (96.9 FM; ZION, IL; Owner: BONNEVILLE HOLDING COMPANY)
WCKG (105.9 FM; ELMWOOD PARK, IL; Owner: INFINITY HOLDINGS CORPORATION OF ORLANDO)
WLIT-FM (93.9 FM; CHICAGO, IL; Owner: AMFM RADIO LICENSES, L.L.C.)
WJMK (104.3 FM; CHICAGO, IL; Owner: INFINITY BROADCASTING CORP. OF ILLINOIS)
WNUA (95.5 FM; CHICAGO, IL; Owner: AMFM RADIO LICENSES, L.L.C.)
WGCI-FM (107.5 FM; CHICAGO, IL; Owner: AMFM RADIO LICENSES, L.L.C.)
WIIL (95.1 FM; KENOSHA, WI; Owner: NM LICENSING, LLC)
WTMX (101.9 FM; SKOKIE, IL; Owner: BONNEVILLE HOLDING COMPANY)
WBBM-FM (96.3 FM; CHICAGO, IL; Owner: INFINITY BROADCASTING OPERATIONS, INC.)
WKSC-FM (103.5 FM; CHICAGO, IL; Owner: AMFM RADIO LICENSES, L.L.C.)
WFMT (98.7 FM; CHICAGO, IL; Owner: WINDOW TO THE WORLD COMMUNICATIONS)
WZZN (94.7 FM; CHICAGO, IL; Owner: ABC CHICAGO FM RADIO,INC.)
WBEZ (91.5 FM; CHICAGO, IL; Owner: THE WBEZ ALLIANCE, INC.)
WKQX (101.1 FM; CHICAGO, IL; Owner: EMMIS RADIO LICENSE CORPORATION)
WLUP-FM (97.9 FM; CHICAGO, IL; Owner: BONNEVILLE HOLDING COMPANY)
WNND (100.3 FM; CHICAGO, IL; Owner: BONNEVILLE HOLDING COMPANY)
WOJO (105.1 FM; EVANSTON, IL; Owner: TICHENOR LICENSE CORPORATION ("TLC"))
WUSN (99.5 FM; CHICAGO, IL; Owner: INFINITY BROADCASTING CORPORATION OF CHICAGO)
WVAZ (102.7 FM; OAK PARK, IL; Owner: AMFM RADIO LICENSES, L.L.C.)
TV broadcast stations around Waukegan:
W64CQ (Channel 64; ARLINGTON HEIGHTS, IL; Owner: TRINITY BROADCASTING NETWORK)
W34CK (Channel 34; ARLINGTON HEIGHTS, IL; Owner: FIRST UNITED, INC.)
WLS-TV (Channel 7; CHICAGO, IL; Owner: WLS TELEVISION, INC.)
WMAQ-TV (Channel 5; CHICAGO, IL; Owner: NBC SUBSIDIARY (WMAQ-TV), INC.)
WTTW (Channel 11; CHICAGO, IL; Owner: WINDOW TO THE WORLD COMMUNICATIONS, INC.)
WGBO-TV (Channel 66; JOLIET, IL; Owner: WGBO LICENSE PARTNERSHIP, G.P.)
WGN-TV (Channel 9; CHICAGO, IL; Owner: WGN CONTINENTAL BROADCASTING COMPANY)
WBBM-TV (Channel 2; CHICAGO, IL; Owner: CBS BROADCASTING INC.)
WPWR-TV (Channel 50; GARY, IN; Owner: FOX TELEVISION STATIONS, INC.)
WXFT (Channel 60; AURORA, IL; Owner: TELEFUTURA CHICAGO LLC)
WCIU-TV (Channel 26; CHICAGO, IL; Owner: WCIU-TV LIMITED PARTNERSHIP)
WCPX (Channel 38; CHICAGO, IL; Owner: PAXSON CHICAGO LICENSE, INC.)
WSNS-TV (Channel 44; CHICAGO, IL; Owner: TELEMUNDO OF CHICAGO, INC.)
WFLD (Channel 32; CHICAGO, IL; Owner: FOX TELEVISION STATIONS, INC.)
W68DO (Channel 68; PALATINE, IL; Owner: TRINITY BROADCASTING NETWORK)
WFBT-CA (Channel 23; CHICAGO, IL; Owner: CHANNEL 23 LIMITED PARTNERSHIP)
WJYS (Channel 62; HAMMOND, IN; Owner: JOVON BROADCASTING CORPORATION)
WOCH-LP (Channel 28; CHICAGO, IL; Owner: KM LPTV OF CHICAGO-28, L.L.C.)
WYCC (Channel 20; CHICAGO, IL; Owner: COLLEGE DIST. #508, COUNTY OF COOK)
WOCK-CA (Channel 13; CHICAGO, IL; Owner: KM LPTV OF CHICAGO-13, L.L.C.)
WJJA (Channel 49; RACINE, WI; Owner: TV-49, INC.)
National Bridge Inventory (NBI) Statistics 25 Number of bridges367ft / 112m Total length $10,887,000 Total costs392,650 Total average daily traffic24,459 Total average daily truck traffic
New bridges - historical statistics
1 1910-1919 9 1960-1969 9 1970-1979 3 1980-1989 2 2000-2009
See full National Bridge Inventory statistics for Waukegan, IL
Home Mortgage Disclosure Act Aggregated Statistics For Year 2009(Based on 15 full and 12 partial tracts) A) FHA, FSA/RHS & VA B) Conventional C) Refinancings D) Home Improvement Loans E) Loans on Dwellings For 5+ Families F) Non-occupant Loans on G) Loans On Manufactured Number Average Value Number Average Value Number Average Value Number Average Value Number Average Value Number Average Value Number Average Value
LOANS ORIGINATED 249 $112,234 117 $115,204 799 $151,227 35 $50,768 15 $881,995 78 $105,338 5 $86,924 APPLICATIONS APPROVED, NOT ACCEPTED 12 $110,994 11 $87,828 122 $151,651 11 $26,655 0 $0 5 $72,370 2 $36,990 APPLICATIONS DENIED 43 $96,806 59 $70,670 490 $145,184 47 $42,556 6 $444,333 46 $103,172 17 $26,049 APPLICATIONS WITHDRAWN 48 $99,780 14 $125,679 225 $151,952 6 $55,313 0 $0 16 $90,654 0 $0 FILES CLOSED FOR INCOMPLETENESS 22 $111,631 7 $110,940 94 $151,992 2 $22,500 0 $0 7 $93,699 0 $0
Aggregated Statistics For Year 2008(Based on 15 full and 12 partial tracts) A) FHA, FSA/RHS & VA B) Conventional C) Refinancings D) Home Improvement Loans E) Loans on Dwellings For 5+ Families F) Non-occupant Loans on G) Loans On Manufactured Number Average Value Number Average Value Number Average Value Number Average Value Number Average Value Number Average Value Number Average Value
LOANS ORIGINATED 167 $149,239 226 $132,113 772 $141,721 79 $55,950 25 $1,193,025 114 $107,156 9 $31,841 APPLICATIONS APPROVED, NOT ACCEPTED 8 $123,031 29 $120,630 172 $144,698 26 $69,051 0 $0 10 $126,122 9 $30,484 APPLICATIONS DENIED 50 $142,480 116 $97,116 832 $153,711 150 $50,376 1 $290,170 71 $103,827 43 $24,973 APPLICATIONS WITHDRAWN 32 $141,323 34 $130,863 230 $158,587 15 $73,409 1 $141,000 18 $94,670 2 $78,180 FILES CLOSED FOR INCOMPLETENESS 5 $130,988 16 $133,931 79 $157,206 8 $114,169 0 $0 11 $127,186 0 $0
Aggregated Statistics For Year 2007(Based on 15 full and 12 partial tracts) A) FHA, FSA/RHS & VA B) Conventional C) Refinancings D) Home Improvement Loans E) Loans on Dwellings For 5+ Families F) Non-occupant Loans on G) Loans On Manufactured Number Average Value Number Average Value Number Average Value Number Average Value Number Average Value Number Average Value Number Average Value
LOANS ORIGINATED 66 $158,378 613 $135,834 1,169 $145,946 152 $59,693 32 $2,001,259 192 $128,122 21 $28,893 APPLICATIONS APPROVED, NOT ACCEPTED 1 $148,780 101 $123,244 286 $132,605 34 $71,785 0 $0 24 $124,350 10 $41,941 APPLICATIONS DENIED 22 $152,580 305 $124,074 1,114 $150,148 212 $65,570 5 $195,988 117 $124,477 40 $27,931 APPLICATIONS WITHDRAWN 8 $151,890 113 $121,748 443 $151,006 31 $81,167 1 $500,000 35 $119,718 1 $158,000 FILES CLOSED FOR INCOMPLETENESS 3 $120,090 41 $137,897 178 $152,037 8 $128,816 0 $0 20 $121,578 0 $0
Aggregated Statistics For Year 2006(Based on 15 full and 12 partial tracts) A) FHA, FSA/RHS & VA B) Conventional C) Refinancings D) Home Improvement Loans E) Loans on Dwellings For 5+ Families F) Non-occupant Loans on G) Loans On Manufactured Number Average Value Number Average Value Number Average Value Number Average Value Number Average Value Number Average Value Number Average Value
LOANS ORIGINATED 132 $153,238 1,450 $113,250 1,413 $133,905 177 $52,141 23 $938,328 299 $112,633 35 $28,839 APPLICATIONS APPROVED, NOT ACCEPTED 8 $168,125 290 $107,483 454 $122,806 63 $71,091 3 $2,323,293 84 $98,023 15 $26,789 APPLICATIONS DENIED 5 $209,778 688 $99,886 1,248 $138,584 211 $50,174 10 $803,694 141 $114,071 61 $30,696 APPLICATIONS WITHDRAWN 12 $151,648 262 $109,662 585 $143,907 35 $102,258 2 $264,000 89 $94,837 2 $11,510 FILES CLOSED FOR INCOMPLETENESS 1 $83,960 83 $120,805 221 $151,093 6 $52,420 4 $1,034,765 22 $156,471 1 $128,000
Aggregated Statistics For Year 2005(Based on 15 full and 12 partial tracts) A) FHA, FSA/RHS & VA B) Conventional C) Refinancings D) Home Improvement Loans E) Loans on Dwellings For 5+ Families F) Non-occupant Loans on G) Loans On Manufactured Number Average Value Number Average Value Number Average Value Number Average Value Number Average Value Number Average Value Number Average Value
LOANS ORIGINATED 165 $149,783 1,675 $109,246 1,740 $133,261 155 $64,759 37 $1,568,149 398 $110,752 24 $21,497 APPLICATIONS APPROVED, NOT ACCEPTED 13 $166,552 302 $100,943 435 $120,784 37 $81,280 2 $296,500 74 $103,518 11 $24,985 APPLICATIONS DENIED 19 $152,794 600 $91,888 1,384 $133,250 185 $56,605 7 $365,286 148 $104,600 77 $31,407 APPLICATIONS WITHDRAWN 17 $151,951 317 $115,560 874 $147,795 68 $133,222 3 $311,453 105 $115,612 3 $118,987 FILES CLOSED FOR INCOMPLETENESS 10 $149,331 70 $119,035 236 $135,227 5 $36,440 0 $0 20 $115,905 2 $82,500
Aggregated Statistics For Year 2004(Based on 15 full and 12 partial tracts) A) FHA, FSA/RHS & VA B) Conventional C) Refinancings D) Home Improvement Loans E) Loans on Dwellings For 5+ Families F) Non-occupant Loans on G) Loans On Manufactured Number Average Value Number Average Value Number Average Value Number Average Value Number Average Value Number Average Value Number Average Value
LOANS ORIGINATED 278 $144,624 1,195 $120,288 2,006 $132,078 147 $57,861 30 $409,981 342 $112,045 31 $25,544 APPLICATIONS APPROVED, NOT ACCEPTED 16 $145,002 193 $110,099 428 $130,841 36 $49,703 2 $252,500 49 $132,515 19 $22,943 APPLICATIONS DENIED 51 $140,005 404 $87,738 1,381 $125,593 209 $52,418 2 $107,435 123 $105,888 109 $25,568 APPLICATIONS WITHDRAWN 42 $134,731 186 $116,851 784 $131,094 47 $73,501 2 $264,500 64 $117,299 4 $90,050 FILES CLOSED FOR INCOMPLETENESS 17 $146,029 72 $135,038 386 $128,866 10 $61,982 0 $0 27 $95,589 2 $39,235
Aggregated Statistics For Year 2003(Based on 15 full and 12 partial tracts) A) FHA, FSA/RHS & VA B) Conventional C) Refinancings D) Home Improvement Loans E) Loans on Dwellings For 5+ Families F) Non-occupant Loans on Number Average Value Number Average Value Number Average Value Number Average Value Number Average Value Number Average Value
LOANS ORIGINATED 477 $138,412 849 $126,002 3,537 $125,209 89 $26,972 54 $587,444 298 $111,031 APPLICATIONS APPROVED, NOT ACCEPTED 26 $139,742 113 $121,345 465 $124,033 24 $14,406 1 $1,203,660 32 $109,954 APPLICATIONS DENIED 56 $159,746 259 $94,958 1,227 $117,364 168 $17,158 3 $938,180 88 $113,009 APPLICATIONS WITHDRAWN 53 $133,055 151 $131,609 1,291 $125,015 24 $32,594 3 $721,667 50 $115,068 FILES CLOSED FOR INCOMPLETENESS 10 $136,815 39 $134,769 203 $120,405 6 $32,195 0 $0 10 $108,370
Aggregated Statistics For Year 2002(Based on 5 full and 6 partial tracts) A) FHA, FSA/RHS & VA B) Conventional C) Refinancings D) Home Improvement Loans E) Loans on Dwellings For 5+ Families F) Non-occupant Loans on Number Average Value Number Average Value Number Average Value Number Average Value Number Average Value Number Average Value
LOANS ORIGINATED 198 $131,390 346 $135,678 1,041 $136,187 33 $20,992 10 $354,320 108 $91,656 APPLICATIONS APPROVED, NOT ACCEPTED 15 $140,225 37 $120,414 152 $117,690 15 $16,237 0 $0 6 $81,253 APPLICATIONS DENIED 17 $141,728 106 $86,145 345 $112,065 60 $21,741 2 $679,500 34 $99,963 APPLICATIONS WITHDRAWN 24 $119,291 27 $148,269 274 $119,337 13 $29,602 1 $587,710 12 $143,798 FILES CLOSED FOR INCOMPLETENESS 5 $160,548 7 $124,723 111 $126,106 2 $20,695 0 $0 3 $178,667
Aggregated Statistics For Year 2001(Based on 5 full and 6 partial tracts) A) FHA, FSA/RHS & VA B) Conventional C) Refinancings D) Home Improvement Loans E) Loans on Dwellings For 5+ Families F) Non-occupant Loans on Number Average Value Number Average Value Number Average Value Number Average Value Number Average Value Number Average Value
LOANS ORIGINATED 269 $126,123 273 $130,876 781 $124,565 56 $19,154 3 $597,617 69 $97,457 APPLICATIONS APPROVED, NOT ACCEPTED 11 $128,435 32 $91,085 124 $107,915 25 $15,367 0 $0 13 $61,972 APPLICATIONS DENIED 21 $115,495 123 $53,512 371 $95,964 91 $22,307 0 $0 25 $101,484 APPLICATIONS WITHDRAWN 35 $112,135 29 $126,218 251 $110,661 21 $29,332 1 $469,000 16 $90,669 FILES CLOSED FOR INCOMPLETENESS 7 $124,834 9 $129,439 59 $110,581 0 $0 0 $0 2 $91,940
Aggregated Statistics For Year 2000(Based on 5 full and 6 partial tracts) A) FHA, FSA/RHS & VA B) Conventional C) Refinancings D) Home Improvement Loans E) Loans on Dwellings For 5+ Families F) Non-occupant Loans on Number Average Value Number Average Value Number Average Value Number Average Value Number Average Value Number Average Value
LOANS ORIGINATED 245 $117,434 252 $116,635 285 $90,321 92 $21,356 6 $275,167 54 $78,218 APPLICATIONS APPROVED, NOT ACCEPTED 21 $109,508 33 $105,776 81 $87,717 34 $24,788 0 $0 10 $67,415 APPLICATIONS DENIED 17 $122,827 105 $59,312 293 $76,783 92 $22,484 0 $0 23 $72,759 APPLICATIONS WITHDRAWN 23 $117,540 30 $100,776 147 $81,231 10 $31,569 0 $0 5 $84,402 FILES CLOSED FOR INCOMPLETENESS 4 $94,250 9 $67,468 42 $98,433 0 $0 0 $0 5 $65,400
Aggregated Statistics For Year 1999(Based on 11 full and 9 partial tracts) A) FHA, FSA/RHS & VA B) Conventional C) Refinancings D) Home Improvement Loans E) Loans on Dwellings For 5+ Families F) Non-occupant Loans on Number Average Value Number Average Value Number Average Value Number Average Value Number Average Value Number Average Value
LOANS ORIGINATED 639 $111,397 662 $105,604 1,176 $95,030 255 $14,978 17 $392,975 149 $88,642 APPLICATIONS APPROVED, NOT ACCEPTED 19 $100,660 71 $81,064 288 $84,147 69 $17,841 1 $550,000 20 $87,081 APPLICATIONS DENIED 36 $110,629 264 $59,478 690 $87,086 224 $15,127 1 $40,000 64 $76,752 APPLICATIONS WITHDRAWN 77 $100,314 84 $96,059 473 $86,566 35 $22,724 0 $0 28 $71,870 FILES CLOSED FOR INCOMPLETENESS 4 $131,975 16 $102,657 110 $93,870 2 $21,820 0 $0 2 $115,140
Detailed mortgage data for all 26 tracts in Waukegan, IL
Private Mortgage Insurance Companies Aggregated Statistics For Year 2009(Based on 12 full and 11 partial tracts) A) Conventional B) Refinancings C) Non-occupant Loans on Number Average Value Number Average Value Number Average Value
LOANS ORIGINATED 18 $121,431 17 $174,748 0 $0 APPLICATIONS APPROVED, NOT ACCEPTED 9 $128,730 24 $158,742 2 $139,720 APPLICATIONS DENIED 7 $83,126 3 $180,713 0 $0 APPLICATIONS WITHDRAWN 1 $226,790 2 $150,440 0 $0 FILES CLOSED FOR INCOMPLETENESS 2 $52,530 1 $136,400 0 $0
Aggregated Statistics For Year 2008(Based on 15 full and 12 partial tracts) A) Conventional B) Refinancings C) Non-occupant Loans on Number Average Value Number Average Value Number Average Value
LOANS ORIGINATED 113 $149,795 121 $168,608 15 $106,498 APPLICATIONS APPROVED, NOT ACCEPTED 46 $146,104 84 $177,604 4 $156,780 APPLICATIONS DENIED 11 $130,222 14 $160,444 7 $141,450 APPLICATIONS WITHDRAWN 5 $175,580 21 $172,137 0 $0 FILES CLOSED FOR INCOMPLETENESS 1 $158,830 7 $176,501 3 $185,403
Aggregated Statistics For Year 2007(Based on 15 full and 12 partial tracts) A) Conventional B) Refinancings C) Non-occupant Loans on Number Average Value Number Average Value Number Average Value
LOANS ORIGINATED 298 $150,847 207 $171,227 33 $136,745 APPLICATIONS APPROVED, NOT ACCEPTED 40 $161,211 58 $158,163 5 $128,232 APPLICATIONS DENIED 16 $152,796 6 $158,420 2 $147,305 APPLICATIONS WITHDRAWN 18 $150,533 23 $166,193 2 $104,000 FILES CLOSED FOR INCOMPLETENESS 0 $0 3 $147,940 1 $106,000
Aggregated Statistics For Year 2006(Based on 15 full and 12 partial tracts) A) Conventional B) Refinancings C) Non-occupant Loans on Number Average Value Number Average Value Number Average Value
LOANS ORIGINATED 218 $152,547 135 $158,705 25 $127,747 APPLICATIONS APPROVED, NOT ACCEPTED 24 $150,118 34 $160,861 2 $118,000 APPLICATIONS DENIED 5 $141,484 3 $127,387 0 $0 APPLICATIONS WITHDRAWN 7 $169,663 14 $156,971 1 $101,000 FILES CLOSED FOR INCOMPLETENESS 0 $0 1 $94,060 0 $0
Aggregated Statistics For Year 2005(Based on 15 full and 12 partial tracts) A) Conventional B) Refinancings C) Non-occupant Loans on Number Average Value Number Average Value Number Average Value
LOANS ORIGINATED 213 $147,319 167 $148,130 22 $145,690 APPLICATIONS APPROVED, NOT ACCEPTED 53 $140,469 49 $151,954 7 $119,833 APPLICATIONS DENIED 4 $135,455 4 $221,500 3 $146,667 APPLICATIONS WITHDRAWN 11 $148,434 13 $180,599 2 $105,890 FILES CLOSED FOR INCOMPLETENESS 5 $141,044 3 $114,073 0 $0
Aggregated Statistics For Year 2004(Based on 15 full and 12 partial tracts) A) Conventional B) Refinancings C) Non-occupant Loans on Number Average Value Number Average Value Number Average Value
LOANS ORIGINATED 322 $140,434 240 $143,210 34 $127,137 APPLICATIONS APPROVED, NOT ACCEPTED 42 $134,754 77 $142,201 4 $78,518 APPLICATIONS DENIED 3 $124,587 10 $150,413 2 $166,845 APPLICATIONS WITHDRAWN 28 $161,656 23 $144,505 8 $141,861 FILES CLOSED FOR INCOMPLETENESS 6 $146,115 5 $128,428 1 $57,950
Aggregated Statistics For Year 2003(Based on 15 full and 12 partial tracts) A) Conventional B) Refinancings C) Non-occupant Loans on Number Average Value Number Average Value Number Average Value
LOANS ORIGINATED 310 $132,510 394 $137,584 44 $113,209 APPLICATIONS APPROVED, NOT ACCEPTED 46 $128,311 137 $136,641 5 $107,218 APPLICATIONS DENIED 6 $138,402 11 $130,015 2 $131,075 APPLICATIONS WITHDRAWN 15 $119,249 39 $134,475 8 $113,451 FILES CLOSED FOR INCOMPLETENESS 1 $177,000 1 $155,180 0 $0
Aggregated Statistics For Year 2002(Based on 5 full and 6 partial tracts) A) Conventional B) Refinancings C) Non-occupant Loans on Number Average Value Number Average Value Number Average Value
LOANS ORIGINATED 148 $134,459 129 $137,180 20 $105,462 APPLICATIONS APPROVED, NOT ACCEPTED 24 $122,411 31 $143,210 2 $60,000 APPLICATIONS DENIED 0 $0 2 $156,565 0 $0 APPLICATIONS WITHDRAWN 4 $145,495 8 $142,204 0 $0 FILES CLOSED FOR INCOMPLETENESS 0 $0 0 $0 0 $0
Aggregated Statistics For Year 2001(Based on 5 full and 6 partial tracts) A) Conventional B) Refinancings C) Non-occupant Loans on Number Average Value Number Average Value Number Average Value
LOANS ORIGINATED 115 $130,415 106 $128,882 16 $99,884 APPLICATIONS APPROVED, NOT ACCEPTED 14 $143,044 21 $132,121 1 $83,310 APPLICATIONS DENIED 3 $113,127 9 $135,652 3 $101,680 APPLICATIONS WITHDRAWN 0 $0 4 $163,762 0 $0 FILES CLOSED FOR INCOMPLETENESS 2 $152,500 0 $0 0 $0
Aggregated Statistics For Year 2000(Based on 5 full and 6 partial tracts) A) Conventional B) Refinancings C) Non-occupant Loans on Number Average Value Number Average Value Number Average Value
LOANS ORIGINATED 90 $126,195 42 $111,249 11 $92,135 APPLICATIONS APPROVED, NOT ACCEPTED 13 $113,398 6 $109,642 3 $72,667 APPLICATIONS DENIED 5 $85,490 2 $113,395 0 $0 APPLICATIONS WITHDRAWN 2 $71,250 1 $69,000 0 $0 FILES CLOSED FOR INCOMPLETENESS 1 $75,840 1 $129,000 0 $0
Aggregated Statistics For Year 1999(Based on 11 full and 9 partial tracts) A) Conventional B) Refinancings C) Non-occupant Loans on Number Average Value Number Average Value Number Average Value
LOANS ORIGINATED 271 $114,033 136 $115,146 15 $87,523 APPLICATIONS APPROVED, NOT ACCEPTED 15 $135,435 24 $115,274 3 $77,647 APPLICATIONS DENIED 12 $110,109 11 $125,225 2 $116,485 APPLICATIONS WITHDRAWN 14 $108,501 4 $170,155 1 $50,900 FILES CLOSED FOR INCOMPLETENESS 2 $125,535 1 $127,670 0 $0
Fire-safe hotels and motels in Waukegan, Illinois:
Super 8, 619 S Grn Bay Rd, Waukegan, Illinois 60085 Phone: (847) 662-3200, Fax: (847) 662-7275
Courtyard By Marriott Chicago Waukegan, 800 Lakehurst Rd, Waukegan, Illinois 60085 Phone: (847) 689-8000, Fax: (847) 689-0135
Ramada Inn Waukegan Great Lakes, 200 N Greenbay Rd, Waukegan, Illinois 60085 Phone: (847) 244-2400, Fax: (847) 249-9716
Comfort Inn Waukegan, 3031 Belvidere, Waukegan, Illinois 60085 Phone: (847) 623-1400, Fax: (847) 623-0686
Crossland Economy Studios - Chicago - Waukegan, 1177 S Northpoint Blvd, Waukegan, Illinois 60085 Phone: (847) 688-0402, Fax: (847) 688-0403
Candlewood Suites, 1151 S Waukegan Rd, Waukegan, Illinois 60085 Phone: (847) 578-5250, Fax: (847) 578-5256
Residence Inn By Marriott / Waukegan, 1440 S White Oak Dr, Waukegan, Illinois 60085 Phone: (847) 689-9240, Fax: (847) 689-9260
Holiday Inn Express & Suites, 611 Lakehurst Rd, Waukegan, Illinois 60085 Phone: (312) 782-9445
3 other hotels and motels
All 11 fire-safe hotels and motels in Waukegan, Illinois
Most common first names in Waukegan, IL among deceased individuals Name Count Lived (average)
John 567 73.3 years Mary 472 79.4 years William 384 72.5 years Joseph 304 74.2 years Robert 287 67.6 years James 279 68.8 years George 265 74.4 years Frank 238 76.8 years Charles 230 72.1 years Helen 215 80.0 years
Most common last names in Waukegan, IL among deceased individuals Last name Count Lived (average)
Johnson 182 72.0 years Smith 149 71.8 years Brown 106 69.9 years Anderson 96 76.2 years Jones 90 70.0 years Miller 88 73.2 years Williams 82 68.1 years Davis 55 65.7 years Nelson 53 74.3 years Taylor 53 69.1 years
Waukegan compared to Illinois state average:
Hispanic race population percentage significantly above state average. Median age significantly below state average. Foreign-born population percentage above state average. Number of college students below state average.
#2 on the list of "Top 101 cities with largest percentage of females in occupations: production occupations (population 50,000+)"
#3 on the list of "Top 101 cities with largest percentage of males in occupations: material moving occupations (population 50,000+)"
#4 on the list of "Top 101 cities with largest percentage of females in industries: manufacturing (population 50,000+)"
#6 on the list of "Top 101 cities with largest percentage of males in industries: administrative and support and waste management services (population 50,000+)"
#13 on the list of "Top 101 cities with the largest city-data.com crime index increase from 2002 to 2012 (population 50,000+)"
#16 on the list of "Top 101 cities with largest percentage of males in occupations: production occupations (population 50,000+)"
#18 on the list of "Top 101 larger cities with the largest decrease or smallest increase in house/condo value from 2000 (population 50,000+)"
#22 on the list of "Top 101 cities with largest percentage of males in industries: manufacturing (population 50,000+)"
#26 on the list of "Top 101 cities with the least people having professional degrees (population 50,000+)"
#29 on the list of "Top 101 cities with largest percentage of females in occupations: material moving occupations (population 50,000+)"
#47 on the list of "Top 101 cities with largest percentage of females in industries: administrative and support and waste management services (population 50,000+)"
#51 on the list of "Top 101 cities with the coldest winters (population 50,000+)"
#54 on the list of "Top 101 cities with largest percentage of males in industries: other services, except public administration (population 50,000+)"
#55 on the list of "Top 101 cities with the smallest differences between morning and afternoon humidity (population 50,000+)"
#56 on the list of "Top 101 cities with the smallest humidity differences during a year (population 50,000+)"
#57 on the list of "Top 101 cities with the lowest number of auto thefts per 100,000 residents (population 50,000+)"
#57 on the list of "Top 101 cities with largest percentage of females in industries: management of companies and enterprises (population 50,000+)"
#61 on the list of "Top 100 least-educated cities (pop. 50,000+)"
#62 on the list of "Top 101 cities with the lowest daily low temperatures (population 50,000+)"
#65 on the list of "Top 101 cities with the lowest average temperatures (population 50,000+)"
#4 on the list of "Top 101 counties with the highest average weight of females"
#22 on the list of "Top 101 counties with the largest decrease in the number of births per 1000 residents 2000-2006 to 2007-2013 (pop 50,000+)"
#24 on the list of "Top 101 counties with the largest increase in the number of infant deaths per 1000 residents 2000-2006 to 2007-2013 (pop. 50,000+)"
#29 on the list of "Top 101 counties with the highest percentage of residents that exercised in the past month"
#31 on the list of "Top 101 counties with the largest number of people moving out compared to moving in (pop. 50,000+)"
Top Patent Applicants
Wms Gaming Inc. (52)
Abraham M. Underkofler (20)
William J. Mcclellan (17)
Bo Liu (15)
Amit Khatri (11)
Yuchuan Gong (11)
Mark R. Paulsen (9)
David J. Grampovnik (9)
Dachun Liu (9)
Gregory G. Pieper (8)
Total of 374 patent applications in 2008-2024.


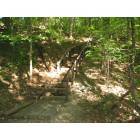
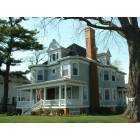
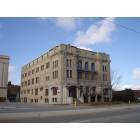


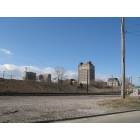

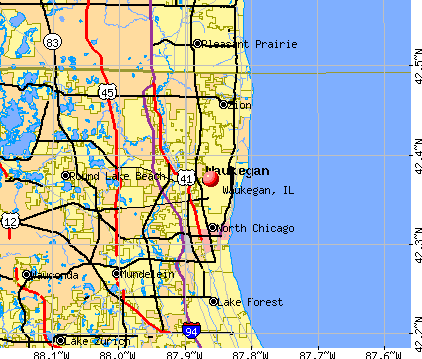


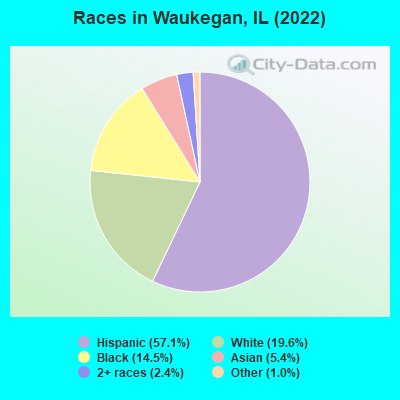
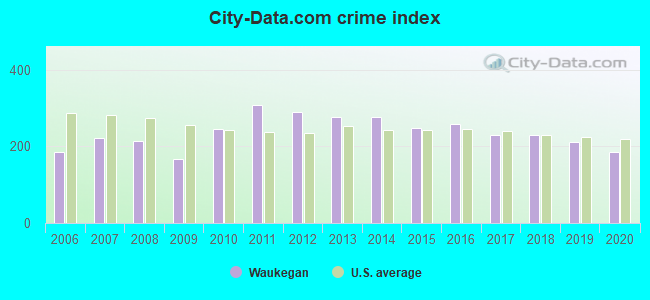
 Recent articles from our blog. Our writers, many of them Ph.D. graduates or candidates, create easy-to-read articles on a wide variety of topics.

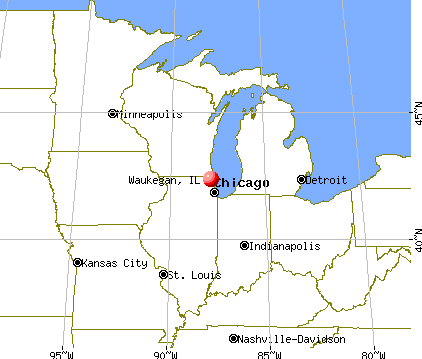
 (38.0 miles
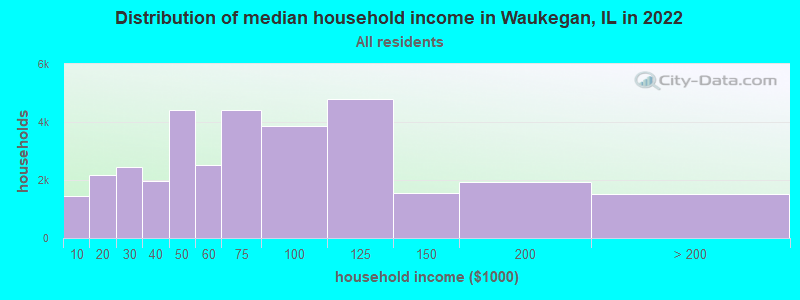
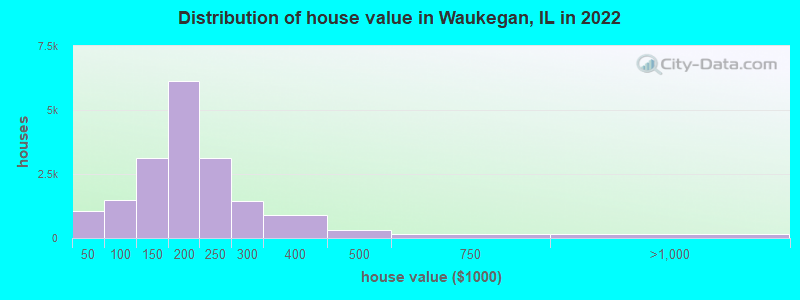
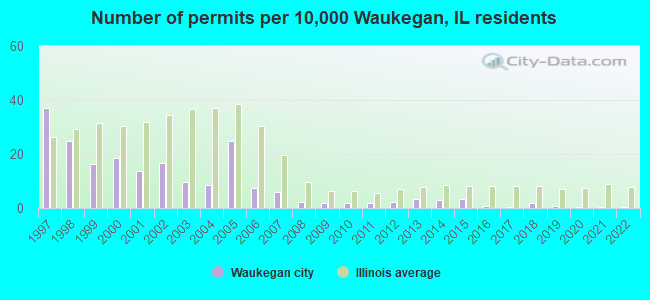
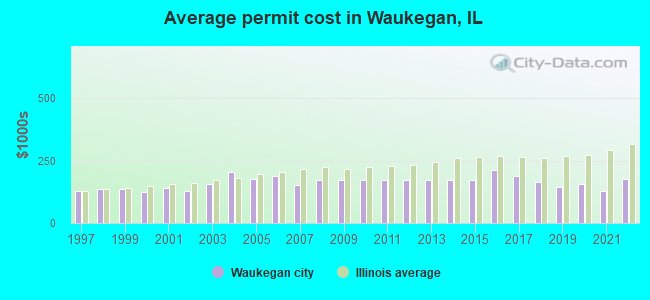
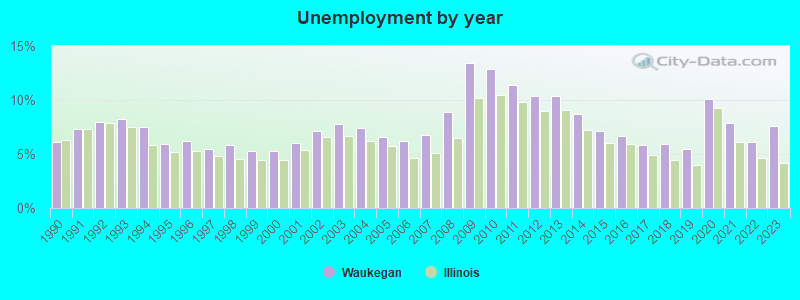
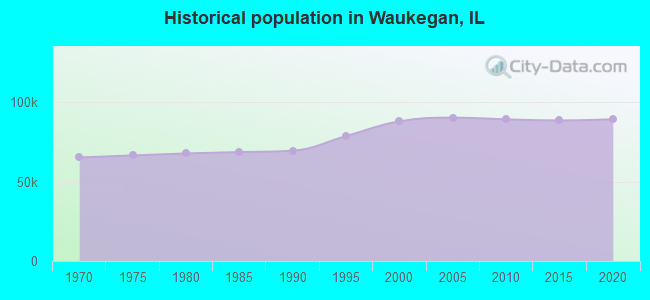
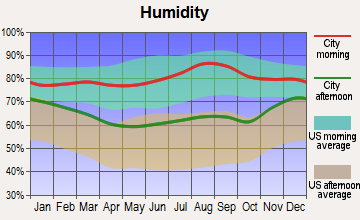
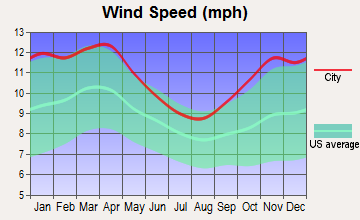
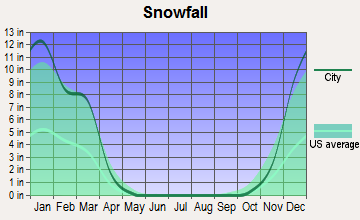
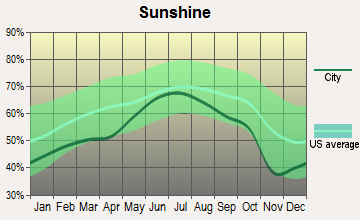
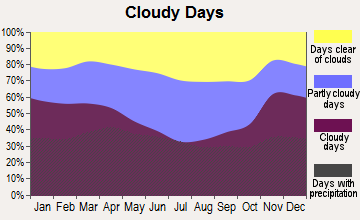


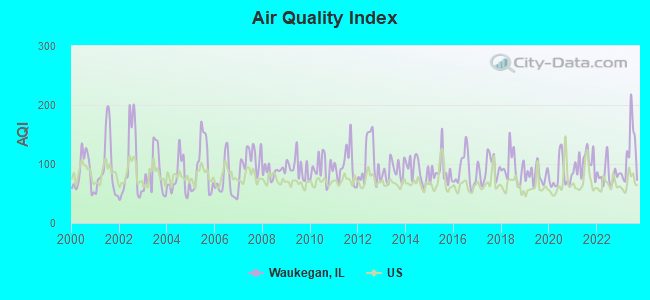
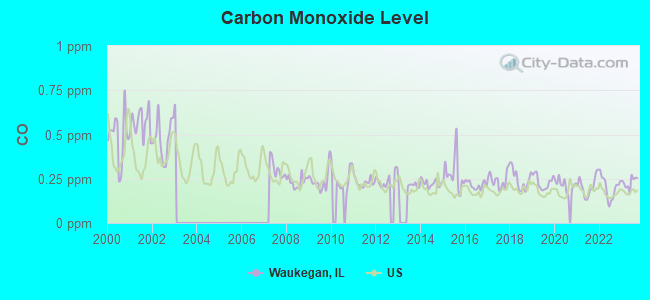

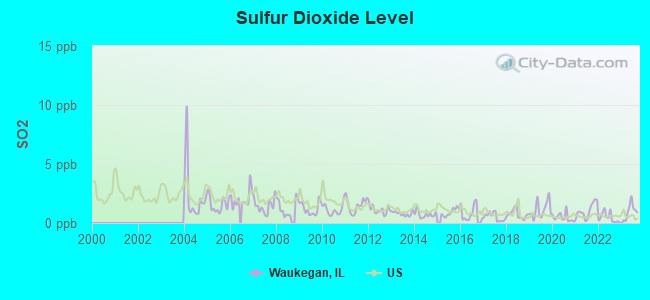
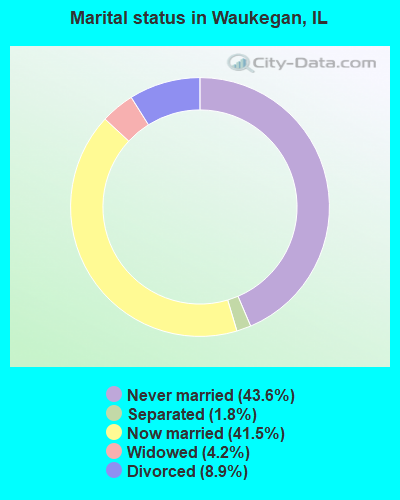
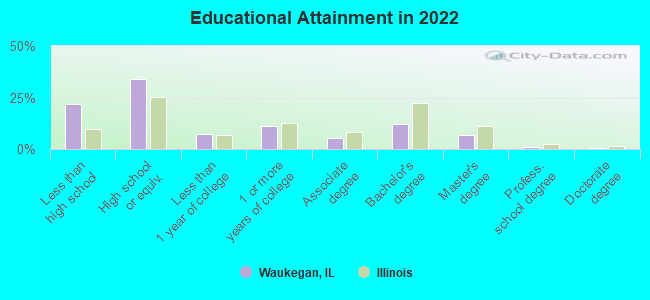
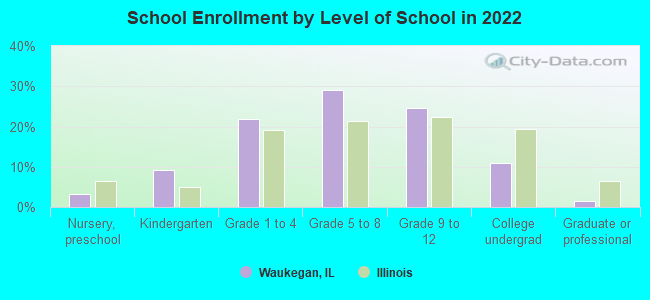
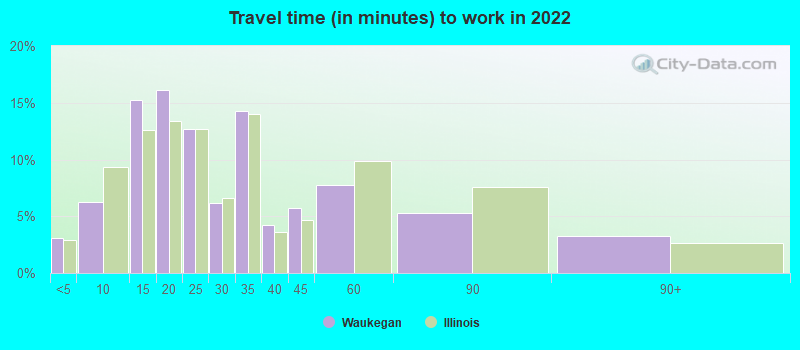
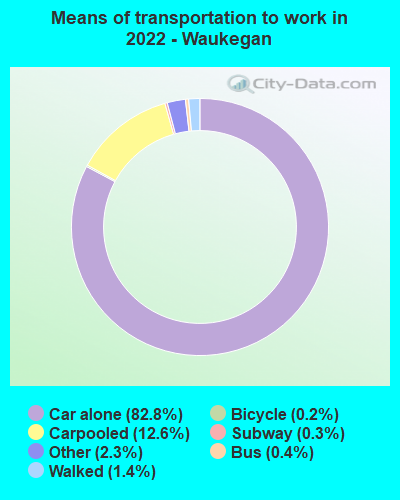
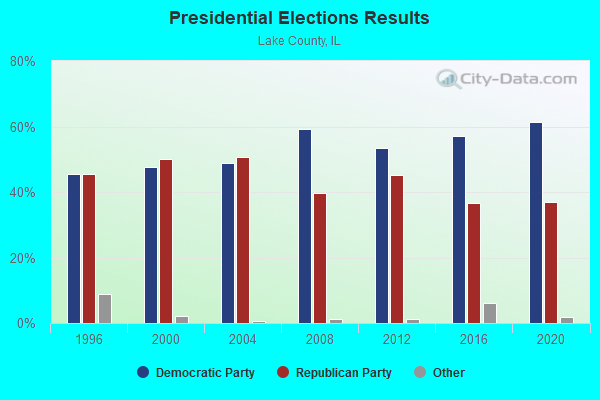
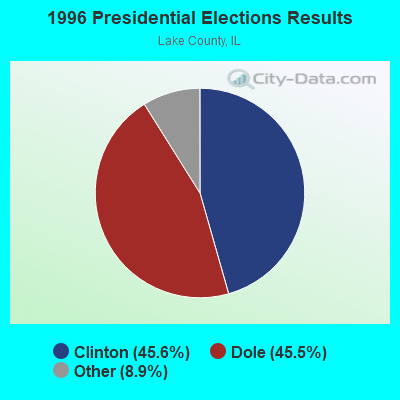
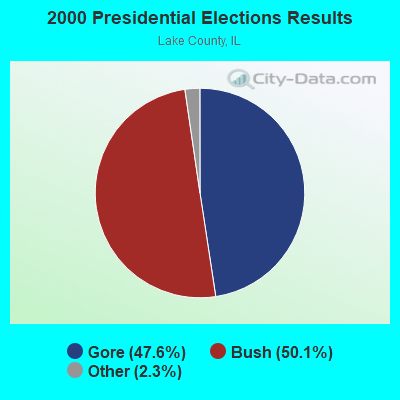
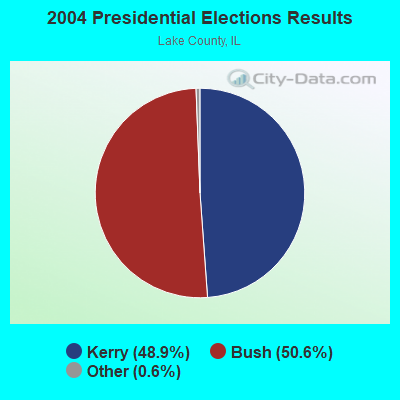
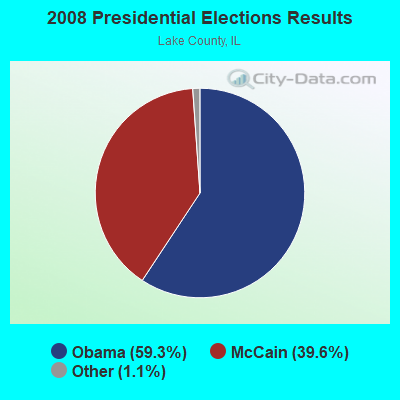
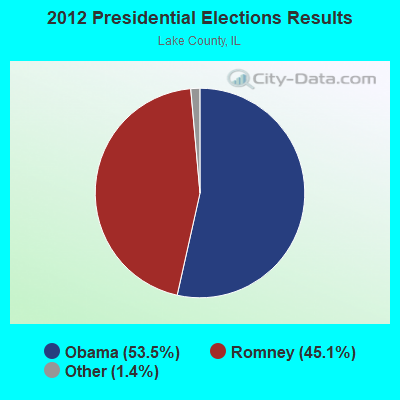
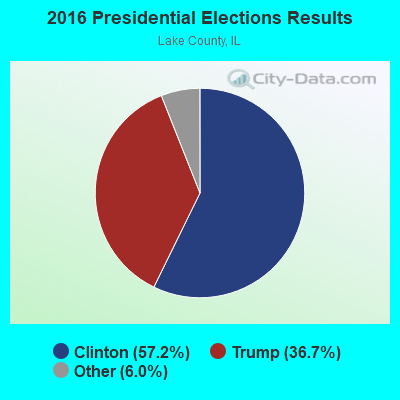
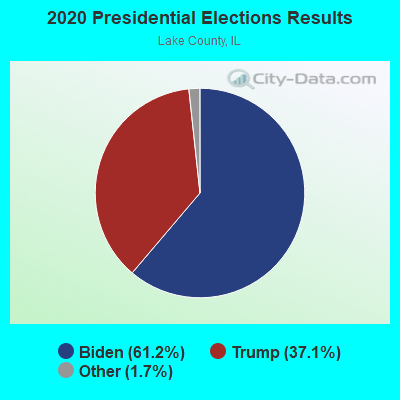

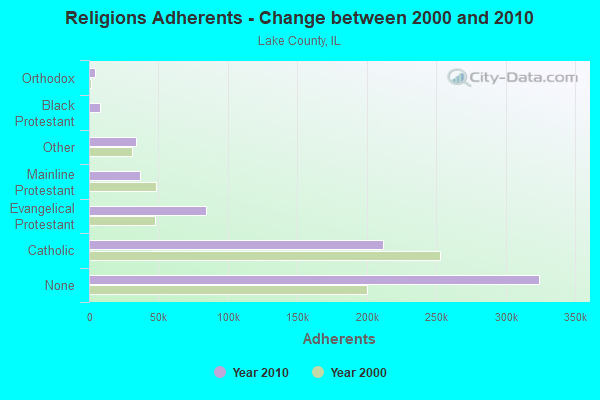
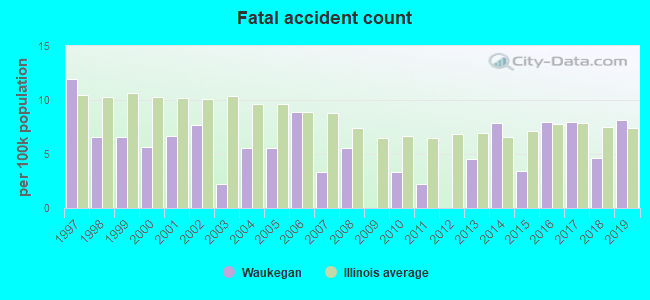
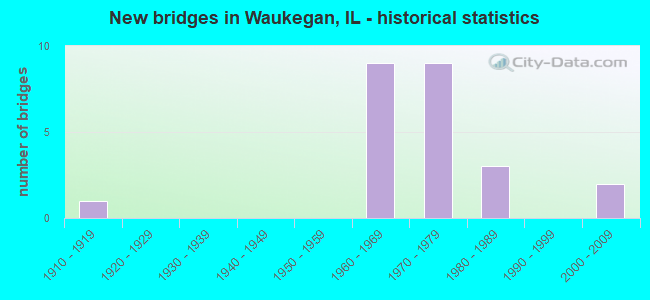
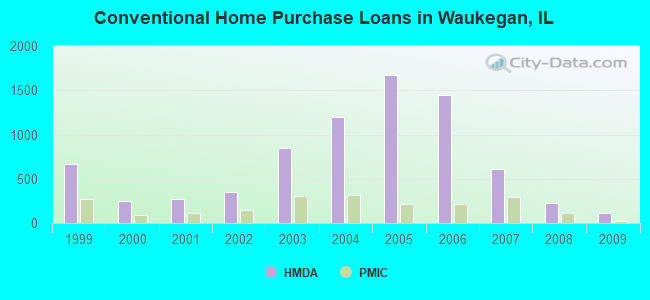
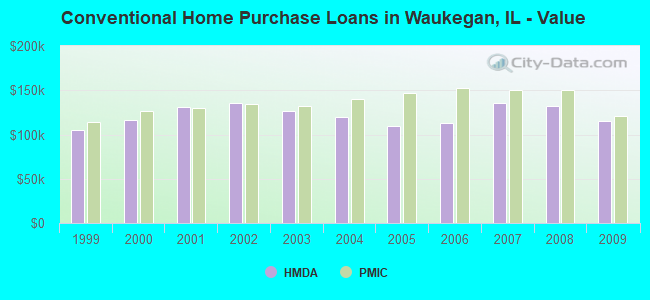
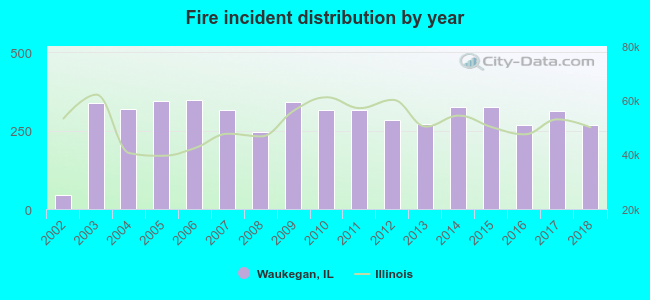 Based on the data from the years 2002 - 2018 the average number of fires per year is 293. The highest number of fires - 347 took place in 2006, and the least - 44 in 2002. The data has a growing trend.
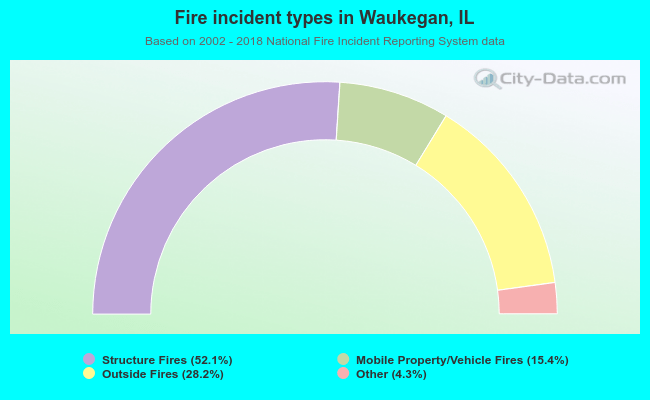 When looking into fire subcategories, the most reports belonged to: Structure Fires (52.1%), and Outside Fires (28.2%).