Wenona, IL (Illinois) Houses and Residents
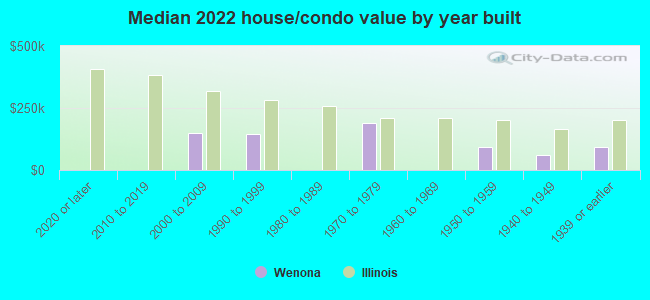
| Wenona: | $92,495 |
| Illinois: | $251,600 |
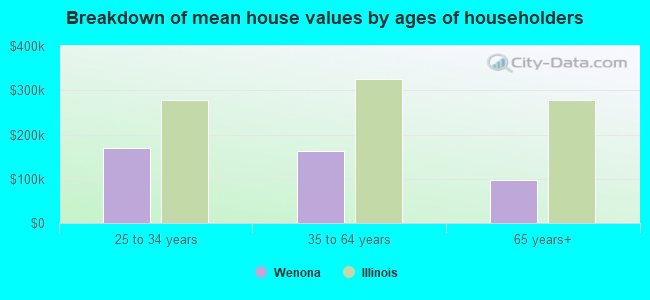
Mean price in 2022:
Detached houses: $127,941
Here: $127,941 State: $310,164
Total population: 998 (Urban population: 0, Rural population: 1,078 (all nonfarm))
Houses: 555 (520 occupied: 318 owner occupied, 208 renter occupied)
| % of renters here: | 40% |
| State: | 33% |
Housing density: 825 houses/condos per square mile
Median price asked for vacant for-sale houses and condos in 2022 in this county: $74,950.
Median contract rent in 2022: $599 (lower quartile is $400, upper quartile is $653)
Median rent asked for vacant for-rent units in 2022: $668
Median gross rent in Wenona, IL in 2022: $693
Housing units in Wenona with a mortgage: 128 (3 second mortgage, 0 home equity loan, 1 both second mortgage and home equity loan)
Houses without a mortgage: 0
Median household income for houses/condos with a mortgage: $80,601
Median household income for apartments without a mortgage: $36,542
Median monthly housing costs: $662
Compare current foreclosures near Wenona, IL:
| Photo | Address | Area | Beds / Baths | Price | Details |
|---|---|---|---|---|---|

|
#1
Oak St
Oglesby, IL 61348
|
2,074 sq. feet
|
1 baths 3 beds |
show details | |

|
#2
Reading St
Streator, IL 61364
|
1,350 sq. feet
|
2 baths 3 beds |
show details | |

|
#3
E Wilson St
Streator, IL 61364
|
778 sq. feet
|
1 baths 2 beds |
show details | |

|
#4
E 3000 North Rd
Cornell, IL 61319
|
1,241 sq. feet
|
1 baths 2 beds |
show details | |

|
#5
Main St
Henry, IL 61537
|
1,074 sq. feet
|
2 baths 3 beds |
show details | |

|
#6
W Santa Fe Ave
Toluca, IL 61369
|
- sq. feet
|
- baths - beds |
$57,900
|
show details |

|
#7
Robert St
Henry, IL 61537
|
- sq. feet
|
- baths - beds |
$29,900
|
show details |

|
#8
N Jackson St
Flanagan, IL 61740
|
1,970 sq. feet
|
2 baths 4 beds |
show details | |

|
#9
N 675 East Rd
Cornell, IL 61319
|
816 sq. feet
|
- baths 2 beds |
show details | |

|
#10
E 3000 North Rd Bldg 178
Streator, IL 61364
|
946 sq. feet
|
- baths 3 beds |
show details |
| Photo | Address | Area | Beds / Baths | Price | Details |
|---|---|---|---|---|---|

|
#11
N Monroe St
Flanagan, IL 61740
|
1,248 sq. feet
|
- baths 3 beds |
show details | |

|
#12
S Jackson St
Flanagan, IL 61740
|
2,596 sq. feet
|
- baths 5 beds |
show details | |

|
#13
S Jackson St
Streator, IL 61364
|
960 sq. feet
|
- baths 3 beds |
show details | |

|
#14
S Otter Creek Rd
Streator, IL 61364
|
1,797 sq. feet
|
- baths - beds |
show details | |

|
#15
1/2 Finley Cir
Grand Ridge, IL 61325
|
- sq. feet
|
- baths - beds |
show details | |

|
#16
Bryan St
Henry, IL 61537
|
1,155 sq. feet
|
- baths - beds |
show details | |

|
#17
Sunset Blvd
Oglesby, IL 61348
|
- sq. feet
|
- baths - beds |
show details | |

|
#18
Cerulla Cir
Oglesby, IL 61348
|
- sq. feet
|
- baths - beds |
show details | |

|
#19
Cedar Creek Ln
Oglesby, IL 61348
|
- sq. feet
|
- baths - beds |
show details | |

|
#20
N 2199th Rd
Tonica, IL 61370
|
- sq. feet
|
- baths - beds |
show details |
| Photo | Address | Area | Beds / Baths | Price | Details |
|---|---|---|---|---|---|

|
#21
Cedar St
Cedar Point, IL 61316
|
- sq. feet
|
- baths - beds |
show details | |

|
#22
Sunset Blvd
Oglesby, IL 61348
|
- sq. feet
|
- baths - beds |
show details | |

|
#23
W 2nd St
Oglesby, IL 61348
|
- sq. feet
|
- baths - beds |
show details | |

|
#24
Monroe St
Henry, IL 61537
|
886 sq. feet
|
- baths - beds |
show details | |

|
#25
S Main St
Flanagan, IL 61740
|
- sq. feet
|
- baths - beds |
show details | |

|
#26
Marcia St
Henry, IL 61537
|
1,092 sq. feet
|
- baths - beds |
show details | |

|
#27
Market St
Henry, IL 61537
|
1,065 sq. feet
|
- baths - beds |
show details | |

|
#28
Field Ave
Oglesby, IL 61348
|
- sq. feet
|
- baths - beds |
show details | |

|
#29
School St
Henry, IL 61537
|
1,540 sq. feet
|
- baths - beds |
show details | |

|
#30
E 1st St
Oglesby, IL 61348
|
- sq. feet
|
- baths - beds |
show details |
| Photo | Address | Area | Beds / Baths | Price | Details |
|---|---|---|---|---|---|

|
#31
Carroll St
Henry, IL 61537
|
- sq. feet
|
- baths - beds |
show details | |

|
#32
N Jackson St
Flanagan, IL 61740
|
- sq. feet
|
- baths - beds |
show details | |

|
#33
State Route 251
Rutland, IL 61358
|
- sq. feet
|
- baths - beds |
show details | |

|
#34
Hidden Valley Dr
Varna, IL 61375
|
- sq. feet
|
- baths - beds |
show details | |

|
#35
Gary St
Leonore, IL 61332
|
- sq. feet
|
- baths - beds |
show details | |

|
#36
Water St
Streator, IL 61364
|
- sq. feet
|
- baths - beds |
show details | |

|
#37
W Stanton St
Streator, IL 61364
|
- sq. feet
|
- baths - beds |
show details | |

|
#38
Carriage Lane Est
Streator, IL 61364
|
- sq. feet
|
- baths - beds |
show details | |

|
#39
Pontiac St
Tonica, IL 61370
|
- sq. feet
|
- baths - beds |
show details | |

|
#40
W 4th St
Minonk, IL 61760
|
- sq. feet
|
- baths - beds |
show details |
| Photo | Address | Area | Beds / Baths | Price | Details |
|---|---|---|---|---|---|

|
#41
W 6th St
Minonk, IL 61760
|
- sq. feet
|
- baths - beds |
show details | |

|
#42
N 17th Rd
Tonica, IL 61370
|
- sq. feet
|
- baths - beds |
show details | |

|
#43
E 6th St
Long Point, IL 61333
|
- sq. feet
|
- baths - beds |
show details | |

|
#44
S Walnut St
Dana, IL 61321
|
- sq. feet
|
- baths - beds |
show details | |

|
#45
Roberts Rd
Magnolia, IL 61336
|
- sq. feet
|
- baths - beds |
show details | |

|
#46
N Bloomington St Apt A7
Streator, IL 61364
|
- sq. feet
|
- baths - beds |
show details | |

|
#47
N Columbia Ave
Oglesby, IL 61348
|
- sq. feet
|
- baths - beds |
show details | |

|
#48
W Bridge St
Streator, IL 61364
|
- sq. feet
|
- baths - beds |
show details | |

|
#49
Lehigh Ave
Oglesby, IL 61348
|
- sq. feet
|
- baths - beds |
show details | |

|
Check over 1 million property listings on Foreclosure.com!
|
browse all offers | |||

Latest news about housing in Wenona, IL collected exclusively by city-data.com from local newspapers, TV, and radio stations

 | History of Wenona? (2 replies) |
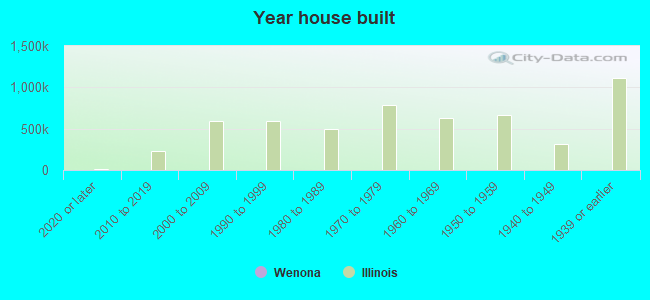
Median year apartment built: 1975
Household type by relationship:
Households: 1,032- Male householders: 225 (101 living alone), Female householders: 285 (113 living alone)
162 spouses (162 opposite-sex spouses), 48 unmarried partners, (48 opposite-sex unmarried partners), 232 children (222 natural, 0 adopted, 9 stepchildren), 32 grandchildren, 0 brothers or sisters, 23 parents, 0 foster children, 0 other relatives, 17 non-relatives
- In group quarters: 3
Size of family households: 146 2-persons, 73 3-persons, 36 4-persons, 10 5-persons, 7 6-persons.
Size of nonfamily households: 226 1-person, 16 2-persons, 13 3-persons.
101 married couples with children.
85 single-parent households (0 men, 85 women).
97.0% of residents of Wenona speak English at home.
2.0% of residents speak Spanish at home (42% speak English well, 58% speak English not well).
0.5% of residents speak other language at home (100% speak English very well).
Foreign born population: 35 (3.4%)
(31.4% of them are naturalized citizens)
| Here: | 6.4 |
| State: | 6.4 |
| Here: | 3.5 |
| State: | 4.1 |
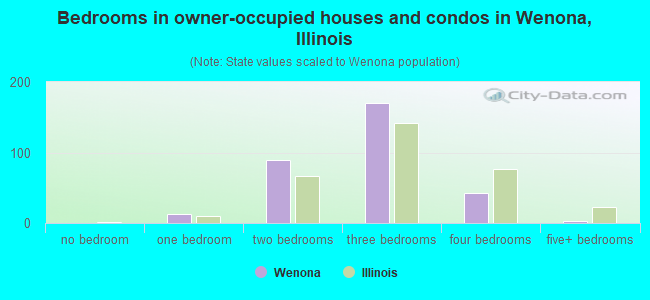
- Bedrooms in owner-occupied houses and condos in Wenona, Illinois
- 0no bedroom
- 131 bedroom
- 902 bedrooms
- 1703 bedrooms
- 434 bedrooms
- 35+ bedrooms
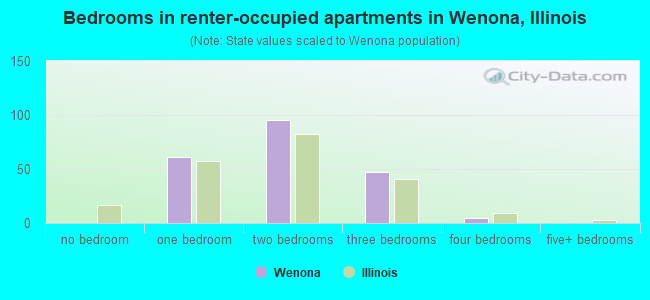
- Bedrooms in renter-occupied apartments in Wenona, Illinois
- 0no bedroom
- 611 bedroom
- 962 bedrooms
- 473 bedrooms
- 54 bedrooms
- 05+ bedrooms
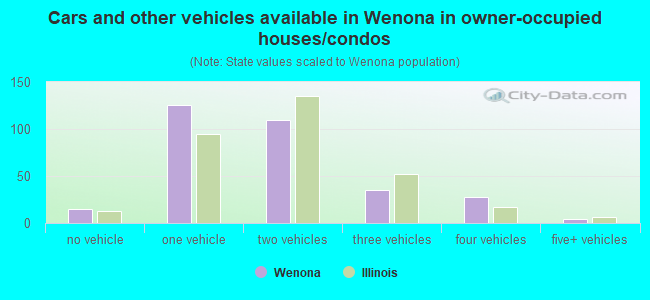
- Cars and other vehicles available in Wenona in owner-occupied houses/condos
- 15no vehicle
- 1261 vehicle
- 1102 vehicles
- 353 vehicles
- 284 vehicles
- 45+ vehicles
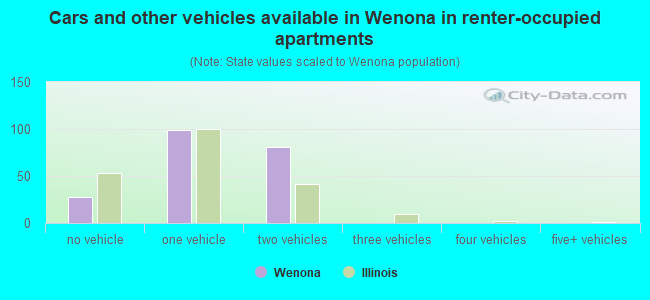
- Cars and other vehicles available in Wenona in renter-occupied apartments
- 28no vehicle
- 991 vehicle
- 812 vehicles
- 03 vehicles
- 04 vehicles
- 05+ vehicles
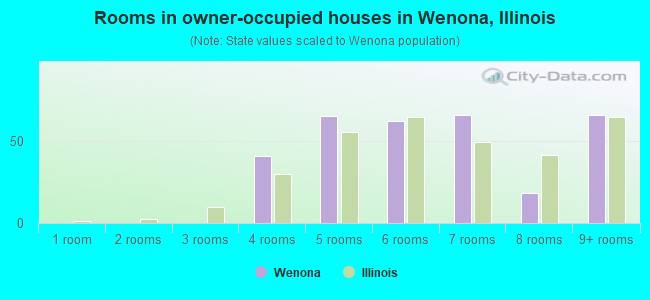
- Rooms in owner-occupied houses in Wenona, Illinois
- 01 room
- 02 rooms
- 03 rooms
- 414 rooms
- 655 rooms
- 626 rooms
- 667 rooms
- 188 rooms
- 669+ rooms
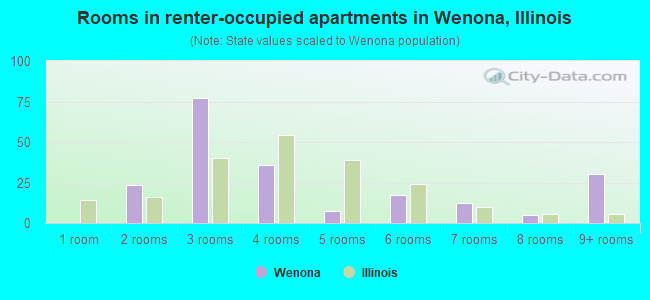
- Rooms in renter-occupied apartments in Wenona, Illinois
- 01 room
- 232 rooms
- 773 rooms
- 364 rooms
- 75 rooms
- 176 rooms
- 127 rooms
- 58 rooms
- 319+ rooms
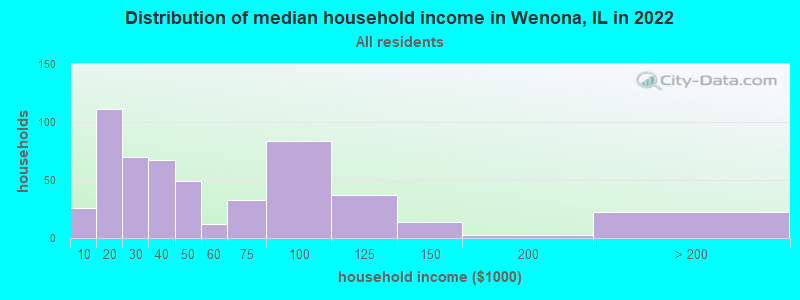
Wenona, IL household income distribution

- 26Less than $10,000
- 111$10,000 to $19,999
- 70$20,000 to $29,999
- 67$30,000 to $39,999
- 49$40,000 to $49,999
- 12$50,000 to $59,999
- 33$60,000 to $74,999
- 84$75,000 to $99,999
- 37$100,000 to $124,999
- 14$125,000 to $149,999
- 3$150,000 to $199,999
- 22$200,000 or more
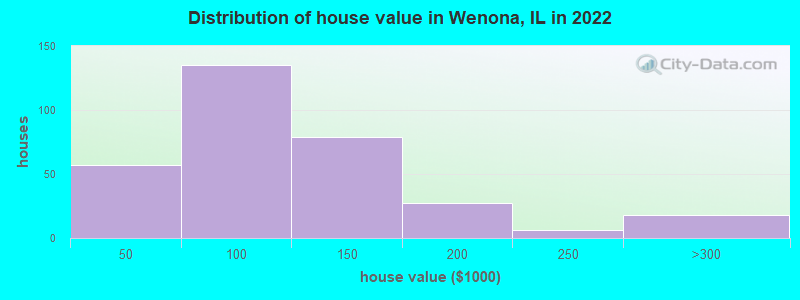
Home value of owner - occupied houses in 2022 in Wenona, IL
-
- 4Less than $10,000
- 5$10,000 to $14,999
- 15$15,000 to $19,999
- 5$20,000 to $24,999
- 9$30,000 to $34,999
- 3$35,000 to $39,999
- 13$40,000 to $49,999
- 16$50,000 to $59,999
- 16$60,000 to $69,999
- 12$70,000 to $79,999
- 70$80,000 to $89,999
- 5$90,000 to $99,999
- 42$100,000 to $124,999
- 36$125,000 to $149,999
- 16$150,000 to $174,999
- 9$175,000 to $199,999
- 5$200,000 to $249,999
- 18$250,000 to $299,999
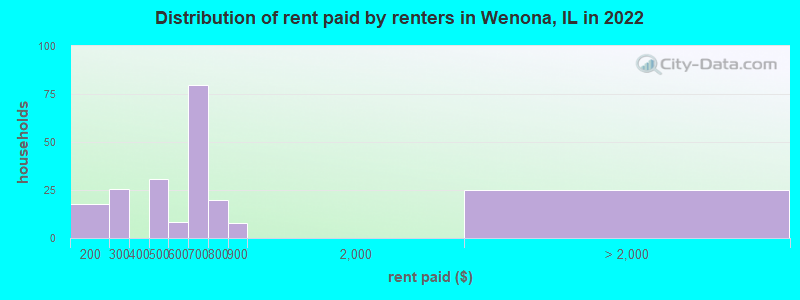
Rent paid by renters in 2022 in Wenona, IL
-
- 17$100 to $149
- 25$200 to $249
- 17$400 to $449
- 13$450 to $499
- 8$550 to $599
- 56$600 to $649
- 22$650 to $699
- 9$700 to $749
- 10$750 to $799
- 7$800 to $899
- 25No cash rent
Percentage of workers working in this county: 32.8%
Number of people working at home: 23 (4.9% of all workers)
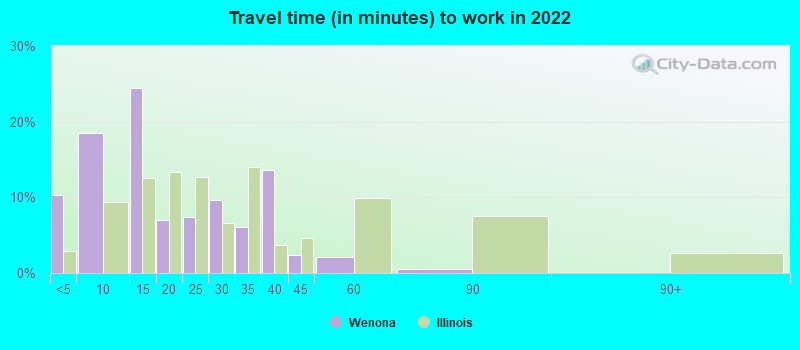
Travel time to work (commute)
- Less than 5 minutes: 38
- 5 to 9 minutes: 45
- 10 to 14 minutes: 35
- 15 to 19 minutes: 24
- 20 to 24 minutes: 24
- 25 to 29 minutes: 68
- 30 to 34 minutes: 64
- 35 to 39 minutes: 30
- 40 to 44 minutes: 53
- 45 to 59 minutes: 28
- 60 to 89 minutes: 12
- 90 or more minutes: 9
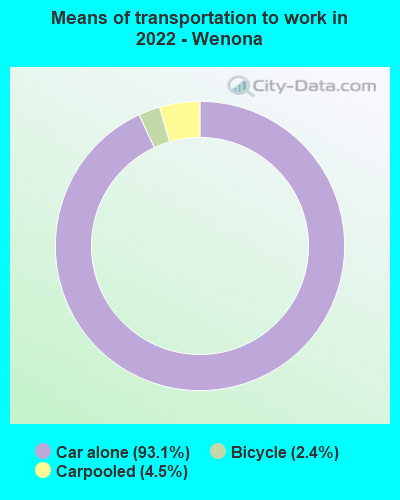
Means of transportation to work:
- Drove a car alone: 301 (85.0%)
- Carpooled: 15 (4.2%)
- Bicycle: 8 (2.3%)
- Worked at home: 23 (6.5%)
- Unemployment by race in 2022
- Unemployment rate for White non-Hispanic residents
- 6.8%Males
- Unemployment rate for two or more race residents
- 100.0%Males
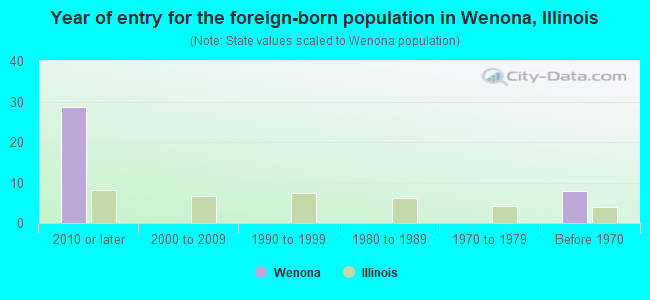
- Year of entry for the foreign-born population in Wenona, Illinois
- 292010 or later
- 02000 to 2009
- 01990 to 1999
- 01980 to 1989
- 01970 to 1979
- 8Before 1970
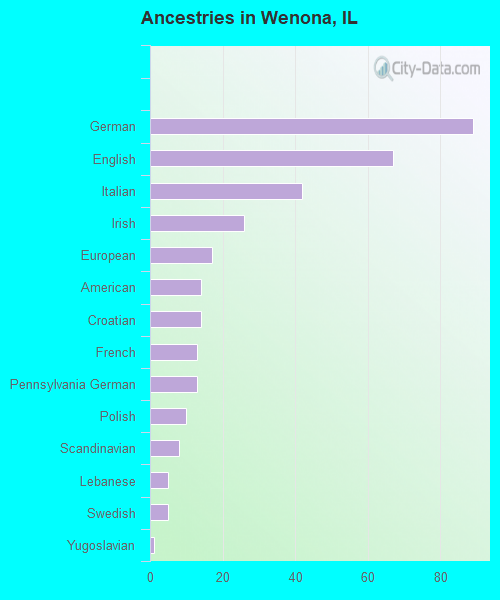
First ancestries reported:
- German: 89 (20.3%)
- English: 67 (15.3%)
- Italian: 42 (9.6%)
- Irish: 26 (5.9%)
- European: 17 (3.9%)
- American: 14 (3.2%)
- Croatian: 14 (3.2%)
- French: 13 (3.0%)
- Pennsylvania German: 13 (3.0%)
- Polish: 10 (2.3%)
- Scandinavian: 8 (1.8%)
- Lebanese: 5 (1.1%)
- Swedish: 5 (1.1%)
- Yugoslavian: 1 (0.2%)
Most common places of birth for foreign-born residents (%):
| Wenona: | 80.0% (28) |
| Illinois: | 34.7% (626,958) |
| Wenona: | 14.3% (5) |
| Illinois: | 0.2% (3,080) |
| Wenona: | 2.9% (1) |
| Illinois: | 1.0% (18,753) |
Place of birth for U.S.-born residents:
- This state: 850
- Other state: 137
- Northeast: 9
- Midwest: 49
- South: 48
- West: 30
89.4% of Wenona residents lived in the same house 1 years ago.
Out of people who lived in different houses, 25.4% lived in this county.
Out of people who lived in different counties, 80.9% lived in Illinois.
| Wenona: | 89.4% |
| State average: | 88.3% |
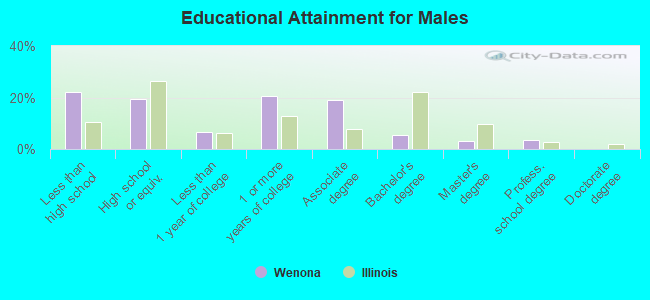
Education attainment for males 25 years and older:
- No schooling: 0
- Nursery to 4th grade: 0
- 5th and 6th grade: 0
- 7th and 8th grade: 0
- 9th grade: 14
- 10th grade: 13
- 11th grade: 22
- 12th grade, no diploma: 23
- High school graduate (or equivalency): 63
- Less than 1 year of college: 21
- Some college more than 1 year, no degree: 67
- Associate degree: 62
- Bachelor's degree: 18
- Master's degree: 10
- Professional school degree: 11
- Doctorate degree: 0
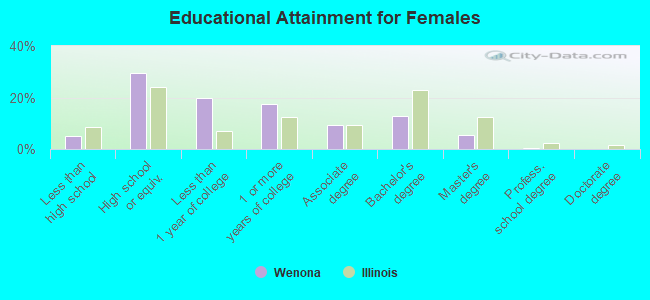
Education attainment for females 25 years and older:
- No schooling: 0
- Nursery to 4th grade: 0
- 5th and 6th grade: 0
- 7th and 8th grade: 0
- 9th grade: 4
- 10th grade: 7
- 11th grade: 2
- 12th grade, no diploma: 5
- High school graduate (or equivalency): 103
- Less than 1 year of college: 69
- Some college more than 1 year, no degree: 61
- Associate degree: 32
- Bachelor's degree: 45
- Master's degree: 19
- Professional school degree: 2
- Doctorate degree: 0
Housing units in structures:
- One, detached: 400
- One, attached: 10
- Two: 13
- 3 or 4: 62
- 5 to 9: 5
- 10 to 19: 51
- Mobile homes: 13
Housing units lacking complete kitchen facilities in 2022: 2.4%
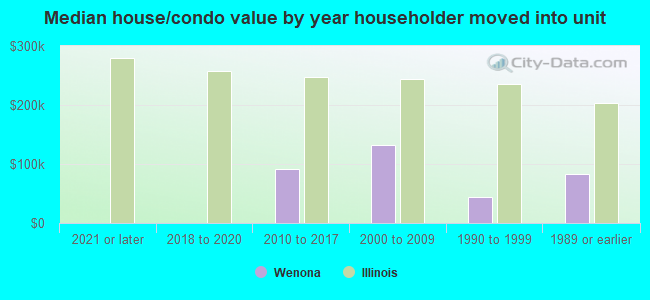
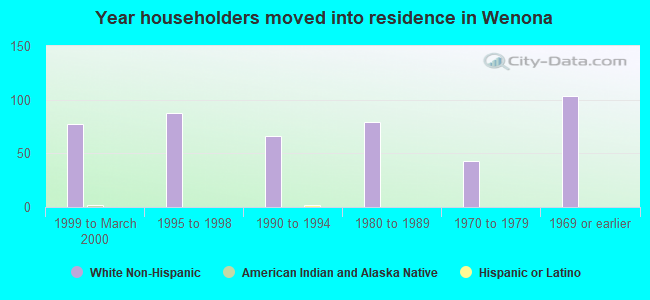
House/condo owner moved in on average 15 years ago
Renter moved in on average 2 years ago
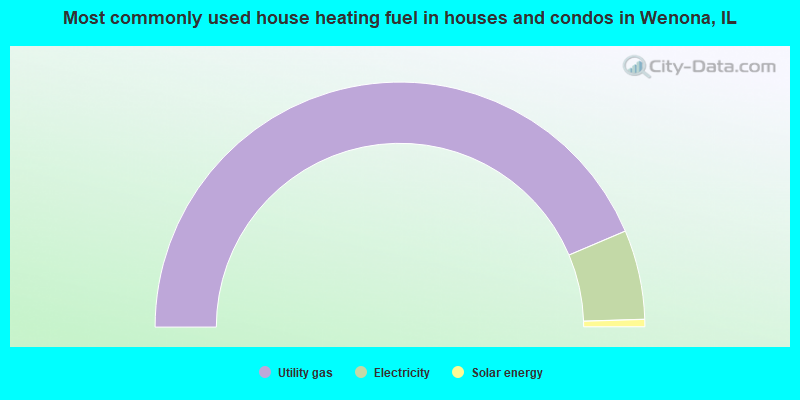
- 87.2%Utility gas
- 11.8%Electricity
- 1.0%Solar energy
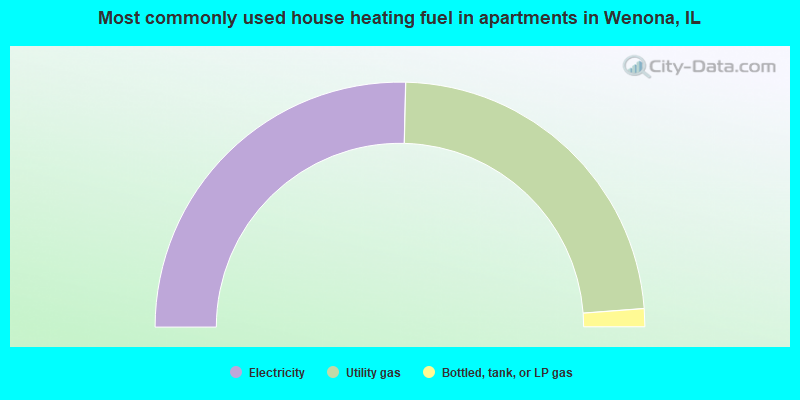
- 50.7%Electricity
- 46.8%Utility gas
- 2.4%Bottled, tank, or LP gas
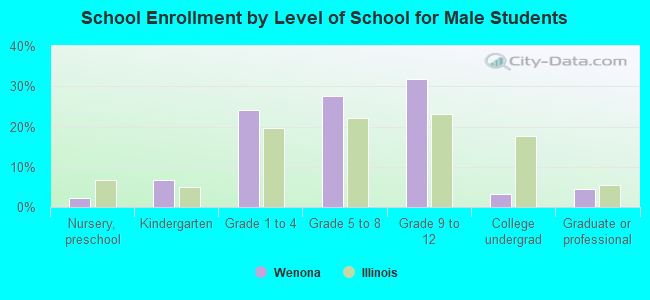
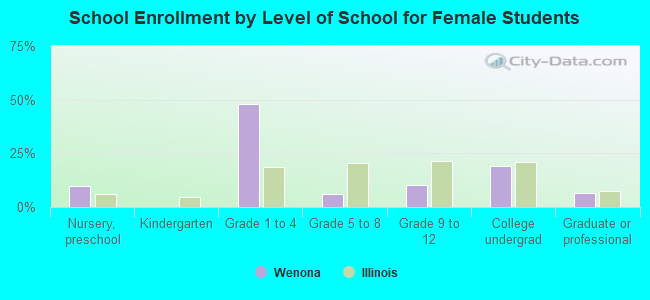
Private vs. public school enrollment:
| Here: | 5.9% |
| Illinois: | 13.3% |
| Here: | 0.0% |
| Illinois: | 9.9% |
| Here: | 0.0% |
| Illinois: | 27.4% |