Chalfont, Pennsylvania Submit your own pictures of this borough and show them to the world
OSM Map
General Map
Google Map
MSN Map
OSM Map
General Map
Google Map
MSN Map
OSM Map
General Map
Google Map
MSN Map
OSM Map
General Map
Google Map
MSN Map
Please wait while loading the map...
Population in 2022: 4,283 (100% urban, 0% rural). Population change since 2000: +9.8%Males: 2,150 Females: 2,133
March 2022 cost of living index in Chalfont: 107.1 (more than average, U.S. average is 100) Percentage of residents living in poverty in 2022: 7.2%
Profiles of local businesses
Business Search - 14 Million verified businesses
Data:
Median household income ($)
Median household income (% change since 2000)
Household income diversity
Ratio of average income to average house value (%)
Ratio of average income to average rent
Median household income ($) - White
Median household income ($) - Black or African American
Median household income ($) - Asian
Median household income ($) - Hispanic or Latino
Median household income ($) - American Indian and Alaska Native
Median household income ($) - Multirace
Median household income ($) - Other Race
Median household income for houses/condos with a mortgage ($)
Median household income for apartments without a mortgage ($)
Races - White alone (%)
Races - White alone (% change since 2000)
Races - Black alone (%)
Races - Black alone (% change since 2000)
Races - American Indian alone (%)
Races - American Indian alone (% change since 2000)
Races - Asian alone (%)
Races - Asian alone (% change since 2000)
Races - Hispanic (%)
Races - Hispanic (% change since 2000)
Races - Native Hawaiian and Other Pacific Islander alone (%)
Races - Native Hawaiian and Other Pacific Islander alone (% change since 2000)
Races - Two or more races (%)
Races - Two or more races (% change since 2000)
Races - Other race alone (%)
Races - Other race alone (% change since 2000)
Racial diversity
Unemployment (%)
Unemployment (% change since 2000)
Unemployment (%) - White
Unemployment (%) - Black or African American
Unemployment (%) - Asian
Unemployment (%) - Hispanic or Latino
Unemployment (%) - American Indian and Alaska Native
Unemployment (%) - Multirace
Unemployment (%) - Other Race
Population density (people per square mile)
Population - Males (%)
Population - Females (%)
Population - Males (%) - White
Population - Males (%) - Black or African American
Population - Males (%) - Asian
Population - Males (%) - Hispanic or Latino
Population - Males (%) - American Indian and Alaska Native
Population - Males (%) - Multirace
Population - Males (%) - Other Race
Population - Females (%) - White
Population - Females (%) - Black or African American
Population - Females (%) - Asian
Population - Females (%) - Hispanic or Latino
Population - Females (%) - American Indian and Alaska Native
Population - Females (%) - Multirace
Population - Females (%) - Other Race
Coronavirus confirmed cases (May 01, 2024)
Deaths caused by coronavirus (May 01, 2024)
Coronavirus confirmed cases (per 100k population) (May 01, 2024)
Deaths caused by coronavirus (per 100k population) (May 01, 2024)
Daily increase in number of cases (May 01, 2024)
Weekly increase in number of cases (May 01, 2024)
Cases doubled (in days) (May 01, 2024)
Hospitalized patients (Apr 18, 2022)
Negative test results (Apr 18, 2022)
Total test results (Apr 18, 2022)
COVID Vaccine doses distributed (per 100k population) (Sep 19, 2023)
COVID Vaccine doses administered (per 100k population) (Sep 19, 2023)
COVID Vaccine doses distributed (Sep 19, 2023)
COVID Vaccine doses administered (Sep 19, 2023)
Likely homosexual households (%)
Likely homosexual households (% change since 2000)
Likely homosexual households - Lesbian couples (%)
Likely homosexual households - Lesbian couples (% change since 2000)
Likely homosexual households - Gay men (%)
Likely homosexual households - Gay men (% change since 2000)
Cost of living index
Median gross rent ($)
Median contract rent ($)
Median monthly housing costs ($)
Median house or condo value ($)
Median house or condo value ($ change since 2000)
Mean house or condo value by units in structure - 1, detached ($)
Mean house or condo value by units in structure - 1, attached ($)
Mean house or condo value by units in structure - 2 ($)
Mean house or condo value by units in structure by units in structure - 3 or 4 ($)
Mean house or condo value by units in structure - 5 or more ($)
Mean house or condo value by units in structure - Boat, RV, van, etc. ($)
Mean house or condo value by units in structure - Mobile home ($)
Median house or condo value ($) - White
Median house or condo value ($) - Black or African American
Median house or condo value ($) - Asian
Median house or condo value ($) - Hispanic or Latino
Median house or condo value ($) - American Indian and Alaska Native
Median house or condo value ($) - Multirace
Median house or condo value ($) - Other Race
Median resident age
Resident age diversity
Median resident age - Males
Median resident age - Females
Median resident age - White
Median resident age - Black or African American
Median resident age - Asian
Median resident age - Hispanic or Latino
Median resident age - American Indian and Alaska Native
Median resident age - Multirace
Median resident age - Other Race
Median resident age - Males - White
Median resident age - Males - Black or African American
Median resident age - Males - Asian
Median resident age - Males - Hispanic or Latino
Median resident age - Males - American Indian and Alaska Native
Median resident age - Males - Multirace
Median resident age - Males - Other Race
Median resident age - Females - White
Median resident age - Females - Black or African American
Median resident age - Females - Asian
Median resident age - Females - Hispanic or Latino
Median resident age - Females - American Indian and Alaska Native
Median resident age - Females - Multirace
Median resident age - Females - Other Race
Commute - mean travel time to work (minutes)
Travel time to work - Less than 5 minutes (%)
Travel time to work - Less than 5 minutes (% change since 2000)
Travel time to work - 5 to 9 minutes (%)
Travel time to work - 5 to 9 minutes (% change since 2000)
Travel time to work - 10 to 19 minutes (%)
Travel time to work - 10 to 19 minutes (% change since 2000)
Travel time to work - 20 to 29 minutes (%)
Travel time to work - 20 to 29 minutes (% change since 2000)
Travel time to work - 30 to 39 minutes (%)
Travel time to work - 30 to 39 minutes (% change since 2000)
Travel time to work - 40 to 59 minutes (%)
Travel time to work - 40 to 59 minutes (% change since 2000)
Travel time to work - 60 to 89 minutes (%)
Travel time to work - 60 to 89 minutes (% change since 2000)
Travel time to work - 90 or more minutes (%)
Travel time to work - 90 or more minutes (% change since 2000)
Marital status - Never married (%)
Marital status - Now married (%)
Marital status - Separated (%)
Marital status - Widowed (%)
Marital status - Divorced (%)
Median family income ($)
Median family income (% change since 2000)
Median non-family income ($)
Median non-family income (% change since 2000)
Median per capita income ($)
Median per capita income (% change since 2000)
Median family income ($) - White
Median family income ($) - Black or African American
Median family income ($) - Asian
Median family income ($) - Hispanic or Latino
Median family income ($) - American Indian and Alaska Native
Median family income ($) - Multirace
Median family income ($) - Other Race
Median year house/condo built
Median year apartment built
Year house built - Built 2005 or later (%)
Year house built - Built 2000 to 2004 (%)
Year house built - Built 1990 to 1999 (%)
Year house built - Built 1980 to 1989 (%)
Year house built - Built 1970 to 1979 (%)
Year house built - Built 1960 to 1969 (%)
Year house built - Built 1950 to 1959 (%)
Year house built - Built 1940 to 1949 (%)
Year house built - Built 1939 or earlier (%)
Average household size
Household density (households per square mile)
Average household size - White
Average household size - Black or African American
Average household size - Asian
Average household size - Hispanic or Latino
Average household size - American Indian and Alaska Native
Average household size - Multirace
Average household size - Other Race
Occupied housing units (%)
Vacant housing units (%)
Owner occupied housing units (%)
Renter occupied housing units (%)
Vacancy status - For rent (%)
Vacancy status - For sale only (%)
Vacancy status - Rented or sold, not occupied (%)
Vacancy status - For seasonal, recreational, or occasional use (%)
Vacancy status - For migrant workers (%)
Vacancy status - Other vacant (%)
Residents with income below the poverty level (%)
Residents with income below 50% of the poverty level (%)
Children below poverty level (%)
Poor families by family type - Married-couple family (%)
Poor families by family type - Male, no wife present (%)
Poor families by family type - Female, no husband present (%)
Poverty status for native-born residents (%)
Poverty status for foreign-born residents (%)
Poverty among high school graduates not in families (%)
Poverty among people who did not graduate high school not in families (%)
Residents with income below the poverty level (%) - White
Residents with income below the poverty level (%) - Black or African American
Residents with income below the poverty level (%) - Asian
Residents with income below the poverty level (%) - Hispanic or Latino
Residents with income below the poverty level (%) - American Indian and Alaska Native
Residents with income below the poverty level (%) - Multirace
Residents with income below the poverty level (%) - Other Race
Air pollution - Air Quality Index (AQI)
Air pollution - CO
Air pollution - NO2
Air pollution - SO2
Air pollution - Ozone
Air pollution - PM10
Air pollution - PM25
Air pollution - Pb
Crime - Murders per 100,000 population
Crime - Rapes per 100,000 population
Crime - Robberies per 100,000 population
Crime - Assaults per 100,000 population
Crime - Burglaries per 100,000 population
Crime - Thefts per 100,000 population
Crime - Auto thefts per 100,000 population
Crime - Arson per 100,000 population
Crime - City-data.com crime index
Crime - Violent crime index
Crime - Property crime index
Crime - Murders per 100,000 population (5 year average)
Crime - Rapes per 100,000 population (5 year average)
Crime - Robberies per 100,000 population (5 year average)
Crime - Assaults per 100,000 population (5 year average)
Crime - Burglaries per 100,000 population (5 year average)
Crime - Thefts per 100,000 population (5 year average)
Crime - Auto thefts per 100,000 population (5 year average)
Crime - Arson per 100,000 population (5 year average)
Crime - City-data.com crime index (5 year average)
Crime - Violent crime index (5 year average)
Crime - Property crime index (5 year average)
1996 Presidential Elections Results (%) - Democratic Party (Clinton)
1996 Presidential Elections Results (%) - Republican Party (Dole)
1996 Presidential Elections Results (%) - Other
2000 Presidential Elections Results (%) - Democratic Party (Gore)
2000 Presidential Elections Results (%) - Republican Party (Bush)
2000 Presidential Elections Results (%) - Other
2004 Presidential Elections Results (%) - Democratic Party (Kerry)
2004 Presidential Elections Results (%) - Republican Party (Bush)
2004 Presidential Elections Results (%) - Other
2008 Presidential Elections Results (%) - Democratic Party (Obama)
2008 Presidential Elections Results (%) - Republican Party (McCain)
2008 Presidential Elections Results (%) - Other
2012 Presidential Elections Results (%) - Democratic Party (Obama)
2012 Presidential Elections Results (%) - Republican Party (Romney)
2012 Presidential Elections Results (%) - Other
2016 Presidential Elections Results (%) - Democratic Party (Clinton)
2016 Presidential Elections Results (%) - Republican Party (Trump)
2016 Presidential Elections Results (%) - Other
2020 Presidential Elections Results (%) - Democratic Party (Biden)
2020 Presidential Elections Results (%) - Republican Party (Trump)
2020 Presidential Elections Results (%) - Other
Ancestries Reported - Arab (%)
Ancestries Reported - Czech (%)
Ancestries Reported - Danish (%)
Ancestries Reported - Dutch (%)
Ancestries Reported - English (%)
Ancestries Reported - French (%)
Ancestries Reported - French Canadian (%)
Ancestries Reported - German (%)
Ancestries Reported - Greek (%)
Ancestries Reported - Hungarian (%)
Ancestries Reported - Irish (%)
Ancestries Reported - Italian (%)
Ancestries Reported - Lithuanian (%)
Ancestries Reported - Norwegian (%)
Ancestries Reported - Polish (%)
Ancestries Reported - Portuguese (%)
Ancestries Reported - Russian (%)
Ancestries Reported - Scotch-Irish (%)
Ancestries Reported - Scottish (%)
Ancestries Reported - Slovak (%)
Ancestries Reported - Subsaharan African (%)
Ancestries Reported - Swedish (%)
Ancestries Reported - Swiss (%)
Ancestries Reported - Ukrainian (%)
Ancestries Reported - United States (%)
Ancestries Reported - Welsh (%)
Ancestries Reported - West Indian (%)
Ancestries Reported - Other (%)
Educational Attainment - No schooling completed (%)
Educational Attainment - Less than high school (%)
Educational Attainment - High school or equivalent (%)
Educational Attainment - Less than 1 year of college (%)
Educational Attainment - 1 or more years of college (%)
Educational Attainment - Associate degree (%)
Educational Attainment - Bachelor's degree (%)
Educational Attainment - Master's degree (%)
Educational Attainment - Professional school degree (%)
Educational Attainment - Doctorate degree (%)
School Enrollment - Nursery, preschool (%)
School Enrollment - Kindergarten (%)
School Enrollment - Grade 1 to 4 (%)
School Enrollment - Grade 5 to 8 (%)
School Enrollment - Grade 9 to 12 (%)
School Enrollment - College undergrad (%)
School Enrollment - Graduate or professional (%)
School Enrollment - Not enrolled in school (%)
School enrollment - Public schools (%)
School enrollment - Private schools (%)
School enrollment - Not enrolled (%)
Median number of rooms in houses and condos
Median number of rooms in apartments
Housing units lacking complete plumbing facilities (%)
Housing units lacking complete kitchen facilities (%)
Density of houses
Urban houses (%)
Rural houses (%)
Households with people 60 years and over (%)
Households with people 65 years and over (%)
Households with people 75 years and over (%)
Households with one or more nonrelatives (%)
Households with no nonrelatives (%)
Population in households (%)
Family households (%)
Nonfamily households (%)
Population in families (%)
Family households with own children (%)
Median number of bedrooms in owner occupied houses
Mean number of bedrooms in owner occupied houses
Median number of bedrooms in renter occupied houses
Mean number of bedrooms in renter occupied houses
Median number of vehichles in owner occupied houses
Mean number of vehichles in owner occupied houses
Median number of vehichles in renter occupied houses
Mean number of vehichles in renter occupied houses
Mortgage status - with mortgage (%)
Mortgage status - with second mortgage (%)
Mortgage status - with home equity loan (%)
Mortgage status - with both second mortgage and home equity loan (%)
Mortgage status - without a mortgage (%)
Average family size
Average family size - White
Average family size - Black or African American
Average family size - Asian
Average family size - Hispanic or Latino
Average family size - American Indian and Alaska Native
Average family size - Multirace
Average family size - Other Race
Geographical mobility - Same house 1 year ago (%)
Geographical mobility - Moved within same county (%)
Geographical mobility - Moved from different county within same state (%)
Geographical mobility - Moved from different state (%)
Geographical mobility - Moved from abroad (%)
Place of birth - Born in state of residence (%)
Place of birth - Born in other state (%)
Place of birth - Native, outside of US (%)
Place of birth - Foreign born (%)
Housing units in structures - 1, detached (%)
Housing units in structures - 1, attached (%)
Housing units in structures - 2 (%)
Housing units in structures - 3 or 4 (%)
Housing units in structures - 5 to 9 (%)
Housing units in structures - 10 to 19 (%)
Housing units in structures - 20 to 49 (%)
Housing units in structures - 50 or more (%)
Housing units in structures - Mobile home (%)
Housing units in structures - Boat, RV, van, etc. (%)
House/condo owner moved in on average (years ago)
Renter moved in on average (years ago)
Year householder moved into unit - Moved in 1999 to March 2000 (%)
Year householder moved into unit - Moved in 1995 to 1998 (%)
Year householder moved into unit - Moved in 1990 to 1994 (%)
Year householder moved into unit - Moved in 1980 to 1989 (%)
Year householder moved into unit - Moved in 1970 to 1979 (%)
Year householder moved into unit - Moved in 1969 or earlier (%)
Means of transportation to work - Drove car alone (%)
Means of transportation to work - Carpooled (%)
Means of transportation to work - Public transportation (%)
Means of transportation to work - Bus or trolley bus (%)
Means of transportation to work - Streetcar or trolley car (%)
Means of transportation to work - Subway or elevated (%)
Means of transportation to work - Railroad (%)
Means of transportation to work - Ferryboat (%)
Means of transportation to work - Taxicab (%)
Means of transportation to work - Motorcycle (%)
Means of transportation to work - Bicycle (%)
Means of transportation to work - Walked (%)
Means of transportation to work - Other means (%)
Working at home (%)
Industry diversity
Most Common Industries - Agriculture, forestry, fishing and hunting, and mining (%)
Most Common Industries - Agriculture, forestry, fishing and hunting (%)
Most Common Industries - Mining, quarrying, and oil and gas extraction (%)
Most Common Industries - Construction (%)
Most Common Industries - Manufacturing (%)
Most Common Industries - Wholesale trade (%)
Most Common Industries - Retail trade (%)
Most Common Industries - Transportation and warehousing, and utilities (%)
Most Common Industries - Transportation and warehousing (%)
Most Common Industries - Utilities (%)
Most Common Industries - Information (%)
Most Common Industries - Finance and insurance, and real estate and rental and leasing (%)
Most Common Industries - Finance and insurance (%)
Most Common Industries - Real estate and rental and leasing (%)
Most Common Industries - Professional, scientific, and management, and administrative and waste management services (%)
Most Common Industries - Professional, scientific, and technical services (%)
Most Common Industries - Management of companies and enterprises (%)
Most Common Industries - Administrative and support and waste management services (%)
Most Common Industries - Educational services, and health care and social assistance (%)
Most Common Industries - Educational services (%)
Most Common Industries - Health care and social assistance (%)
Most Common Industries - Arts, entertainment, and recreation, and accommodation and food services (%)
Most Common Industries - Arts, entertainment, and recreation (%)
Most Common Industries - Accommodation and food services (%)
Most Common Industries - Other services, except public administration (%)
Most Common Industries - Public administration (%)
Occupation diversity
Most Common Occupations - Management, business, science, and arts occupations (%)
Most Common Occupations - Management, business, and financial occupations (%)
Most Common Occupations - Management occupations (%)
Most Common Occupations - Business and financial operations occupations (%)
Most Common Occupations - Computer, engineering, and science occupations (%)
Most Common Occupations - Computer and mathematical occupations (%)
Most Common Occupations - Architecture and engineering occupations (%)
Most Common Occupations - Life, physical, and social science occupations (%)
Most Common Occupations - Education, legal, community service, arts, and media occupations (%)
Most Common Occupations - Community and social service occupations (%)
Most Common Occupations - Legal occupations (%)
Most Common Occupations - Education, training, and library occupations (%)
Most Common Occupations - Arts, design, entertainment, sports, and media occupations (%)
Most Common Occupations - Healthcare practitioners and technical occupations (%)
Most Common Occupations - Health diagnosing and treating practitioners and other technical occupations (%)
Most Common Occupations - Health technologists and technicians (%)
Most Common Occupations - Service occupations (%)
Most Common Occupations - Healthcare support occupations (%)
Most Common Occupations - Protective service occupations (%)
Most Common Occupations - Fire fighting and prevention, and other protective service workers including supervisors (%)
Most Common Occupations - Law enforcement workers including supervisors (%)
Most Common Occupations - Food preparation and serving related occupations (%)
Most Common Occupations - Building and grounds cleaning and maintenance occupations (%)
Most Common Occupations - Personal care and service occupations (%)
Most Common Occupations - Sales and office occupations (%)
Most Common Occupations - Sales and related occupations (%)
Most Common Occupations - Office and administrative support occupations (%)
Most Common Occupations - Natural resources, construction, and maintenance occupations (%)
Most Common Occupations - Farming, fishing, and forestry occupations (%)
Most Common Occupations - Construction and extraction occupations (%)
Most Common Occupations - Installation, maintenance, and repair occupations (%)
Most Common Occupations - Production, transportation, and material moving occupations (%)
Most Common Occupations - Production occupations (%)
Most Common Occupations - Transportation occupations (%)
Most Common Occupations - Material moving occupations (%)
People in Group quarters - Institutionalized population (%)
People in Group quarters - Correctional institutions (%)
People in Group quarters - Federal prisons and detention centers (%)
People in Group quarters - Halfway houses (%)
People in Group quarters - Local jails and other confinement facilities (including police lockups) (%)
People in Group quarters - Military disciplinary barracks (%)
People in Group quarters - State prisons (%)
People in Group quarters - Other types of correctional institutions (%)
People in Group quarters - Nursing homes (%)
People in Group quarters - Hospitals/wards, hospices, and schools for the handicapped (%)
People in Group quarters - Hospitals/wards and hospices for chronically ill (%)
People in Group quarters - Hospices or homes for chronically ill (%)
People in Group quarters - Military hospitals or wards for chronically ill (%)
People in Group quarters - Other hospitals or wards for chronically ill (%)
People in Group quarters - Hospitals or wards for drug/alcohol abuse (%)
People in Group quarters - Mental (Psychiatric) hospitals or wards (%)
People in Group quarters - Schools, hospitals, or wards for the mentally retarded (%)
People in Group quarters - Schools, hospitals, or wards for the physically handicapped (%)
People in Group quarters - Institutions for the deaf (%)
People in Group quarters - Institutions for the blind (%)
People in Group quarters - Orthopedic wards and institutions for the physically handicapped (%)
People in Group quarters - Wards in general hospitals for patients who have no usual home elsewhere (%)
People in Group quarters - Wards in military hospitals for patients who have no usual home elsewhere (%)
People in Group quarters - Juvenile institutions (%)
People in Group quarters - Long-term care (%)
People in Group quarters - Homes for abused, dependent, and neglected children (%)
People in Group quarters - Residential treatment centers for emotionally disturbed children (%)
People in Group quarters - Training schools for juvenile delinquents (%)
People in Group quarters - Short-term care, detention or diagnostic centers for delinquent children (%)
People in Group quarters - Type of juvenile institution unknown (%)
People in Group quarters - Noninstitutionalized population (%)
People in Group quarters - College dormitories (includes college quarters off campus) (%)
People in Group quarters - Military quarters (%)
People in Group quarters - On base (%)
People in Group quarters - Barracks, unaccompanied personnel housing (UPH), (Enlisted/Officer), ;and similar group living quarters for military personnel (%)
People in Group quarters - Transient quarters for temporary residents (%)
People in Group quarters - Military ships (%)
People in Group quarters - Group homes (%)
People in Group quarters - Homes or halfway houses for drug/alcohol abuse (%)
People in Group quarters - Homes for the mentally ill (%)
People in Group quarters - Homes for the mentally retarded (%)
People in Group quarters - Homes for the physically handicapped (%)
People in Group quarters - Other group homes (%)
People in Group quarters - Religious group quarters (%)
People in Group quarters - Dormitories (%)
People in Group quarters - Agriculture workers' dormitories on farms (%)
People in Group quarters - Job Corps and vocational training facilities (%)
People in Group quarters - Other workers' dormitories (%)
People in Group quarters - Crews of maritime vessels (%)
People in Group quarters - Other nonhousehold living situations (%)
People in Group quarters - Other noninstitutional group quarters (%)
Residents speaking English at home (%)
Residents speaking English at home - Born in the United States (%)
Residents speaking English at home - Native, born elsewhere (%)
Residents speaking English at home - Foreign born (%)
Residents speaking Spanish at home (%)
Residents speaking Spanish at home - Born in the United States (%)
Residents speaking Spanish at home - Native, born elsewhere (%)
Residents speaking Spanish at home - Foreign born (%)
Residents speaking other language at home (%)
Residents speaking other language at home - Born in the United States (%)
Residents speaking other language at home - Native, born elsewhere (%)
Residents speaking other language at home - Foreign born (%)
Class of Workers - Employee of private company (%)
Class of Workers - Self-employed in own incorporated business (%)
Class of Workers - Private not-for-profit wage and salary workers (%)
Class of Workers - Local government workers (%)
Class of Workers - State government workers (%)
Class of Workers - Federal government workers (%)
Class of Workers - Self-employed workers in own not incorporated business and Unpaid family workers (%)
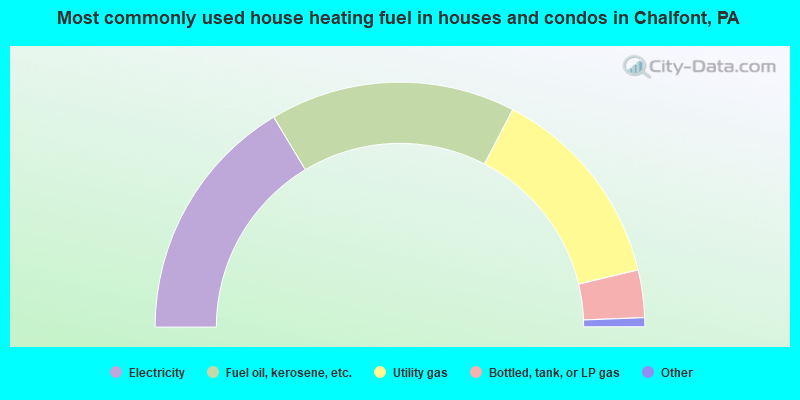
House heating fuel used in houses and condos - Utility gas (%)
House heating fuel used in houses and condos - Bottled, tank, or LP gas (%)
House heating fuel used in houses and condos - Electricity (%)
House heating fuel used in houses and condos - Fuel oil, kerosene, etc. (%)
House heating fuel used in houses and condos - Coal or coke (%)
House heating fuel used in houses and condos - Wood (%)
House heating fuel used in houses and condos - Solar energy (%)
House heating fuel used in houses and condos - Other fuel (%)
House heating fuel used in houses and condos - No fuel used (%)
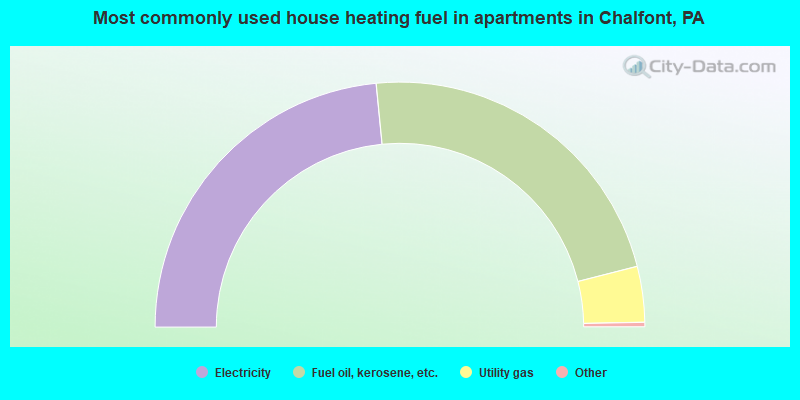
House heating fuel used in apartments - Utility gas (%)
House heating fuel used in apartments - Bottled, tank, or LP gas (%)
House heating fuel used in apartments - Electricity (%)
House heating fuel used in apartments - Fuel oil, kerosene, etc. (%)
House heating fuel used in apartments - Coal or coke (%)
House heating fuel used in apartments - Wood (%)
House heating fuel used in apartments - Solar energy (%)
House heating fuel used in apartments - Other fuel (%)
House heating fuel used in apartments - No fuel used (%)
Armed forces status - In Armed Forces (%)
Armed forces status - Civilian (%)
Armed forces status - Civilian - Veteran (%)
Armed forces status - Civilian - Nonveteran (%)
Fatal accidents locations in years 2005-2021
Fatal accidents locations in 2005
Fatal accidents locations in 2006
Fatal accidents locations in 2007
Fatal accidents locations in 2008
Fatal accidents locations in 2009
Fatal accidents locations in 2010
Fatal accidents locations in 2011
Fatal accidents locations in 2012
Fatal accidents locations in 2013
Fatal accidents locations in 2014
Fatal accidents locations in 2015
Fatal accidents locations in 2016
Fatal accidents locations in 2017
Fatal accidents locations in 2018
Fatal accidents locations in 2019
Fatal accidents locations in 2020
Fatal accidents locations in 2021
Alcohol use - People drinking some alcohol every month (%)
Alcohol use - People not drinking at all (%)
Alcohol use - Average days/month drinking alcohol
Alcohol use - Average drinks/week
Alcohol use - Average days/year people drink much
Audiometry - Average condition of hearing (%)
Audiometry - People that can hear a whisper from across a quiet room (%)
Audiometry - People that can hear normal voice from across a quiet room (%)
Audiometry - Ears ringing, roaring, buzzing (%)
Audiometry - Had a job exposure to loud noise (%)
Audiometry - Had off-work exposure to loud noise (%)
Blood Pressure & Cholesterol - Has high blood pressure (%)
Blood Pressure & Cholesterol - Checking blood pressure at home (%)
Blood Pressure & Cholesterol - Frequently checking blood cholesterol (%)
Blood Pressure & Cholesterol - Has high cholesterol level (%)
Consumer Behavior - Money monthly spent on food at supermarket/grocery store
Consumer Behavior - Money monthly spent on food at other stores
Consumer Behavior - Money monthly spent on eating out
Consumer Behavior - Money monthly spent on carryout/delivered foods
Consumer Behavior - Income spent on food at supermarket/grocery store (%)
Consumer Behavior - Income spent on food at other stores (%)
Consumer Behavior - Income spent on eating out (%)
Consumer Behavior - Income spent on carryout/delivered foods (%)
Current Health Status - General health condition (%)
Current Health Status - Blood donors (%)
Current Health Status - Has blood ever tested for HIV virus (%)
Current Health Status - Left-handed people (%)
Dermatology - People using sunscreen (%)
Diabetes - Diabetics (%)
Diabetes - Had a blood test for high blood sugar (%)
Diabetes - People taking insulin (%)
Diet Behavior & Nutrition - Diet health (%)
Diet Behavior & Nutrition - Milk product consumption (# of products/month)
Diet Behavior & Nutrition - Meals not home prepared (#/week)
Diet Behavior & Nutrition - Meals from fast food or pizza place (#/week)
Diet Behavior & Nutrition - Ready-to-eat foods (#/month)
Diet Behavior & Nutrition - Frozen meals/pizza (#/month)
Drug Use - People that ever used marijuana or hashish (%)
Drug Use - Ever used hard drugs (%)
Drug Use - Ever used any form of cocaine (%)
Drug Use - Ever used heroin (%)
Drug Use - Ever used methamphetamine (%)
Health Insurance - People covered by health insurance (%)
Kidney Conditions-Urology - Avg. # of times urinating at night
Medical Conditions - People with asthma (%)
Medical Conditions - People with anemia (%)
Medical Conditions - People with psoriasis (%)
Medical Conditions - People with overweight (%)
Medical Conditions - Elderly people having difficulties in thinking or remembering (%)
Medical Conditions - People who ever received blood transfusion (%)
Medical Conditions - People having trouble seeing even with glass/contacts (%)
Medical Conditions - People with arthritis (%)
Medical Conditions - People with gout (%)
Medical Conditions - People with congestive heart failure (%)
Medical Conditions - People with coronary heart disease (%)
Medical Conditions - People with angina pectoris (%)
Medical Conditions - People who ever had heart attack (%)
Medical Conditions - People who ever had stroke (%)
Medical Conditions - People with emphysema (%)
Medical Conditions - People with thyroid problem (%)
Medical Conditions - People with chronic bronchitis (%)
Medical Conditions - People with any liver condition (%)
Medical Conditions - People who ever had cancer or malignancy (%)
Mental Health - People who have little interest in doing things (%)
Mental Health - People feeling down, depressed, or hopeless (%)
Mental Health - People who have trouble sleeping or sleeping too much (%)
Mental Health - People feeling tired or having little energy (%)
Mental Health - People with poor appetite or overeating (%)
Mental Health - People feeling bad about themself (%)
Mental Health - People who have trouble concentrating on things (%)
Mental Health - People moving or speaking slowly or too fast (%)
Mental Health - People having thoughts they would be better off dead (%)
Oral Health - Average years since last visit a dentist
Oral Health - People embarrassed because of mouth (%)
Oral Health - People with gum disease (%)
Oral Health - General health of teeth and gums (%)
Oral Health - Average days a week using dental floss/device
Oral Health - Average days a week using mouthwash for dental problem
Oral Health - Average number of teeth
Pesticide Use - Households using pesticides to control insects (%)
Pesticide Use - Households using pesticides to kill weeds (%)
Physical Activity - People doing vigorous-intensity work activities (%)
Physical Activity - People doing moderate-intensity work activities (%)
Physical Activity - People walking or bicycling (%)
Physical Activity - People doing vigorous-intensity recreational activities (%)
Physical Activity - People doing moderate-intensity recreational activities (%)
Physical Activity - Average hours a day doing sedentary activities
Physical Activity - Average hours a day watching TV or videos
Physical Activity - Average hours a day using computer
Physical Functioning - People having limitations keeping them from working (%)
Physical Functioning - People limited in amount of work they can do (%)
Physical Functioning - People that need special equipment to walk (%)
Physical Functioning - People experiencing confusion/memory problems (%)
Physical Functioning - People requiring special healthcare equipment (%)
Prescription Medications - Average number of prescription medicines taking
Preventive Aspirin Use - Adults 40+ taking low-dose aspirin (%)
Reproductive Health - Vaginal deliveries (%)
Reproductive Health - Cesarean deliveries (%)
Reproductive Health - Deliveries resulted in a live birth (%)
Reproductive Health - Pregnancies resulted in a delivery (%)
Reproductive Health - Women breastfeeding newborns (%)
Reproductive Health - Women that had a hysterectomy (%)
Reproductive Health - Women that had both ovaries removed (%)
Reproductive Health - Women that have ever taken birth control pills (%)
Reproductive Health - Women taking birth control pills (%)
Reproductive Health - Women that have ever used Depo-Provera or injectables (%)
Reproductive Health - Women that have ever used female hormones (%)
Sexual Behavior - People 18+ that ever had sex (vaginal, anal, or oral) (%)
Sexual Behavior - Males 18+ that ever had vaginal sex with a woman (%)
Sexual Behavior - Males 18+ that ever performed oral sex on a woman (%)
Sexual Behavior - Males 18+ that ever had anal sex with a woman (%)
Sexual Behavior - Males 18+ that ever had any sex with a man (%)
Sexual Behavior - Females 18+ that ever had vaginal sex with a man (%)
Sexual Behavior - Females 18+ that ever performed oral sex on a man (%)
Sexual Behavior - Females 18+ that ever had anal sex with a man (%)
Sexual Behavior - Females 18+ that ever had any kind of sex with a woman (%)
Sexual Behavior - Average age people first had sex
Sexual Behavior - Average number of female sex partners in lifetime (males 18+)
Sexual Behavior - Average number of female vaginal sex partners in lifetime (males 18+)
Sexual Behavior - Average age people first performed oral sex on a woman (18+)
Sexual Behavior - Average number of woman performed oral sex on in lifetime (18+)
Sexual Behavior - Average number of male sex partners in lifetime (males 18+)
Sexual Behavior - Average number of male anal sex partners in lifetime (males 18+)
Sexual Behavior - Average age people first performed oral sex on a man (18+)
Sexual Behavior - Average number of male oral sex partners in lifetime (18+)
Sexual Behavior - People using protection when performing oral sex (%)
Sexual Behavior - Average number of times people have vaginal or anal sex a year
Sexual Behavior - People having sex without condom (%)
Sexual Behavior - Average number of male sex partners in lifetime (females 18+)
Sexual Behavior - Average number of male vaginal sex partners in lifetime (females 18+)
Sexual Behavior - Average number of female sex partners in lifetime (females 18+)
Sexual Behavior - Circumcised males 18+ (%)
Sleep Disorders - Average hours sleeping at night
Sleep Disorders - People that has trouble sleeping (%)
Smoking-Cigarette Use - People smoking cigarettes (%)
Taste & Smell - People 40+ having problems with smell (%)
Taste & Smell - People 40+ having problems with taste (%)
Taste & Smell - People 40+ that ever had wisdom teeth removed (%)
Taste & Smell - People 40+ that ever had tonsils teeth removed (%)
Taste & Smell - People 40+ that ever had a loss of consciousness because of a head injury (%)
Taste & Smell - People 40+ that ever had a broken nose or other serious injury to face or skull (%)
Taste & Smell - People 40+ that ever had two or more sinus infections (%)
Weight - Average height (inches)
Weight - Average weight (pounds)
Weight - Average BMI
Weight - People that are obese (%)
Weight - People that ever were obese (%)
Weight - People trying to lose weight (%)
Latest news from Chalfont, PA collected exclusively by city-data.com from local newspapers, TV, and radio stations
Chalfont, PA City Guides: Ancestries: Italian (16.9%), Irish (16.2%), German (12.2%), Ethiopian (8.1%), European (6.0%), Albanian (4.7%).
Current Local Time:
Incorporated on 06/11/1901
Land area: 1.65 square miles.
Population density: 2,598 people per square mile (average).
520 residents are foreign born (4.5% Asia , 3.0% Africa , 2.8% Europe , 1.3% Latin America ).
This borough:
12.2%Pennsylvania:
7.3%
Median real estate property taxes paid for housing units with mortgages in 2022: $5,276 (1.2%)Median real estate property taxes paid for housing units with no mortgage in 2022: $4,781 (1.2%)
Nearest city with pop. 50,000+: Philadelphia, PA
Nearest cities:
Latitude: 40.29 N, Longitude: 75.21 W
Unemployment in December 2023: Here:
2.5%Pennsylvania:
2.9%
Population change in the 1990s: +939 (+31.7%).
Most common occupations in Chalfont, PA (%)
Both Males Females
Other management occupations, except farmers and farm managers (5.7%)
Other office and administrative support workers, including supervisors (5.0%)
Sales representatives, services, wholesale and manufacturing (4.8%)
Computer specialists (4.7%)
Other production occupations, including supervisors (4.5%)
Preschool, kindergarten, elementary, and middle school teachers (3.7%)
Registered nurses (3.5%)
Other management occupations, except farmers and farm managers (9.7%)
Computer specialists (6.5%)
Other production occupations, including supervisors (6.3%)
Sales representatives, services, wholesale and manufacturing (6.1%)
Electrical equipment mechanics and other installation, maintenance, and repair workers, including supervisors (5.2%)
Building and grounds cleaning and maintenance occupations (3.9%)
Driver/sales workers and truck drivers (3.8%)
Other office and administrative support workers, including supervisors (9.3%)
Registered nurses (7.5%)
Secretaries and administrative assistants (6.2%)
Other teachers, instructors, education, training, and library occupations (5.1%)
Information and record clerks, except customer service representatives (4.6%)
Retail sales workers, except cashiers (4.3%)
Preschool, kindergarten, elementary, and middle school teachers (4.0%)
Tornado activity:
Chalfont-area historical tornado activity is slightly above Pennsylvania state average. It is 1% greater than the overall U.S. average.
On 7/27/1994, a category F3 (max. wind speeds 158-206 mph) tornado 16.9 miles away from the Chalfont borough center killed 3 people and injured 25 people and caused between $5,000,000 and $50,000,000 in damages.
On 3/22/1955, a category F3 tornado 21.5 miles away from the borough center killed one person and caused between $50,000 and $500,000 in damages.
Earthquake activity:
Chalfont-area historical earthquake activity is significantly above Pennsylvania state average. It is 67% smaller than the overall U.S. average. On 8/23/2011 at 17:51:04, a magnitude 5.8 (5.8 MW, Depth: 3.7 mi, Class: Moderate, Intensity: VI - VII) earthquake occurred 220.2 miles away from the city center On 1/16/1994 at 01:49:16, a magnitude 4.6 (4.6 MB, 4.6 LG, Depth: 3.1 mi, Class: Light, Intensity: IV - V) earthquake occurred 43.7 miles away from the city center On 10/7/1983 at 10:18:46, a magnitude 5.3 (5.1 MB, 5.3 LG, 5.1 ML) earthquake occurred 257.3 miles away from Chalfont center On 1/16/1994 at 00:42:43, a magnitude 4.2 (4.2 MB, 4.0 LG, Depth: 3.1 mi) earthquake occurred 42.1 miles away from Chalfont center On 9/25/1998 at 19:52:52, a magnitude 5.2 (4.8 MB, 4.3 MS, 5.2 LG, 4.5 MW, Depth: 3.1 mi) earthquake occurred 283.5 miles away from Chalfont center On 4/20/2002 at 10:50:47, a magnitude 5.3 (5.3 ML, Depth: 3.0 mi) earthquake occurred 302.1 miles away from Chalfont center Magnitude types: regional Lg-wave magnitude (LG), body-wave magnitude (MB), local magnitude (ML), surface-wave magnitude (MS), moment magnitude (MW) Natural disasters: The number of natural disasters in Bucks County (24) is greater than the US average (15).Major Disasters (Presidential) Declared: 19Emergencies Declared: 5Floods: 6, Hurricanes: 6, Storms: 4, Tropical Storms: 4, Winter Storms: 4, Blizzard: 1, Mudslide: 1, Snowfall: 1, Snowstorm: 1, Tropical Depression: 1, Water Shortage: 1, Other: 1 (Note: some incidents may be assigned to more than one category). Hospitals and medical centers in Chalfont: UNIQUE AID (978 HICKORY RIDGE DRIVE)
Other hospitals and medical centers near Chalfont: BARC/BLYTHEWOOD (Hospital, about 2 miles away; DOYLESTOWN, PA)
MANORCARE HEALTH SERVICES-LANSDALE (Nursing Home, about 3 miles away; MONTGOMERYVILLE, PA)
MEDICAL CTR AGING DOYLESTOWN (Nursing Home, about 3 miles away; DOYLESTOWN, PA)
PINE RUN HEALTH CENTER (Nursing Home, about 3 miles away; DOYLESTOWN, PA)
EVERGREEN TERRACE (Nursing Home, about 3 miles away; NEW BRITAIN, PA)
FOUNDATIONS BEHAVIORAL HEALTH (Hospital, about 3 miles away; DOYLESTOWN, PA)
AT HOME REHAB LLC (Home Health Center, about 4 miles away; DOYLESTOWN, PA)
Amtrak station near Chalfont: 20 miles: ARDMORE (STATION RD. & LANCASTER AVE.) Services: enclosed waiting area, public restrooms, public payphones, paid short-term parking, call for car rental service, call for taxi service, public transit connection.
Colleges/universities with over 2000 students nearest to Chalfont:
Delaware Valley College (about 3 miles; Doylestown, PA ; Full-time enrollment: 2,025)
Gwynedd Mercy University (about 7 miles; Gwynedd Valley, PA ; FT enrollment: 2,125)
Montgomery County Community College (about 9 miles; Blue Bell, PA ; FT enrollment: 8,723)
Pennsylvania State University-Penn State Abington (about 14 miles; Abington, PA ; FT enrollment: 3,155)
Bucks County Community College (about 14 miles; Newtown, PA ; FT enrollment: 6,898)
Arcadia University (about 14 miles; Glenside, PA ; FT enrollment: 3,542)
Strayer University-Pennsylvania (about 17 miles; Trevose, PA ; FT enrollment: 2,027)
Public high school in Chalfont: UNAMI MS Students: 976, Location: 160 SOUTH MOYER RD, Grades: 7-9)Public elementary/middle school in Chalfont: BUTLER EL SCH Students: 804, Location: 200 BRITTANY DR, Grades: KG-6)Private elementary/middle school in Chalfont: ST JUDE CATHOLIC EDUCATION CENTER Students: 362, Location: 323 W BUTLER AVE, Grades: PK-8)
See full list of schools located in Chalfont Bucks County has a predicted average indoor radon screening level greater than 4 pCi/L (pico curies per liter) - Highest Potential Drinking water stations with addresses in Chalfont and their reported violations in the past:
TABORA FARMS AND ORCHARD (Population served: 30, Groundwater):
Past monitoring violations:
One routine major monitoring violation
Average household size: This borough:
2.7 peoplePennsylvania:
2.5 people
Percentage of family households: This borough:
74.5%Whole state:
65.0%
Percentage of households with unmarried partners: This borough:
5.1%Whole state:
6.6%
Likely homosexual households (counted as self-reported same-sex unmarried-partner households)
Lesbian couples: 0.2% of all households Gay men: 0.7% of all households
39 people in group homes intended for adults in 2010people in residential treatment centers for juveniles (non-correctional) in 2010people in other noninstitutional group quarters in 2000
Banks with branches in Chalfont (2011 data):
Wells Fargo Bank, National Association: Chalfont Branch at 4275 County Line Rd, branch established on 2000/07/01; New Britain Branch at 191 East Butler Avenue, branch established on 1968/07/01. Info updated 2011/04/05: Bank assets: $1,161,490.0 mil, Deposits: $905,653.0 mil, headquarters in Sioux Falls, SD, positive income , 6395 total offices , Holding Company: Wells Fargo & Company
Susquehanna Bank: 329 North Main Street at 329 North Main Street, branch established on 2007/04/26. Info updated 2012/02/28: Bank assets: $14,849.0 mil, Deposits: $10,294.4 mil, headquarters in Lititz, PA, positive income , Commercial Lending Specialization, 308 total offices , Holding Company: Susquehanna Bancshares, Inc.
First Niagara Bank, National Association: Chalfont Branch at 251 West Butler Avenue, branch established on 1997/03/10. Info updated 2011/06/09: Bank assets: $32,750.6 mil, Deposits: $19,595.4 mil, headquarters in Buffalo, NY, positive income , Commercial Lending Specialization, 351 total offices , Holding Company: First Niagara Financial Group, Inc.
Univest Bank and Trust Co.: Suburban Community Bank Branch at 195 East Butler Avenue, branch established on 1996/11/06. Info updated 2011/07/11: Bank assets: $2,175.3 mil, Deposits: $1,749.8 mil, headquarters in Souderton, PA, positive income , Commercial Lending Specialization, 40 total offices , Holding Company: Univest Corporation Of Pennsylvania
TD Bank, National Association: New Britain Branch at 499 West Butler Avenue, branch established on 2001/06/02. Info updated 2010/10/04: Bank assets: $188,912.6 mil, Deposits: $153,149.8 mil, headquarters in Wilmington, DE, positive income , 1314 total offices , Holding Company: Toronto-Dominion Bank, The
PNC Bank, National Association: Chalfont Branch at 280 West Butler Pike, branch established on 2007/01/30. Info updated 2012/03/20: Bank assets: $263,309.6 mil, Deposits: $197,343.0 mil, headquarters in Wilmington, DE, positive income , Commercial Lending Specialization, 3085 total offices , Holding Company: Pnc Financial Services Group, Inc., The
Citizens Bank of Pennsylvania: New Britain Acme Branch at 505 West Butler Avenue, branch established on 1997/10/16. Info updated 2010/09/24: Bank assets: $32,316.9 mil, Deposits: $25,297.1 mil, headquarters in Philadelphia, PA, positive income , 396 total offices , Holding Company: Uk Financial Investments Limited
Firstrust Savings Bank: New Britain Village Square Branch at 4275 County Line Road, branch established on 1996/06/19. Info updated 2008/10/10: Bank assets: $2,487.2 mil, Deposits: $1,995.0 mil, headquarters in Conshohocken, PA, positive income , Commercial Lending Specialization, 24 total offices
For population 15 years and over in Chalfont:
Never married: 32.2%Now married: 49.8%Separated: 4.1%Widowed: 7.5%Divorced: 6.5% For population 25 years and over in Chalfont:
High school or higher: 98.3%Bachelor's degree or higher: 63.0%Graduate or professional degree: 24.0%Unemployed: 4.3%Mean travel time to work (commute): 22.0 minutes
Education Gini index (Inequality in education) Here:
8.3Pennsylvania average:
11.4
Religion statistics for Chalfont, PA (based on Bucks County data)
Religion Adherents Congregations Catholic 321,963 41 Mainline Protestant 61,154 157 Evangelical Protestant 29,487 140 Other 16,159 46 Orthodox 777 4 Black Protestant 403 6 None 195,306 -
Source: Clifford Grammich, Kirk Hadaway, Richard Houseal, Dale E.Jones, Alexei Krindatch, Richie Stanley and Richard H.Taylor. 2012. 2010 U.S.Religion Census: Religious Congregations & Membership Study. Association of Statisticians of American Religious Bodies. Jones, Dale E., et al. 2002. Congregations and Membership in the United States 2000. Nashville, TN: Glenmary Research Center. Graphs represent county-level data
Food Environment Statistics: Number of grocery stores : 98This county :
1.58 / 10,000 pop.State :
2.04 / 10,000 pop.
Number of supercenters and club stores : 3Bucks County :
0.05 / 10,000 pop.State :
0.09 / 10,000 pop.
Number of convenience stores (no gas) : 74Here :
1.19 / 10,000 pop.Pennsylvania :
0.88 / 10,000 pop.
Number of convenience stores (with gas) : 105This county :
1.69 / 10,000 pop.Pennsylvania :
2.52 / 10,000 pop.
Number of full-service restaurants : 453This county :
7.31 / 10,000 pop.Pennsylvania :
7.12 / 10,000 pop.
Adult diabetes rate : Here :
8.2%Pennsylvania :
9.1%
Adult obesity rate : This county :
23.3%State :
27.2%
Low-income preschool obesity rate : This county :
13.9%State :
11.5%
Health and Nutrition:
Average overall health of teeth and gums : People feeling badly about themselves : People not drinking alcohol at all : Chalfont:
8.6%Pennsylvania:
10.9%
Average hours sleeping at night : Chalfont:
6.9Pennsylvania:
6.8
Overweight people : This city:
33.6%State:
34.3%
General health condition : Here:
62.4%Pennsylvania:
56.2%
Average condition of hearing : This city:
81.5%State:
78.3%
More about Health and Nutrition of Chalfont, PA Residents
Local government employment and payroll (March 2022)
Function
Full-time employees
Monthly full-time payroll
Average yearly full-time wage
Part-time employees
Monthly part-time payroll
Streets and Highways
3 $16,261 $65,044 0 $0 Other Government Administration
2 $14,882 $89,292 0 $0 Financial Administration
2 $11,842 $71,052 0 $0
Totals for Government
7 $42,985 $73,689 0 $0
Chalfont government finances - Expenditure in 2017 (per resident):
Current Operations - Regular Highways: $1,039,000 ($242.59)
Police Protection: $1,012,000 ($236.28)Central Staff Services: $597,000 ($139.39)Parks and Recreation: $153,000 ($35.72)Local Fire Protection: $143,000 ($33.39)General - Other: $103,000 ($24.05)Protective Inspection and Regulation - Other: $79,000 ($18.45)General - Interest on Debt: $13,000 ($3.04)
Chalfont government finances - Revenue in 2017 (per resident):
Charges - Other: $277,000 ($64.67)
Federal Intergovernmental - Other: $527,000 ($123.04)
Local Intergovernmental - Other: $3,000 ($0.70)
Miscellaneous - Interest Earnings: $273,000 ($63.74)
Donations From Private Sources: $249,000 ($58.14)Fines and Forfeits: $17,000 ($3.97)State Intergovernmental - Other: $307,000 ($71.68)
Tax - Property: $829,000 ($193.56)
Individual Income: $780,000 ($182.12)Documentary and Stock Transfer: $133,000 ($31.05)Public Utility License: $95,000 ($22.18)Occupation and Business License - Other: $47,000 ($10.97)
Chalfont government finances - Debt in 2017 (per resident):
Long Term Debt - Beginning Outstanding - Unspecified Public Purpose: $337,000 ($78.68)
Outstanding Unspecified Public Purpose: $311,000 ($72.61)Retired Unspecified Public Purpose: $101,000 ($23.58)Issue, Unspecified Public Purpose: $75,000 ($17.51)
Chalfont government finances - Cash and Securities in 2017 (per resident):
Other Funds - Cash and Securities: $5,526,000 ($1290.22)
5.42% of this county's 2021 resident taxpayers lived in other counties in 2020 ($97,096 average adjusted gross income )
Here:
5.42%Pennsylvania average:
5.27%
0.01% of residents moved from foreign countries ($62 average AGI )Bucks County:
0.01%Pennsylvania average:
0.01%
Top counties from which taxpayers relocated into this county between 2020 and 2021:
5.51% of this county's 2020 resident taxpayers moved to other counties in 2021 ($97,388 average adjusted gross income )
Here:
5.51%Pennsylvania average:
5.44%
0.01% of residents moved to foreign countries ($125 average AGI )Bucks County:
0.01%Pennsylvania average:
0.01%
Top counties to which taxpayers relocated from this county between 2020 and 2021:
Businesses in Chalfont, PA
Name Count Name Count
7-Eleven 2 Safeway 1 CVS 1 Starbucks 1 DHL 1 Subway 1 FedEx 3 U-Haul 2 MasterBrand Cabinets 1 UPS 3 McDonald's 1 Vons 1
Strongest AM radio stations in Chalfont:
WWJZ (640 AM; 50 kW; MOUNT HOLLY, NJ; Owner: ABC, INC.)
KYW (1060 AM; 50 kW; PHILADELPHIA, PA; Owner: INFINITY BROADCASTING OPERATIONS, INC.)
WZZD (990 AM; 50 kW; PHILADELPHIA, PA; Owner: PENNSYLVANIA MEDIA ASSOCIATES, INC.)
WISP (1570 AM; 5 kW; DOYLESTOWN, PA; Owner: HOLY SPIRIT RADIO FOUNDATION, INC.)
WNWR (1540 AM; 50 kW; PHILADELPHIA, PA)
WPEN (950 AM; 50 kW; PHILADELPHIA, PA; Owner: GREATER PHILADELPHIA RADIO, INC.)
WWDB (860 AM; daytime; 10 kW; PHILADELPHIA, PA)
WVCH (740 AM; 50 kW; CHESTER, PA; Owner: WVCH COMMUNICATIONS, INC.)
WPHT (1210 AM; 50 kW; PHILADELPHIA, PA; Owner: INFINITY BROADCASTING OPERATIONS, INC.)
WFIL (560 AM; 5 kW; PHILADELPHIA, PA; Owner: PENNSYLVANIA MEDIA ASSOCIATES, INC.)
WNPV (1440 AM; 2 kW; LANSDALE, PA; Owner: WNPV INC.)
WNAP (1110 AM; daytime; 5 kW; NORRISTOWN, PA; Owner: WNAP, INC)
WMCA (570 AM; 50 kW; NEW YORK, NY; Owner: SALEM MEDIA OF NEW YORK, LLC)
Strongest FM radio stations in Chalfont:
WBMR (91.7 FM; TELFORD, PA; Owner: UNITED MINISTRIES)
WMWX (95.7 FM; PHILADELPHIA, PA; Owner: GREATER PHILADELPHIA RADIO, INC.)
WMGK (102.9 FM; PHILADELPHIA, PA; Owner: GREATER PHILADELPHIA RADIO, INC.)
WOGL (98.1 FM; PHILADELPHIA, PA; Owner: INFINITY BROADCASTING OPERATIONS, INC.)
WSNI-FM (104.5 FM; PHILADELPHIA, PA; Owner: AMFM RADIO LICENSES, L.L.C.)
WBEB (101.1 FM; PHILADELPHIA, PA; Owner: WEAZ-FM RADIO, INC.)
WRTI (90.1 FM; PHILADELPHIA, PA; Owner: TEMPLE UNIV. OF THE COMMONWEALTH, ET)
WPHI-FM (103.9 FM; JENKINTOWN, PA; Owner: RADIO ONE LICENSES, LLC)
WYSP (94.1 FM; PHILADELPHIA, PA; Owner: INFINITY BROADCASTING OPERATIONS, INC.)
WJJZ (106.1 FM; PHILADELPHIA, PA; Owner: AMFM RADIO LICENSES, L.L.C.)
WXPN (88.5 FM; PHILADELPHIA, PA; Owner: TRUSTEES OF THE UNIVERSITY OF PENNA.)
WBYO (88.9 FM; SELLERSVILLE, PA; Owner: FOUR RIVERS COMMUNITY BROADCASTING CORP)
WHYY-FM (90.9 FM; PHILADELPHIA, PA; Owner: WHYY, INC.)
WXTU (92.5 FM; PHILADELPHIA, PA; Owner: WXTU LICENSE LIMITED PARTNERSHIP)
WDAS-FM (105.3 FM; PHILADELPHIA, PA; Owner: AMFM RADIO LICENSES, L.L.C.)
WPTP (96.5 FM; PHILADELPHIA, PA; Owner: WDAS LICENSE LIMITED PARTNERSHIP)
WUSL (98.9 FM; PHILADELPHIA, PA; Owner: AMFM RADIO LICENSES, L.L.C.)
WLEV (100.7 FM; ALLENTOWN, PA; Owner: CITADEL BROADCASTING COMPANY)
WPLY (100.3 FM; MEDIA, PA; Owner: RADIO ONE LICENSES, LLC)
WIOQ (102.1 FM; PHILADELPHIA, PA; Owner: AMFM RADIO LICENSES, L.L.C.)
TV broadcast stations around Chalfont:
KYW-TV (Channel 3; PHILADELPHIA, PA; Owner: CBS BROADCASTING INC.)
WPHL-TV (Channel 17; PHILADELPHIA, PA; Owner: TRIBUNE TELEVISION COMPANY)
WPPX (Channel 61; WILMINGTON, DE; Owner: PAXSON PHILADELPHIA LICENSE, INC.)
WPVI-TV (Channel 6; PHILADELPHIA, PA; Owner: ABC, INC.)
WPSG (Channel 57; PHILADELPHIA, PA; Owner: VIACOM STATIONS GROUP OF PHILADELPHIA INC.)
WCAU (Channel 10; PHILADELPHIA, PA; Owner: NBC SUBSIDIARY (WCAU-TV), L.P.)
WGTW (Channel 48; BURLINGTON, NJ; Owner: BRUNSON COMMUNICATIONS, INC.)
WELL-LP (Channel 8; WILLOW GROVE, ETC., PA; Owner: WORD OF GOD FELLOWSHIP, INC.)
WYBE (Channel 35; PHILADELPHIA, PA; Owner: INDEPENDENCE PUBLIC MEDIA OF PHILADELPHIA, INC.)
WTXF-TV (Channel 29; PHILADELPHIA, PA; Owner: FOX TV STATIONS OF PHILADELPHIA)
WHYY-TV (Channel 12; WILMINGTON, DE; Owner: WHYY, INC.)
WWJT-LP (Channel 7; PHILADELPHIA, PA; Owner: PHILADELPHIA TELEVISION NETWORK, INC)
WPHA-LP (Channel 63; PHILADELPHIA, PA; Owner: COMMERCIAL BROADCASTING CORP.)
WNJT (Channel 52; TRENTON, NJ; Owner: NEW JERSEY PUBLIC BROADCASTING AUTHORITY)
WFPA-CA (Channel 28; PHILADELPHIA, PA; Owner: WXTV LICENSE PARTNERSHIP, G.P.)
WFMZ-TV (Channel 69; ALLENTOWN, PA; Owner: MARANATHA BROADCASTING COMPANY, INC.)
WLVT-TV (Channel 39; ALLENTOWN, PA; Owner: LEHIGH VALLEY PUBLIC TELECOMMUNICATIONS CORP.)
WUVP (Channel 65; VINELAND, NJ; Owner: UNIVISION PHILADELPHIA LLC)
W07DC (Channel 7; ALLENTOWN/BETHLEHEM, PA; Owner: NEW YORK TIMES MANAGEMENT SERVICES)
WBPH-TV (Channel 60; BETHLEHEM, PA; Owner: SONSHINE FAMILY TELEVISION CORPORATION)
WNJN (Channel 50; MONTCLAIR, NJ; Owner: NEW JERSEY PUBLIC B/CNG AUTHORITY)
WTVE (Channel 51; READING, PA; Owner: READING BROADCASTING, INC.)
Chalfont fatal accident statistics for 1975 - 2021
Chalfont fatal accident list:
Nov 19, 1991 06:55 PM, 152, Vehicles: 1, Persons: 2, Pedestrians: 1, Fatalities: 1Vehicles: 1, Persons: 2, Fatalities: 1, Drunk persons involved: 1Vehicles: 2, Persons: 3, Fatalities: 1Vehicles: 1, Persons: 2, Fatalities: 2, Drunk persons involved: 1Vehicles: 1, Persons: 2, Fatalities: 2, Drunk persons involved: 1
National Bridge Inventory (NBI) Statistics 11 Number of bridges69ft / 21.3m Total length $1,080,000 Total costs171,129 Total average daily traffic15,469 Total average daily truck traffic
New bridges - historical statistics
1 1910-1919 2 1950-1959 1 1970-1979 1 1980-1989 2 2000-2009 4 2010-2019
See full National Bridge Inventory statistics for Chalfont, PA
FCC Registered Antenna Towers: 35 (
See the full list of FCC Registered Antenna Towers in Chalfont )
FCC Registered Broadcast Land Mobile Towers: 7
Main St At Rr (Lat: 40.290944 Lon: -75.211278), Call Sign: KGE263, Licensee ID: L00410998, Assigned Frequencies: 46.1400 MHz, 46.1000 MHz, Grant Date: 10/31/1996, Expiration Date: 01/15/2002, Cancellation Date: 05/05/2002, Registrant: Chalfont Chemical Fire Engine Co No 1, Main St, Chalfont, PA 18914, Phone: (215) 822-9685 615 Limekiln Pike (Lat: 40.302889 Lon: -75.218500), Type: Tower, Structure height: 19.8 m, Overall height: 38.1 m, Call Sign: KRU982, Assigned Frequencies: 154.995 MHz, 151.250 MHz, Grant Date: 04/07/2015, Expiration Date: 04/26/2025, Registrant: New Britain, Township Of, 207 Park Avenue, Chalfont, PA 18914, Phone: (215) 822-1391, Fax: (215) 822-6051, Email:
Fmc Technologies, 400 Highpoint Dr (Lat: 40.260917 Lon: -75.213694), Type: Building, Structure height: 3 m, Call Sign: WPWY418, Licensee ID: L00475274, Assigned Frequencies: 462.800 MHz, Grant Date: 02/07/2003, Expiration Date: 02/07/2013, Cancellation Date: 04/13/2013, Certifier: John M Schueren, Registrant: Fmc Technologies, 400 Highpoint Drive, Chalfont, PA 18914, Phone: (215) 822-4300, Fax: (215) 822-4553, Email:
Lat: 40.274000 Lon: -75.240361, Call Sign: WQDL563, Assigned Frequencies: 159.615 MHz, 159.975 MHz, Grant Date: 09/24/2005, Expiration Date: 09/24/2015, Cancellation Date: 11/28/2015, Certifier: Alex Jushchyshyn, Registrant: Scott Communications, Inc., 2888 Bethlehem Pike, Hatfield, PA 19440, Phone: (215) 997-9500, Fax: (215) 822-8713, Email:
WTP, Lat: 40.292472 Lon: -75.203611, Call Sign: WQKG264, Assigned Frequencies: 451.112 MHz, 456.112 MHz, Grant Date: 02/15/2019, Expiration Date: 05/07/2029, Certifier: John Lichtfuss, Registrant: Business Radio Licensing, 30251 Golden Lantern, Suite E # 501, Laguna Niguel, CA 92677, Phone: (949) 348-8510, Fax: (949) 348-8514, Email:
4371 County Line Road (Lat: 40.272528 Lon: -75.254278), Type: Building, Structure height: 18 m, Call Sign: WQVA279, Assigned Frequencies: 157.740 MHz, Grant Date: 12/04/2014, Expiration Date: 12/04/2024, Certifier: Patrick Brady, Registrant: Waveware Technologies, Inc, 2630 National Dr., Garland, TX 75041, Phone: (972) 479-1702, Fax: (972) 479-1735, Email:
Lat: 40.262639 Lon: -75.216139, Call Sign: WQWP616, Assigned Frequencies: 469.262 MHz, 467.925 MHz, Grant Date: 10/20/2015, Expiration Date: 10/20/2025, Certifier: Lisa Marsland, Registrant: Licom Communications, 2450 Durham Rd., Bristol, PA 19007, Phone: (215) 945-0998, Fax: (215) 945-1016FCC Registered Microwave Towers: 7
STATION, 300 Skunk Hollow (Lat: 40.325361 Lon: -75.224611), Structure height: 19.8 m, Call Sign: WNTL443, Assigned Frequencies: 957.850 MHz, Grant Date: 11/14/1991, Expiration Date: 11/14/1996, Phone: (215) 257-9400 SKUNK HOLLOW, 300 Skunkhollow Road (Lat: 40.325389 Lon: -75.224611), Type: Tower, Structure height: 27.4 m, Call Sign: WPQP543, Licensee ID: L00003151, Assigned Frequencies: 957.850 MHz, Grant Date: 07/28/2000, Expiration Date: 07/28/2010, Cancellation Date: 10/02/2010, Certifier: Russell A Mumaw, Registrant: Blooming Glen Contractors, 901 Minsi Trail, Blooming Glen, PA 18911, Phone: (215) 257-9400, Fax: (610) 222-4964 PA-PHL5746A, 320 Lower State Road (Lat: 40.251806 Lon: -75.186611), Type: Pole, Structure height: 45.7 m, Overall height: 46.6 m, Call Sign: WQKS346, Assigned Frequencies: 19375.0 MHz, 19525.0 MHz, 19475.0 MHz, 19625.0 MHz, Grant Date: 08/31/2009, Expiration Date: 08/31/2019, Cancellation Date: 07/08/2019, Certifier: Nadja S Sodos-Wallace, Registrant: Sprint Corporation, 12502 Sunrise Valley Drive, M/S: Varesa, Reston, VA 20196, Phone: (800) 572-8256, Fax: (703) 433-4483, Email:
PA-PHL5754A, 1700 Horizon Dr (Lat: 40.261500 Lon: -75.216694), Type: Tank, Structure height: 42.7 m, Overall height: 43.6 m, Call Sign: WQKS367, Assigned Frequencies: 11265.0 MHz, 11505.0 MHz, 17965.0 MHz, 11345.0 MHz, 11585.0 MHz, 18065.0 MHz, Grant Date: 08/31/2009, Expiration Date: 08/31/2019, Cancellation Date: 07/08/2019, Certifier: Nadja S Sodos-Wallace, Registrant: Sprint Corporation, 12502 Sunrise Valley Drive, M/S: Varesa, Reston, VA 20196, Phone: (800) 572-8256, Fax: (703) 433-4483, Email:
PA-PHL0516B, 230 Schoolhouse Rd. / Hv248 (Lat: 40.280750 Lon: -75.236722), Type: Tower, Structure height: 59.4 m, Overall height: 60.6 m, Call Sign: WQKV378, Assigned Frequencies: 10775.0 MHz, 11015.0 MHz, 17815.0 MHz, 23025.0 MHz, 10855.0 MHz, 11095.0 MHz, 17915.0 MHz, Grant Date: 09/24/2009, Expiration Date: 09/24/2019, Cancellation Date: 07/08/2019, Certifier: Nadja S Sodos-Wallace, Registrant: Sprint Corporation, 12502 Sunrise Valley Drive, M/S: Varesa, Reston, VA 20196, Phone: (800) 572-8256, Fax: (703) 433-4483, Email:
Eureka UnitSub, Lat: 40.260889 Lon: -75.198861, Type: Pole, Structure height: 25.9 m, Call Sign: WQMQ231, Assigned Frequencies: 3650.00 MHz, Grant Date: 10/20/2010, Expiration Date: 02/14/2021, Cancellation Date: 03/09/2021, Certifier: Michael Pezzano, Registrant: Exelon Energy, 2900 Lord Baltimore Dr, Baltimore, MD 21244, Phone: (410) 470-8561, Fax: (410) 470-8599, Email:
PA-PHL393A, 207 Park Avenue (Lat: 40.296083 Lon: -75.204889), Type: Tower, Structure height: 45.7 m, Call Sign: WQOU711, Assigned Frequencies: 17865.0 MHz, Grant Date: 02/03/2012, Expiration Date: 02/03/2022, Cancellation Date: 07/08/2019, Certifier: Nadja S Sodos-Wallace, Registrant: Sprint Corporation, 12502 Sunrise Valley Drive, M/S: Varesa0209, Reston, VA 20196, Phone: (800) 572-8256, Fax: (703) 433-4483, Email:
FCC Registered Amateur Radio Licenses: 89 (
See the full list of FCC Registered Amateur Radio Licenses in Chalfont )
FAA Registered Aircraft Manufacturers and Dealers: 1 (
See the full list of FAA Registered Manufacturers and Dealers in Chalfont )
FAA Registered Aircraft: 23 (
See the full list of FAA Registered Aircraft )
Home Mortgage Disclosure Act Aggregated Statistics For Year 2009(Based on 1 full tract) A) FHA, FSA/RHS & VA B) Conventional C) Refinancings D) Home Improvement Loans F) Non-occupant Loans on Number Average Value Number Average Value Number Average Value Number Average Value Number Average Value
LOANS ORIGINATED 7 $275,714 28 $219,929 159 $218,799 18 $105,667 8 $131,000 APPLICATIONS APPROVED, NOT ACCEPTED 0 $0 2 $308,500 10 $214,800 2 $12,000 1 $65,000 APPLICATIONS DENIED 1 $103,000 6 $250,000 30 $288,367 3 $48,333 0 $0 APPLICATIONS WITHDRAWN 1 $294,000 2 $284,000 22 $243,864 2 $216,000 0 $0 FILES CLOSED FOR INCOMPLETENESS 0 $0 3 $286,000 10 $228,000 0 $0 0 $0
Aggregated Statistics For Year 2008(Based on 1 full tract) A) FHA, FSA/RHS & VA B) Conventional C) Refinancings D) Home Improvement Loans F) Non-occupant Loans on Number Average Value Number Average Value Number Average Value Number Average Value Number Average Value
LOANS ORIGINATED 8 $257,000 50 $232,700 85 $199,424 25 $40,640 5 $281,600 APPLICATIONS APPROVED, NOT ACCEPTED 0 $0 6 $246,500 12 $151,167 4 $52,000 0 $0 APPLICATIONS DENIED 0 $0 5 $366,800 39 $206,769 11 $53,091 2 $90,000 APPLICATIONS WITHDRAWN 1 $360,000 6 $287,000 15 $230,067 2 $79,000 2 $279,500 FILES CLOSED FOR INCOMPLETENESS 0 $0 1 $362,000 4 $242,250 1 $35,000 0 $0
Aggregated Statistics For Year 2007(Based on 1 full tract) A) FHA, FSA/RHS & VA B) Conventional C) Refinancings D) Home Improvement Loans F) Non-occupant Loans on Number Average Value Number Average Value Number Average Value Number Average Value Number Average Value
LOANS ORIGINATED 2 $294,000 82 $250,756 89 $169,517 32 $57,125 4 $236,250 APPLICATIONS APPROVED, NOT ACCEPTED 0 $0 13 $262,000 22 $143,955 2 $62,000 0 $0 APPLICATIONS DENIED 0 $0 3 $255,333 34 $199,324 16 $63,500 1 $134,000 APPLICATIONS WITHDRAWN 0 $0 8 $282,750 13 $180,692 1 $150,000 1 $344,000 FILES CLOSED FOR INCOMPLETENESS 0 $0 0 $0 3 $235,667 0 $0 0 $0
Aggregated Statistics For Year 2006(Based on 1 full tract) A) FHA, FSA/RHS & VA B) Conventional C) Refinancings D) Home Improvement Loans F) Non-occupant Loans on Number Average Value Number Average Value Number Average Value Number Average Value Number Average Value
LOANS ORIGINATED 2 $232,000 129 $247,295 93 $171,172 35 $74,086 12 $211,417 APPLICATIONS APPROVED, NOT ACCEPTED 0 $0 7 $304,714 22 $218,636 6 $103,333 0 $0 APPLICATIONS DENIED 0 $0 4 $342,000 62 $254,435 13 $100,154 2 $237,000 APPLICATIONS WITHDRAWN 0 $0 10 $288,300 21 $211,857 2 $32,500 1 $274,000 FILES CLOSED FOR INCOMPLETENESS 0 $0 3 $252,000 5 $294,200 1 $320,000 0 $0
Aggregated Statistics For Year 2005(Based on 1 full tract) A) FHA, FSA/RHS & VA B) Conventional C) Refinancings D) Home Improvement Loans F) Non-occupant Loans on G) Loans On Manufactured Number Average Value Number Average Value Number Average Value Number Average Value Number Average Value Number Average Value
LOANS ORIGINATED 2 $131,000 100 $230,690 142 $175,218 45 $53,933 12 $134,917 0 $0 APPLICATIONS APPROVED, NOT ACCEPTED 0 $0 11 $269,909 22 $131,455 4 $25,500 0 $0 0 $0 APPLICATIONS DENIED 0 $0 9 $394,667 63 $190,508 11 $101,273 1 $206,000 1 $56,000 APPLICATIONS WITHDRAWN 1 $127,000 7 $152,429 38 $175,711 6 $113,667 3 $213,333 0 $0 FILES CLOSED FOR INCOMPLETENESS 0 $0 3 $301,667 14 $299,500 0 $0 0 $0 0 $0
Aggregated Statistics For Year 2004(Based on 1 full tract) A) FHA, FSA/RHS & VA B) Conventional C) Refinancings D) Home Improvement Loans E) Loans on Dwellings For 5+ Families F) Non-occupant Loans on G) Loans On Manufactured Number Average Value Number Average Value Number Average Value Number Average Value Number Average Value Number Average Value Number Average Value
LOANS ORIGINATED 1 $200,000 101 $191,366 132 $165,227 26 $52,269 1 $294,000 8 $183,625 1 $29,000 APPLICATIONS APPROVED, NOT ACCEPTED 0 $0 16 $207,062 27 $146,963 0 $0 0 $0 2 $178,500 0 $0 APPLICATIONS DENIED 0 $0 8 $186,250 34 $152,382 5 $80,000 0 $0 0 $0 0 $0 APPLICATIONS WITHDRAWN 0 $0 7 $157,000 41 $171,146 7 $99,286 0 $0 2 $123,500 0 $0 FILES CLOSED FOR INCOMPLETENESS 0 $0 1 $104,000 4 $212,000 0 $0 0 $0 1 $104,000 0 $0
Aggregated Statistics For Year 2003(Based on 1 full tract) A) FHA, FSA/RHS & VA B) Conventional C) Refinancings D) Home Improvement Loans F) Non-occupant Loans on Number Average Value Number Average Value Number Average Value Number Average Value Number Average Value
LOANS ORIGINATED 0 $0 134 $178,881 375 $150,328 23 $52,478 17 $95,765 APPLICATIONS APPROVED, NOT ACCEPTED 1 $179,000 21 $184,190 64 $139,391 8 $69,750 1 $76,000 APPLICATIONS DENIED 0 $0 9 $164,889 53 $177,245 9 $41,889 0 $0 APPLICATIONS WITHDRAWN 0 $0 12 $193,500 43 $148,349 6 $112,167 2 $96,000 FILES CLOSED FOR INCOMPLETENESS 0 $0 2 $54,500 9 $168,889 0 $0 2 $83,000
Aggregated Statistics For Year 2002(Based on 1 full tract) A) FHA, FSA/RHS & VA B) Conventional C) Refinancings D) Home Improvement Loans F) Non-occupant Loans on Number Average Value Number Average Value Number Average Value Number Average Value Number Average Value
LOANS ORIGINATED 1 $174,000 85 $167,929 233 $278,176 37 $35,000 6 $89,333 APPLICATIONS APPROVED, NOT ACCEPTED 0 $0 6 $139,500 22 $132,682 8 $34,500 2 $44,500 APPLICATIONS DENIED 1 $138,000 5 $111,200 44 $155,068 9 $41,333 3 $63,667 APPLICATIONS WITHDRAWN 0 $0 6 $176,667 44 $133,432 3 $40,333 0 $0 FILES CLOSED FOR INCOMPLETENESS 0 $0 0 $0 12 $125,000 4 $45,000 0 $0
Aggregated Statistics For Year 2001(Based on 1 full tract) A) FHA, FSA/RHS & VA B) Conventional C) Refinancings D) Home Improvement Loans E) Loans on Dwellings For 5+ Families F) Non-occupant Loans on Number Average Value Number Average Value Number Average Value Number Average Value Number Average Value Number Average Value
LOANS ORIGINATED 3 $119,667 61 $125,885 124 $133,500 33 $34,788 1 $315,000 9 $82,333 APPLICATIONS APPROVED, NOT ACCEPTED 0 $0 8 $126,500 15 $116,533 11 $20,909 0 $0 1 $41,000 APPLICATIONS DENIED 0 $0 7 $76,286 20 $127,300 8 $22,375 0 $0 0 $0 APPLICATIONS WITHDRAWN 1 $143,000 4 $154,000 31 $134,419 4 $60,500 0 $0 0 $0 FILES CLOSED FOR INCOMPLETENESS 0 $0 3 $136,667 3 $240,667 1 $15,000 0 $0 1 $100,000
Aggregated Statistics For Year 2000(Based on 1 full tract) A) FHA, FSA/RHS & VA B) Conventional C) Refinancings D) Home Improvement Loans F) Non-occupant Loans on Number Average Value Number Average Value Number Average Value Number Average Value Number Average Value
LOANS ORIGINATED 5 $104,600 112 $142,732 40 $110,400 37 $21,189 3 $166,667 APPLICATIONS APPROVED, NOT ACCEPTED 0 $0 7 $174,571 8 $85,625 7 $33,571 1 $60,000 APPLICATIONS DENIED 1 $65,000 15 $149,933 17 $58,882 7 $74,286 2 $50,000 APPLICATIONS WITHDRAWN 0 $0 9 $166,222 14 $108,643 5 $70,000 0 $0 FILES CLOSED FOR INCOMPLETENESS 0 $0 3 $48,000 8 $95,000 0 $0 0 $0
Aggregated Statistics For Year 1999(Based on 1 partial tract) A) FHA, FSA/RHS & VA B) Conventional C) Refinancings D) Home Improvement Loans F) Non-occupant Loans on Number Average Value Number Average Value Number Average Value Number Average Value Number Average Value
LOANS ORIGINATED 6 $124,662 114 $135,160 73 $102,618 21 $23,084 3 $46,393 APPLICATIONS APPROVED, NOT ACCEPTED 0 $0 7 $175,564 15 $110,649 7 $29,621 1 $34,080 APPLICATIONS DENIED 0 $0 10 $131,605 28 $100,056 4 $25,800 1 $33,140 APPLICATIONS WITHDRAWN 0 $0 10 $156,317 21 $103,832 7 $80,884 2 $157,640 FILES CLOSED FOR INCOMPLETENESS 0 $0 1 $36,930 4 $141,548 0 $0 0 $0
Detailed HMDA statistics for the following Tracts:
1019.00
Private Mortgage Insurance Companies Aggregated Statistics For Year 2009(Based on 1 full tract) A) Conventional B) Refinancings Number Average Value Number Average Value
LOANS ORIGINATED 3 $261,333 6 $339,833 APPLICATIONS APPROVED, NOT ACCEPTED 1 $98,000 2 $269,500 APPLICATIONS DENIED 0 $0 1 $329,000 APPLICATIONS WITHDRAWN 0 $0 1 $330,000 FILES CLOSED FOR INCOMPLETENESS 0 $0 0 $0
Aggregated Statistics For Year 2008(Based on 1 full tract) A) Conventional B) Refinancings Number Average Value Number Average Value
LOANS ORIGINATED 12 $251,583 5 $254,200 APPLICATIONS APPROVED, NOT ACCEPTED 6 $247,500 1 $264,000 APPLICATIONS DENIED 1 $116,000 0 $0 APPLICATIONS WITHDRAWN 0 $0 0 $0 FILES CLOSED FOR INCOMPLETENESS 0 $0 0 $0
Aggregated Statistics For Year 2007(Based on 1 full tract) A) Conventional B) Refinancings Number Average Value Number Average Value
LOANS ORIGINATED 15 $243,867 3 $323,000 APPLICATIONS APPROVED, NOT ACCEPTED 0 $0 2 $245,500 APPLICATIONS DENIED 1 $320,000 0 $0 APPLICATIONS WITHDRAWN 0 $0 0 $0 FILES CLOSED FOR INCOMPLETENESS 0 $0 0 $0
Aggregated Statistics For Year 2006(Based on 1 full tract) A) Conventional B) Refinancings Number Average Value Number Average Value
LOANS ORIGINATED 7 $199,143 1 $180,000 APPLICATIONS APPROVED, NOT ACCEPTED 0 $0 0 $0 APPLICATIONS DENIED 0 $0 0 $0 APPLICATIONS WITHDRAWN 0 $0 0 $0 FILES CLOSED FOR INCOMPLETENESS 0 $0 0 $0
Aggregated Statistics For Year 2005(Based on 1 full tract) A) Conventional B) Refinancings Number Average Value Number Average Value
LOANS ORIGINATED 7 $201,000 3 $285,667 APPLICATIONS APPROVED, NOT ACCEPTED 3 $287,000 1 $300,000 APPLICATIONS DENIED 0 $0 0 $0 APPLICATIONS WITHDRAWN 1 $269,000 0 $0 FILES CLOSED FOR INCOMPLETENESS 0 $0 0 $0
Aggregated Statistics For Year 2004(Based on 1 full tract) A) Conventional B) Refinancings C) Non-occupant Loans on Number Average Value Number Average Value Number Average Value
LOANS ORIGINATED 15 $193,200 5 $223,800 3 $109,000 APPLICATIONS APPROVED, NOT ACCEPTED 10 $223,500 3 $169,333 1 $76,000 APPLICATIONS DENIED 2 $131,000 0 $0 1 $104,000 APPLICATIONS WITHDRAWN 1 $269,000 1 $293,000 0 $0 FILES CLOSED FOR INCOMPLETENESS 0 $0 0 $0 0 $0
Aggregated Statistics For Year 2003(Based on 1 full tract) A) Conventional B) Refinancings C) Non-occupant Loans on Number Average Value Number Average Value Number Average Value
LOANS ORIGINATED 29 $212,034 11 $175,455 1 $76,000 APPLICATIONS APPROVED, NOT ACCEPTED 9 $227,222 5 $214,600 0 $0 APPLICATIONS DENIED 0 $0 0 $0 0 $0 APPLICATIONS WITHDRAWN 1 $342,000 1 $99,000 0 $0 FILES CLOSED FOR INCOMPLETENESS 0 $0 0 $0 0 $0
Aggregated Statistics For Year 2002(Based on 1 full tract) A) Conventional B) Refinancings Number Average Value Number Average Value
LOANS ORIGINATED 30 $161,800 16 $203,250 APPLICATIONS APPROVED, NOT ACCEPTED 8 $202,500 0 $0 APPLICATIONS DENIED 0 $0 0 $0 APPLICATIONS WITHDRAWN 5 $198,200 1 $99,000 FILES CLOSED FOR INCOMPLETENESS 0 $0 0 $0
Aggregated Statistics For Year 2001(Based on 1 full tract) A) Conventional B) Refinancings C) Non-occupant Loans on Number Average Value Number Average Value Number Average Value
LOANS ORIGINATED 18 $161,333 11 $188,364 1 $117,000 APPLICATIONS APPROVED, NOT ACCEPTED 6 $143,500 6 $203,333 0 $0 APPLICATIONS DENIED 0 $0 0 $0 0 $0 APPLICATIONS WITHDRAWN 0 $0 1 $214,000 0 $0 FILES CLOSED FOR INCOMPLETENESS 0 $0 0 $0 0 $0
Aggregated Statistics For Year 2000(Based on 1 full tract) A) Conventional B) Refinancings Number Average Value Number Average Value
LOANS ORIGINATED 18 $136,167 3 $140,000 APPLICATIONS APPROVED, NOT ACCEPTED 2 $226,000 0 $0 APPLICATIONS DENIED 0 $0 1 $115,000 APPLICATIONS WITHDRAWN 0 $0 0 $0 FILES CLOSED FOR INCOMPLETENESS 0 $0 0 $0
Aggregated Statistics For Year 1999(Based on 1 partial tract) A) Conventional B) Refinancings C) Non-occupant Loans on Number Average Value Number Average Value Number Average Value
LOANS ORIGINATED 26 $151,379 9 $112,143 1 $102,250 APPLICATIONS APPROVED, NOT ACCEPTED 3 $149,280 1 $98,470 0 $0 APPLICATIONS DENIED 1 $148,650 0 $0 0 $0 APPLICATIONS WITHDRAWN 0 $0 1 $145,810 0 $0 FILES CLOSED FOR INCOMPLETENESS 1 $164,740 0 $0 0 $0
Detailed PMIC statistics for the following Tracts:
1019.00
Chalfont compared to Pennsylvania state average:
Median household income above state average. Median house value above state average. Unemployed percentage significantly below state average. Black race population percentage significantly below state average. Hispanic race population percentage below state average. Foreign-born population percentage above state average. Renting percentage below state average. Length of stay since moving in significantly above state average. Number of rooms per house above state average. House age below state average. Percentage of population with a bachelor's degree or higher significantly above state average.
Top Patent Applicants
Linghang Zhuang (46)
John-Paul Romano (34)
Zhiqiang Ji (24)
Khiem Pham (20)
Zhenrong Xu (16)
Ruey J. Yu (16)
Richard Martin Jacobson (13)
Jeffrey F. Bull (13)
Kevin Sanford (12)
Yugeswar Deenoo (12)
Total of 586 patent applications in 2008-2024.
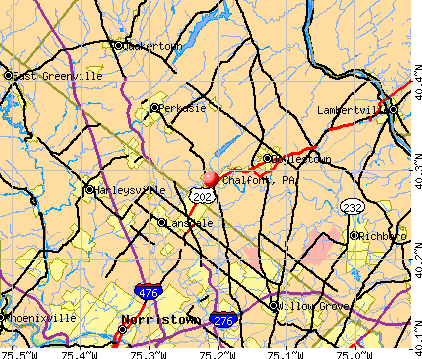


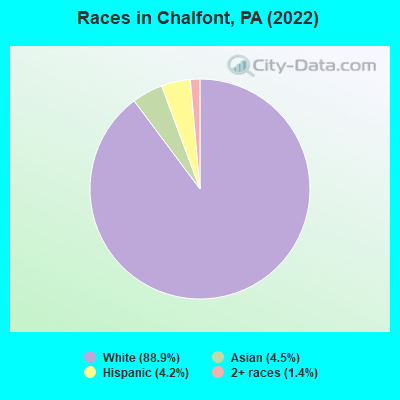
 Recent articles from our blog. Our writers, many of them Ph.D. graduates or candidates, create easy-to-read articles on a wide variety of topics.

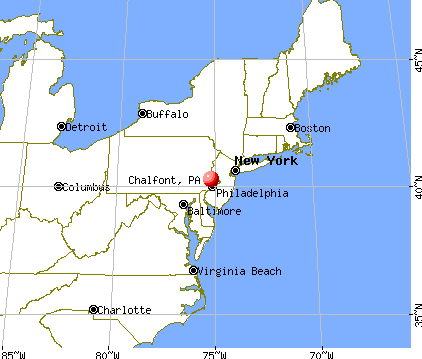
 (20.5 miles
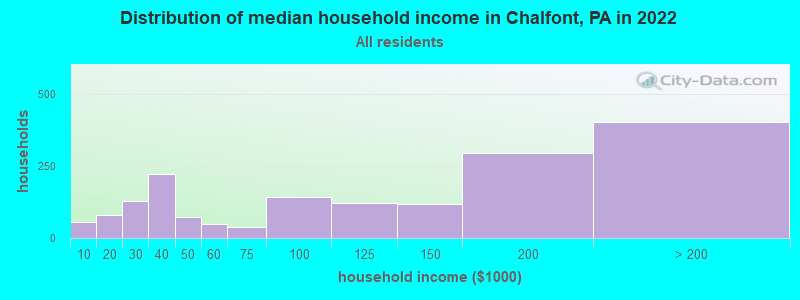
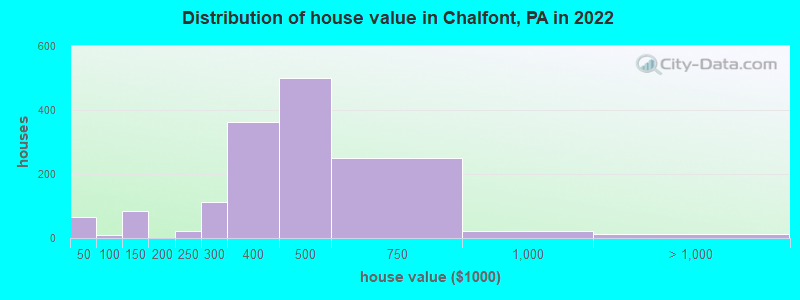

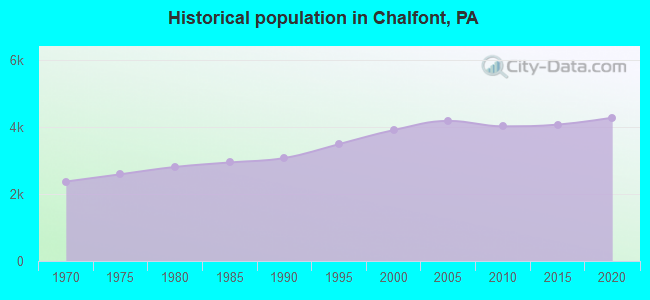
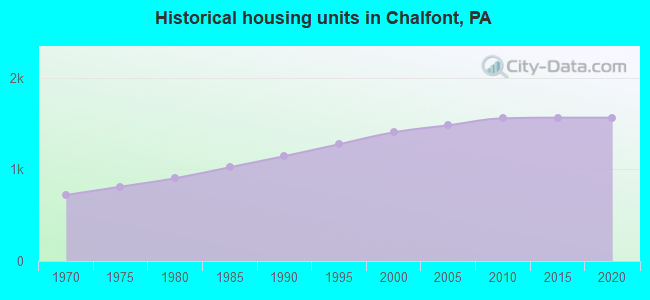
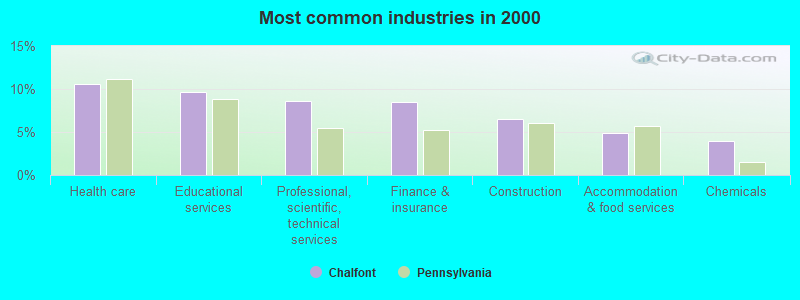
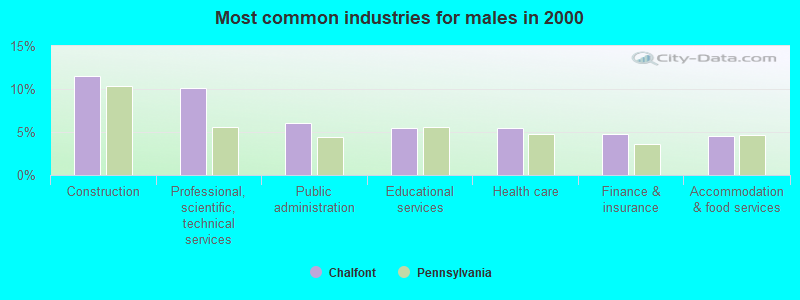
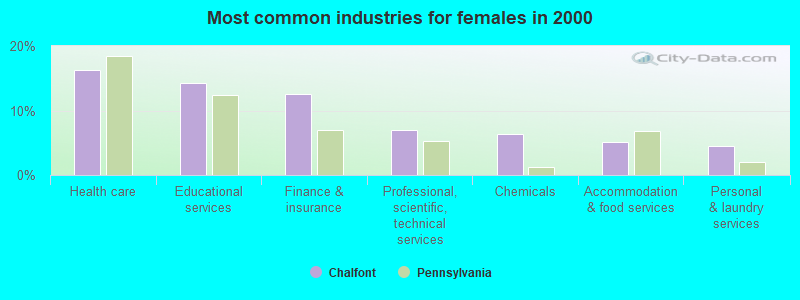
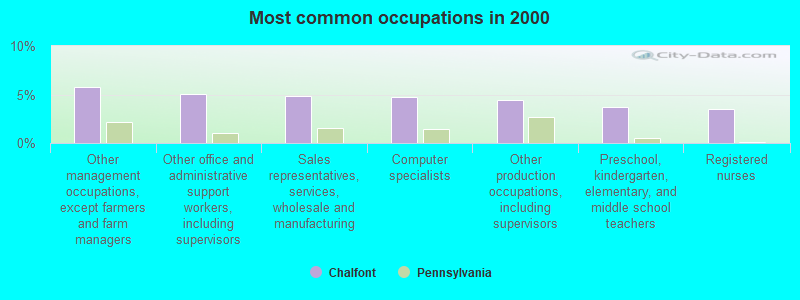
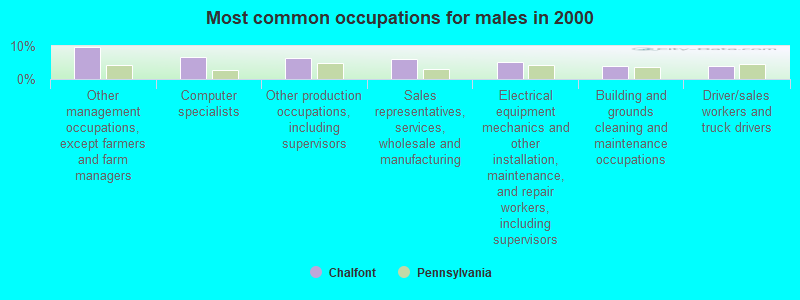
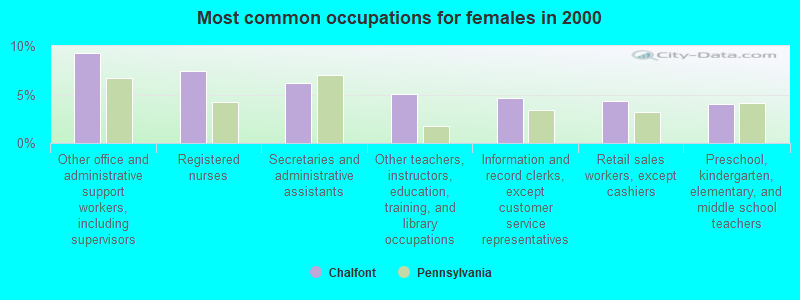


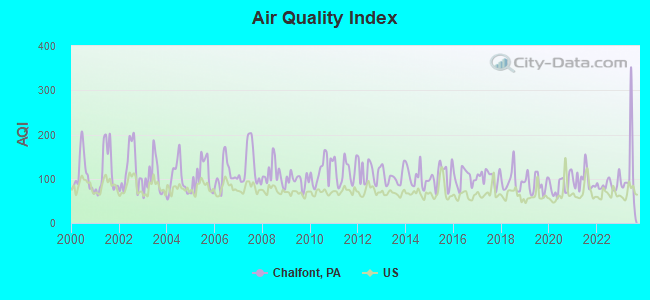
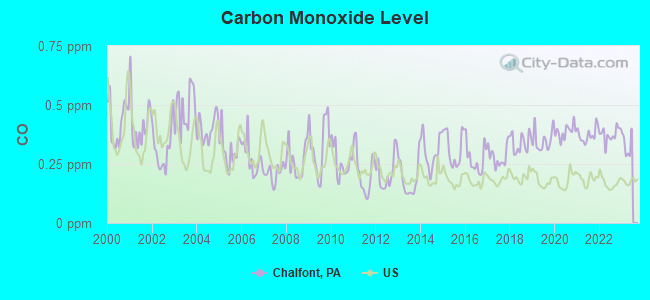
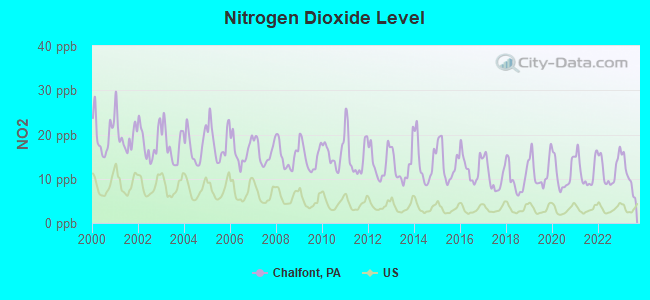
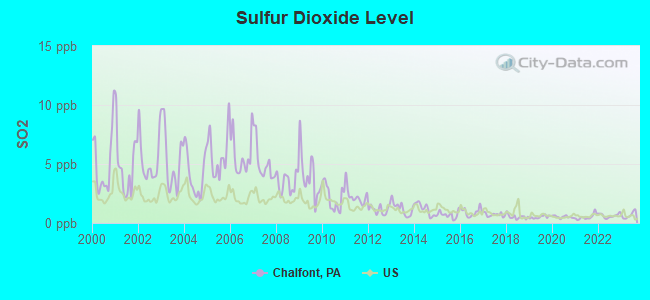
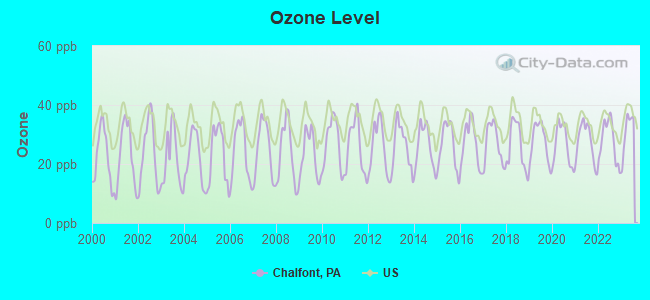
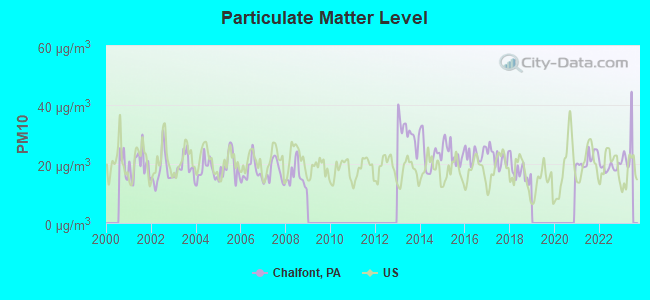
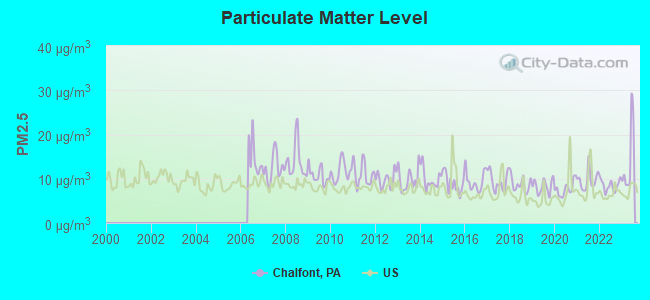
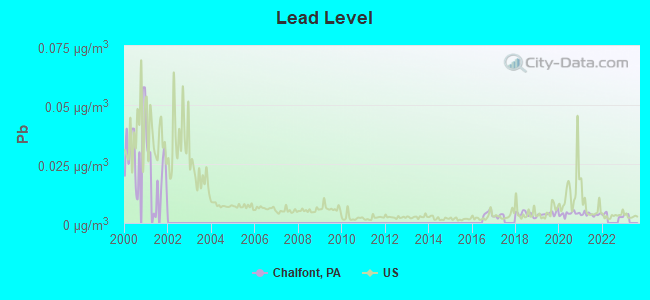

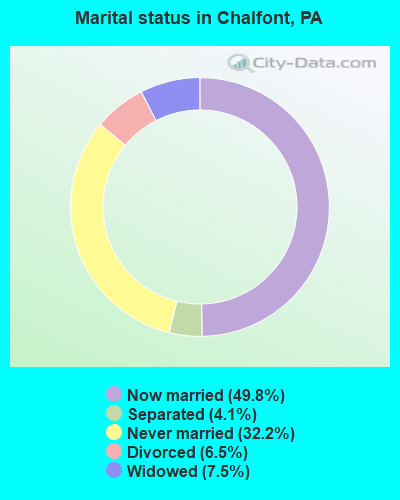
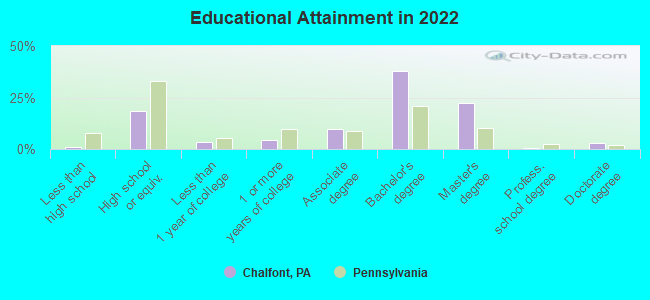
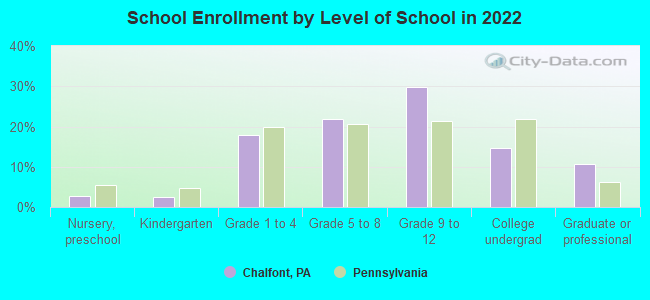
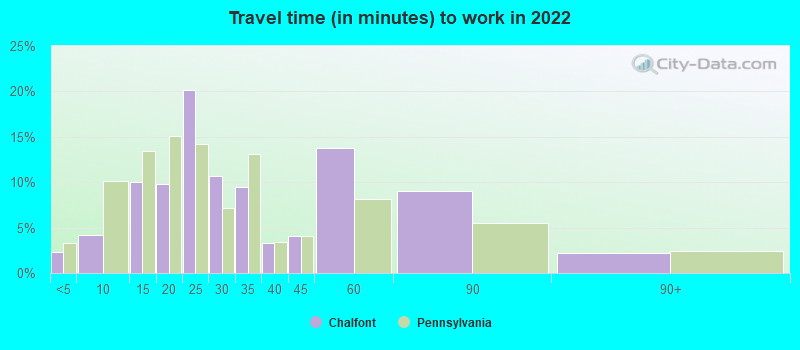
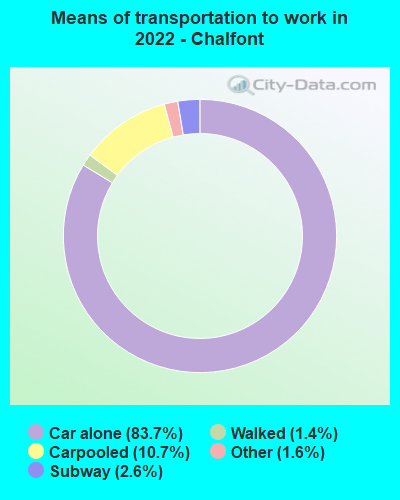
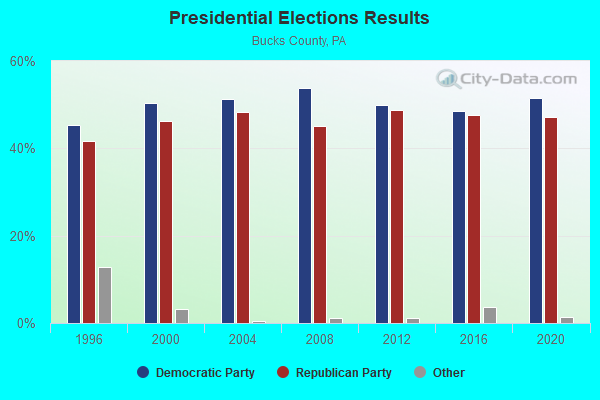
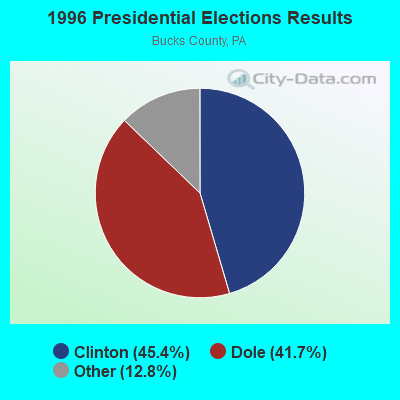
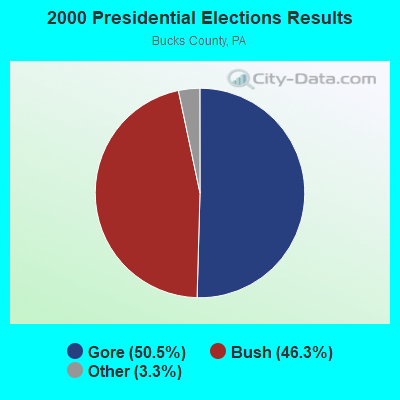
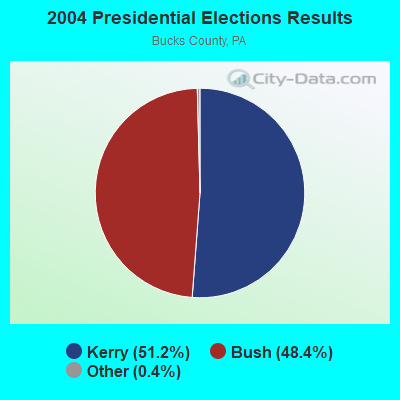
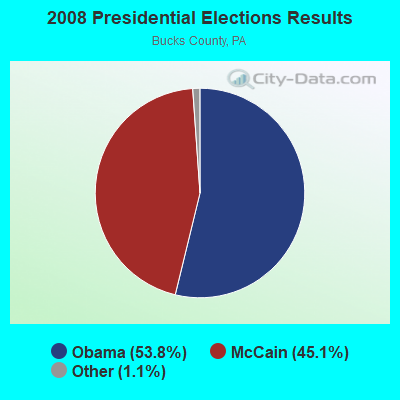
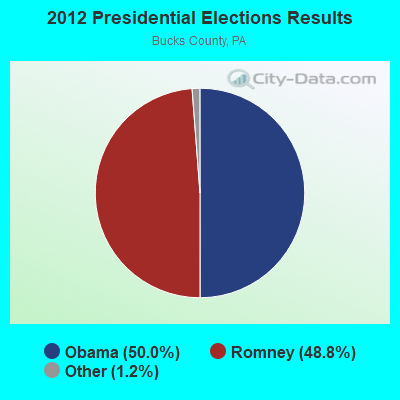
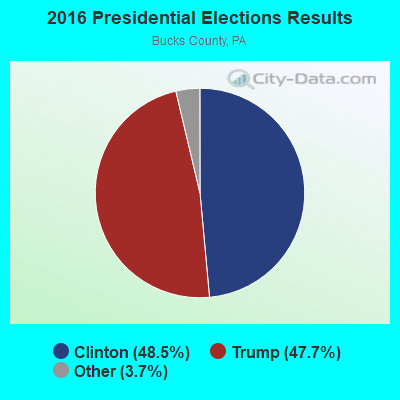
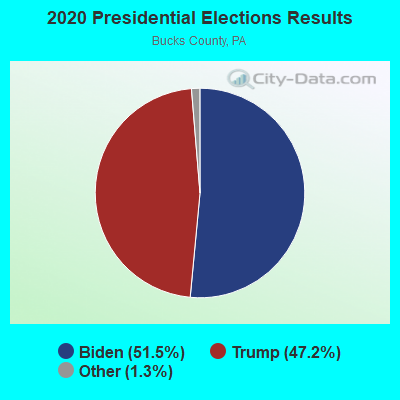
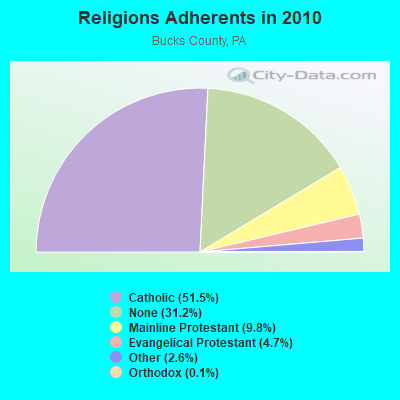
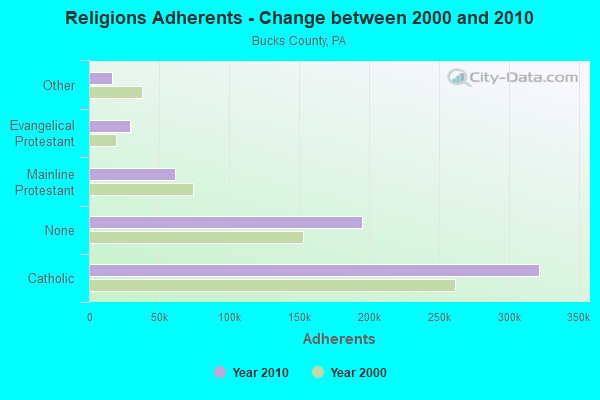
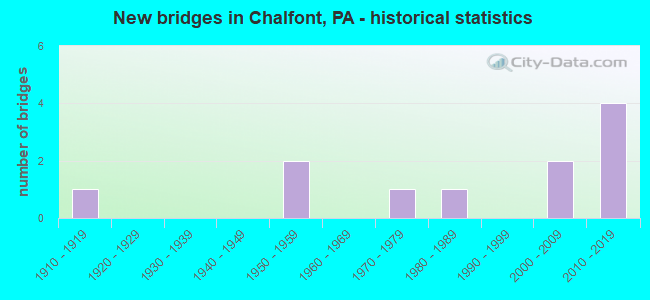
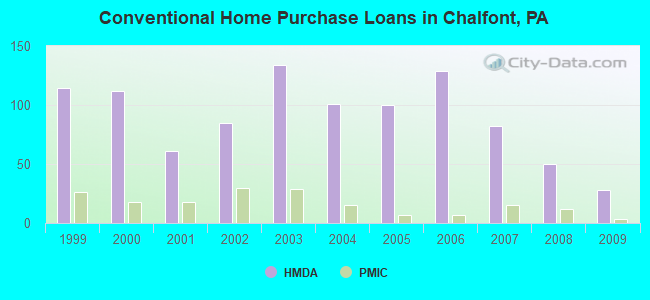
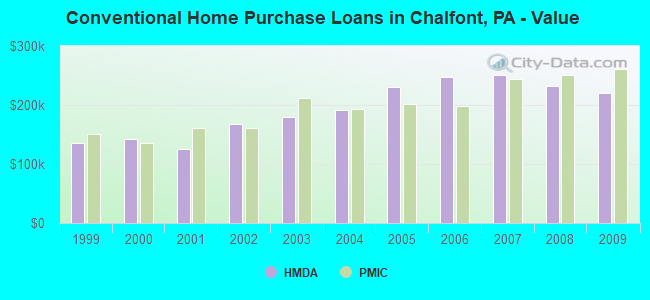
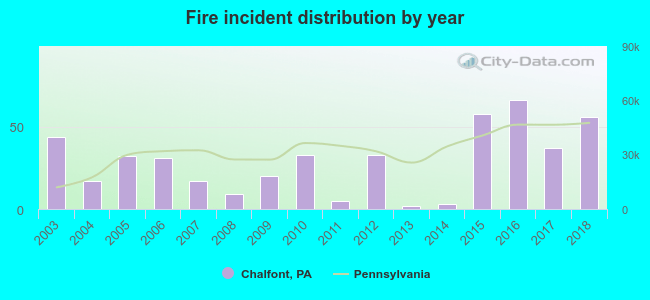 Based on the data from the years 2003 - 2018 the average number of fire incidents per year is 29. The highest number of fires - 66 took place in 2016, and the least - 2 in 2013. The data has a growing trend.
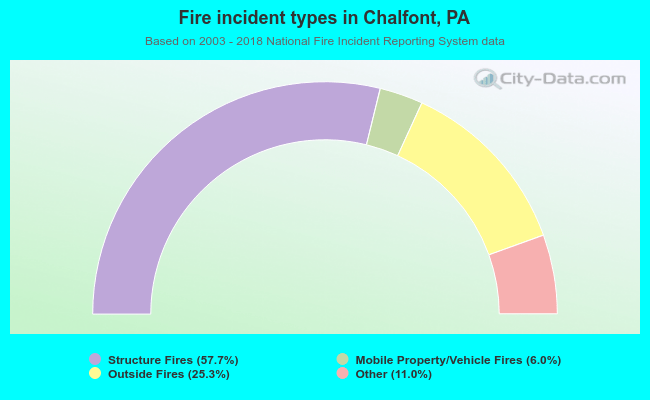 When looking into fire subcategories, the most reports belonged to: Structure Fires (57.7%), and Outside Fires (25.3%).