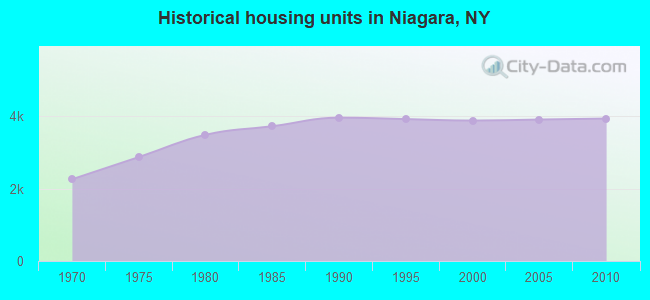
Niagara, New York
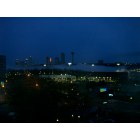
Niagara: Morning approaches over mist over Falls
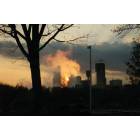
Niagara: The city of Niagara in the winter with Niagara Falls' veil
- add
your
Submit your own pictures of this town and show them to the world
- OSM Map
- Google Map
- MSN Map
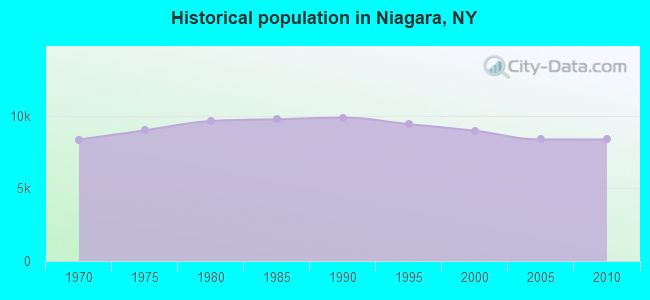
Population change since 2000: -6.7%
 |
| Males: 4,016 | |
| Females: 4,362 |
| Median resident age: | 43.4 years |
| New York median age: | 40.7 years |
Zip codes: 14304.
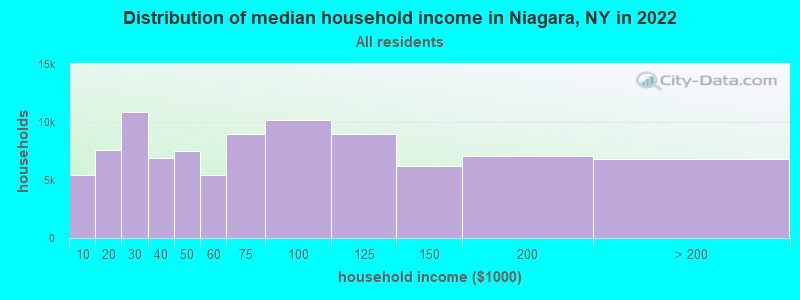
| Niagara: | $62,095 |
| NY: | $79,557 |
Estimated per capita income in 2022: $34,309 (it was $17,500 in 2000)
Niagara town income, earnings, and wages data
Estimated median house or condo value in 2022: $178,468 (it was $74,500 in 2000)
| Niagara: | $178,468 |
| NY: | $400,400 |
Mean prices in 2022: all housing units: $305,854; detached houses: $303,488; townhouses or other attached units: $534,655; in 2-unit structures: $181,215; in 3-to-4-unit structures: $160,445; in 5-or-more-unit structures: over $1,000,000; mobile homes: $57,277
Detailed information about poverty and poor residents in Niagara, NY


Compare current foreclosures near Niagara, NY:
| Photo | Address | Area | Beds / Baths | Price | Details |
|---|---|---|---|---|---|

|
#1
Juniper St
Lockport, NY 14094
|
1,570 sq. feet
|
2 baths 3 beds |
$49,900
|
show details |

|
#2
Rhode Island Ave
Niagara Falls, NY 14305
|
1,376 sq. feet
|
1 baths 3 beds |
$99,900
|
show details |

|
#3
Tremaine Ave
Buffalo, NY 14217
|
1,144 sq. feet
|
1 baths 3 beds |
$251,900
|
show details |

|
#4
Saint Lawrence Ave
Buffalo, NY 14216
|
1,868 sq. feet
|
2 baths 4 beds |
show details | |

|
#5
Colvin Blvd
Buffalo, NY 14223
|
3,258 sq. feet
|
4 baths 5 beds |
show details | |

|
#6
South St
Lockport, NY 14094
|
- sq. feet
|
1 baths 3 beds |
show details | |

|
#7
100th St
Niagara Falls, NY 14304
|
1,680 sq. feet
|
2 baths 3 beds |
show details | |

|
#8
Fernhill Ave
Buffalo, NY 14215
|
2,180 sq. feet
|
2 baths 4 beds |
show details | |

|
#9
Westwood Dr
Tonawanda, NY 14150
|
1,136 sq. feet
|
1 baths 3 beds |
show details | |

|
#10
Fletcher St
Tonawanda, NY 14150
|
2,606 sq. feet
|
2 baths 5 beds |
show details |
| Photo | Address | Area | Beds / Baths | Price | Details |
|---|---|---|---|---|---|

|
#11
Kenova St
Buffalo, NY 14214
|
1,105 sq. feet
|
1 baths 3 beds |
show details | |

|
#12
Northumberland Ave
Buffalo, NY 14215
|
1,080 sq. feet
|
1 baths 3 beds |
show details | |

|
#13
Lisbon Ave
Buffalo, NY 14215
|
1,924 sq. feet
|
2 baths 3 beds |
show details | |

|
#14
Ward Rd
Sanborn, NY 14132
|
2,156 sq. feet
|
2 baths 4 beds |
show details | |

|
#15
Cherrywood Ln
Lockport, NY 14094
|
1,896 sq. feet
|
2 baths 3 beds |
show details | |

|
#16
Alma Ave
Buffalo, NY 14215
|
2,366 sq. feet
|
2 baths 4 beds |
show details | |

|
#17
Two Mile Creek Rd
Tonawanda, NY 14150
|
1,056 sq. feet
|
1 baths 3 beds |
show details | |

|
#18
Revere Ave
North Tonawanda, NY 14120
|
936 sq. feet
|
1 baths 3 beds |
show details | |

|
#19
Purdy Rd
Lockport, NY 14094
|
1,542 sq. feet
|
1 baths 3 beds |
show details | |

|
#20
East Ave
Lockport, NY 14094
|
2,108 sq. feet
|
2 baths 4 beds |
show details |
| Photo | Address | Area | Beds / Baths | Price | Details |
|---|---|---|---|---|---|

|
#21
Jasper Dr
Buffalo, NY 14226
|
1,423 sq. feet
|
1 baths 3 beds |
show details | |

|
#22
West Ave
Lockport, NY 14094
|
2,043 sq. feet
|
1 baths 4 beds |
show details | |

|
#23
W Humboldt Pkwy
Buffalo, NY 14214
|
3,233 sq. feet
|
3 baths 4 beds |
show details | |

|
#24
Ontario St
Lockport, NY 14094
|
1,912 sq. feet
|
1 baths 5 beds |
show details | |

|
#25
Webb St
Lockport, NY 14094
|
2,156 sq. feet
|
2 baths 3 beds |
show details | |

|
#26
Hewitt Ave
Buffalo, NY 14215
|
1,473 sq. feet
|
1 baths 3 beds |
show details | |

|
#27
N Whitham Dr
Niagara Falls, NY 14304
|
1,580 sq. feet
|
1 baths 3 beds |
show details | |

|
#28
W Delavan Ave
Buffalo, NY 14222
|
2,462 sq. feet
|
3 baths 5 beds |
show details | |

|
#29
Bennett Village Ter # 1
Buffalo, NY 14214
|
2,328 sq. feet
|
2 baths 6 beds |
show details | |

|
#30
Dunlop Ave
Buffalo, NY 14215
|
1,220 sq. feet
|
2 baths 4 beds |
show details |
| Photo | Address | Area | Beds / Baths | Price | Details |
|---|---|---|---|---|---|

|
#31
Cornell Ave
Buffalo, NY 14226
|
1,290 sq. feet
|
1 baths 3 beds |
show details | |

|
#32
Winspear Ave
Buffalo, NY 14215
|
1,512 sq. feet
|
1 baths 4 beds |
show details | |

|
#33
Wade Ave
Buffalo, NY 14214
|
1,320 sq. feet
|
1 baths 4 beds |
show details | |

|
#34
Potomac Ave
Buffalo, NY 14209
|
2,338 sq. feet
|
2 baths 5 beds |
show details | |

|
#35
Gaslight Trl
Buffalo, NY 14221
|
1,647 sq. feet
|
1 baths 3 beds |
show details | |

|
#36
Brantford Pl
Buffalo, NY 14222
|
2,196 sq. feet
|
1 baths 5 beds |
show details | |

|
#37
Dewitt St
Buffalo, NY 14213
|
2,645 sq. feet
|
2 baths 6 beds |
show details | |

|
#38
Lisbon Ave
Buffalo, NY 14215
|
2,954 sq. feet
|
2 baths 6 beds |
show details | |

|
#39
Potomac Ave
Buffalo, NY 14209
|
2,952 sq. feet
|
2 baths 4 beds |
show details | |

|
#40
Humboldt Pkwy
Buffalo, NY 14214
|
2,210 sq. feet
|
1 baths 3 beds |
show details |
| Photo | Address | Area | Beds / Baths | Price | Details |
|---|---|---|---|---|---|

|
#41
Shady Oaks Ct
East Amherst, NY 14051
|
3,156 sq. feet
|
2 baths 4 beds |
show details | |

|
#42
Dartmouth Ave
Buffalo, NY 14215
|
1,161 sq. feet
|
1 baths 3 beds |
show details | |

|
#43
Bame Ave
Buffalo, NY 14215
|
1,900 sq. feet
|
2 baths 4 beds |
show details | |

|
#44
Beverly Rd
Buffalo, NY 14208
|
2,574 sq. feet
|
2 baths 6 beds |
show details | |

|
#45
Eggert Rd
Buffalo, NY 14215
|
1,076 sq. feet
|
1 baths 2 beds |
show details | |

|
#46
Hewitt Ave
Buffalo, NY 14215
|
1,065 sq. feet
|
1 baths 3 beds |
show details | |

|
#47
Eggert Rd
Buffalo, NY 14215
|
1,606 sq. feet
|
1 baths 3 beds |
show details | |

|
#48
Kensington Ave
Buffalo, NY 14215
|
2,590 sq. feet
|
2 baths 6 beds |
show details | |

|
#49
Lexington Ave
Buffalo, NY 14222
|
2,188 sq. feet
|
2 baths 5 beds |
show details | |

|
Check over 1 million property listings on Foreclosure.com!
|
browse all offers | |||

- 7,59190.6%White alone
- 2793.3%Black alone
- 1511.8%American Indian alone
- 1461.7%Hispanic
- 1291.5%Two or more races
- 740.9%Asian alone
- 80.10%Other race alone
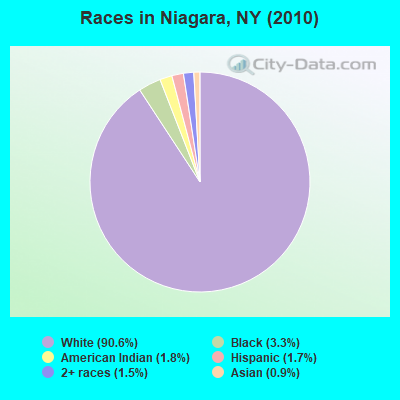
Races in Niagara detailed stats: ancestries, foreign born residents, place of birth
Type |
2009 |
2010 |
2011 |
2012 |
2013 |
2014 |
2015 |
2016 |
2017 |
2018 |
2019 |
2020 |
2021 |
2022 |
|---|---|---|---|---|---|---|---|---|---|---|---|---|---|---|
| Murders (per 100,000) | 0 (0.0) | 0 (0.0) | 0 (0.0) | 0 (0.0) | 0 (0.0) | 0 (0.0) | 0 (0.0) | 0 (0.0) | 0 (0.0) | 0 (0.0) | 0 (0.0) | 0 (0.0) | 0 (0.0) | 0 (0.0) |
| Rapes (per 100,000) | 0 (0.0) | 0 (0.0) | 2 (23.8) | 1 (11.9) | 0 (0.0) | 0 (0.0) | 1 (12.3) | 1 (12.4) | 0 (0.0) | 3 (37.4) | 0 (0.0) | 0 (0.0) | 3 (37.7) | 2 (25.6) |
| Robberies (per 100,000) | 4 (47.9) | 8 (95.5) | 4 (47.5) | 2 (23.8) | 2 (24.3) | 8 (98.0) | 4 (49.2) | 11 (136.1) | 5 (62.3) | 3 (37.4) | 2 (25.1) | 0 (0.0) | 0 (0.0) | 2 (25.6) |
| Assaults (per 100,000) | 15 (179.8) | 4 (47.7) | 16 (190.1) | 13 (154.7) | 11 (133.5) | 9 (110.3) | 8 (98.4) | 6 (74.3) | 4 (49.8) | 11 (137.3) | 2 (25.1) | 1 (12.5) | 5 (62.9) | 5 (64.0) |
| Burglaries (per 100,000) | 47 (563.3) | 54 (644.5) | 53 (629.8) | 57 (678.1) | 48 (582.5) | 36 (441.1) | 45 (553.7) | 32 (396.0) | 36 (448.3) | 19 (237.1) | 9 (113.1) | 19 (237.1) | 21 (264.2) | 20 (256.1) |
| Thefts (per 100,000) | 322 (3,859) | 281 (3,354) | 355 (4,218) | 350 (4,164) | 427 (5,181) | 368 (4,509) | 425 (5,229) | 355 (4,394) | 304 (3,786) | 221 (2,758) | 194 (2,438) | 151 (1,885) | 112 (1,409) | 144 (1,844) |
| Auto thefts (per 100,000) | 10 (119.8) | 11 (131.3) | 14 (166.3) | 9 (107.1) | 14 (169.9) | 9 (110.3) | 4 (49.2) | 8 (99.0) | 18 (224.2) | 12 (149.7) | 9 (113.1) | 31 (386.9) | 14 (176.1) | 24 (307.4) |
| Arson (per 100,000) | 2 (24.0) | 1 (11.9) | 1 (11.9) | 2 (23.8) | 1 (12.1) | 0 (0.0) | 1 (12.3) | 0 (0.0) | 0 (0.0) | 0 (0.0) | 1 (12.6) | 1 (12.5) | 0 (0.0) | 1 (12.8) |
| City-Data.com crime index | 253.7 | 228.0 | 297.4 | 270.2 | 295.6 | 271.5 | 296.2 | 277.0 | 229.4 | 207.5 | 127.0 | 125.4 | 131.7 | 157.3 |
The City-Data.com crime index weighs serious crimes and violent crimes more heavily. Higher means more crime, U.S. average is 246.1. It adjusts for the number of visitors and daily workers commuting into cities.
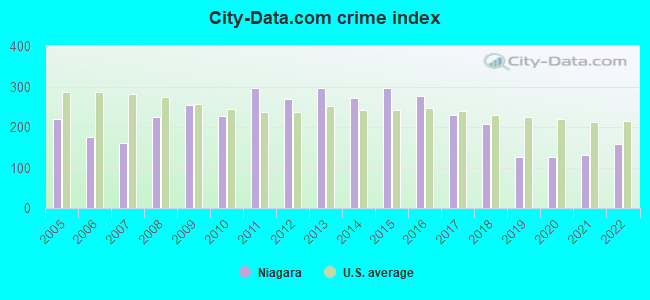
Crime rate in Niagara detailed stats: murders, rapes, robberies, assaults, burglaries, thefts, arson
Full-time law enforcement employees in 2021, including police officers: 8 (7 officers - 6 male; 1 female).
| Officers per 1,000 residents here: | 0.88 |
| New York average: | 3.28 |
 Recent articles from our blog. Our writers, many of them Ph.D. graduates or candidates, create easy-to-read articles on a wide variety of topics.
Ancestries: Italian (24.5%), German (22.0%), Irish (15.2%), English (11.4%), Polish (10.5%), French (4.8%).
Current Local Time: EST time zone
Land area: 9.39 square miles.
Population density: 892 people per square mile (low).
319 residents are foreign born (1.9% Europe, 1.4% North America).
| This town: | 3.6% |
| New York: | 20.4% |
| Niagara town: | 2.7% ($2,018) |
| New York: | 1.9% ($2,847) |
Nearest city with pop. 50,000+: Niagara Falls, NY  (2.1 miles , pop. 55,593).
Nearest city with pop. 200,000+: Buffalo, NY (16.2 miles , pop. 292,648).
Nearest city with pop. 1,000,000+: Philadelphia, PA (293.4 miles , pop. 1,517,550).
Nearest cities:
), ), ), )Latitude: 43.12 N, Longitude: 78.99 W
Area code commonly used in this area: 716
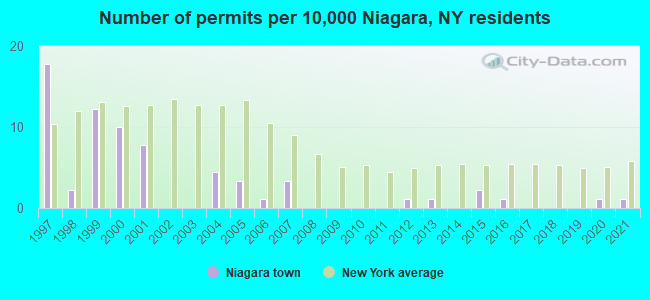
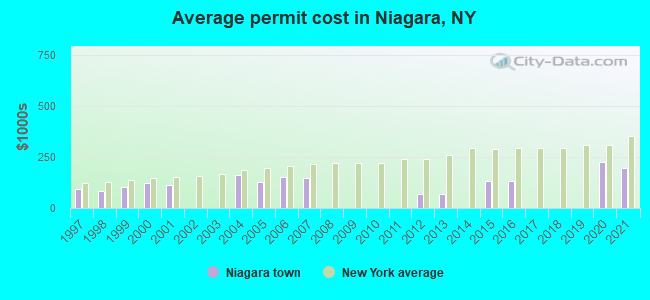
Single-family new house construction building permits:
- 2021: 1 building, cost: $199,000
- 2020: 1 building, cost: $225,000
- 2016: 1 building, cost: $135,000
- 2015: 2 buildings, average cost: $135,000
- 2013: 1 building, cost: $70,000
- 2012: 1 building, cost: $70,000
- 2007: 3 buildings, average cost: $147,700
- 2006: 1 building, cost: $150,000
- 2005: 3 buildings, average cost: $129,900
- 2004: 4 buildings, average cost: $162,500
- 2001: 7 buildings, average cost: $114,100
- 2000: 9 buildings, average cost: $121,700
- 1999: 11 buildings, average cost: $105,100
- 1998: 2 buildings, average cost: $82,500
- 1997: 16 buildings, average cost: $94,600
| Here: | 4.8% |
| New York: | 4.4% |
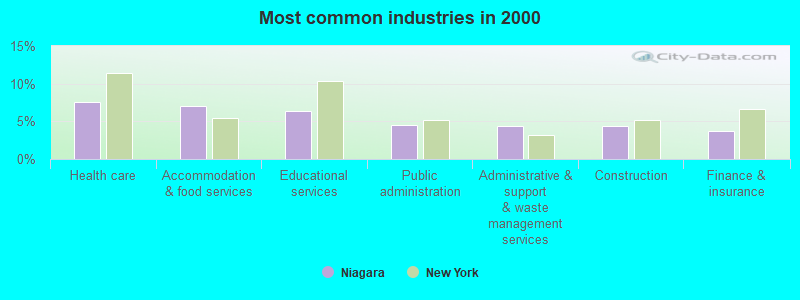
- Health care (7.6%)
- Accommodation & food services (7.1%)
- Educational services (6.3%)
- Public administration (4.5%)
- Administrative & support & waste management services (4.4%)
- Construction (4.3%)
- Finance & insurance (3.7%)
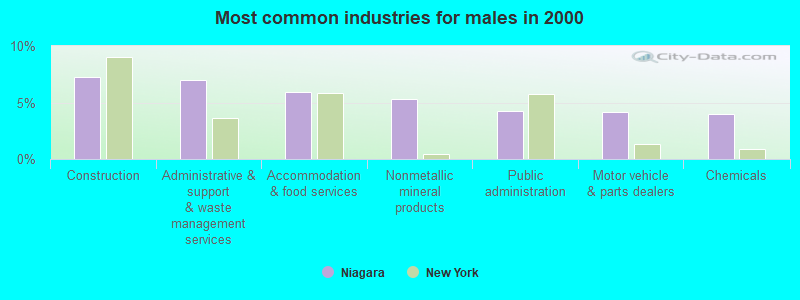
- Construction (7.3%)
- Administrative & support & waste management services (7.0%)
- Accommodation & food services (5.9%)
- Nonmetallic mineral products (5.3%)
- Public administration (4.2%)
- Motor vehicle & parts dealers (4.1%)
- Chemicals (4.0%)
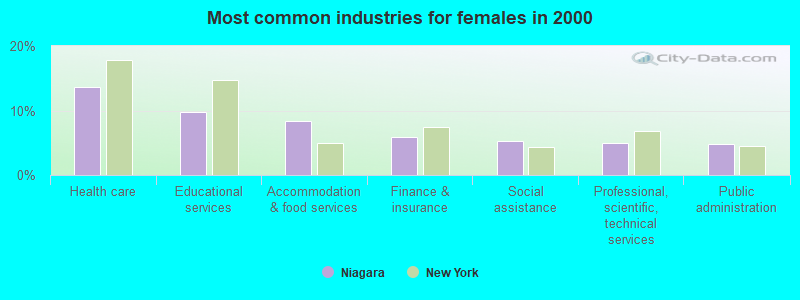
- Health care (13.7%)
- Educational services (9.8%)
- Accommodation & food services (8.3%)
- Finance & insurance (5.8%)
- Social assistance (5.3%)
- Professional, scientific, technical services (5.0%)
- Public administration (4.8%)
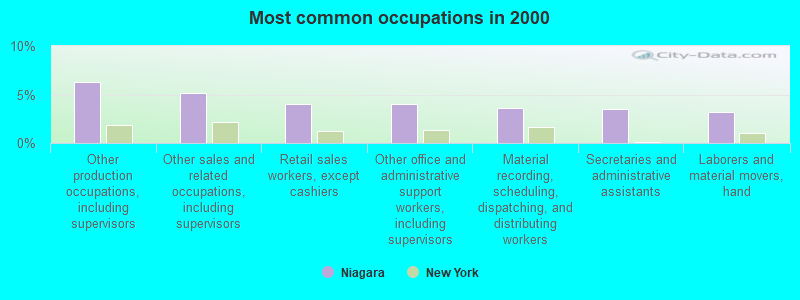
- Other production occupations, including supervisors (6.3%)
- Other sales and related occupations, including supervisors (5.1%)
- Retail sales workers, except cashiers (4.0%)
- Other office and administrative support workers, including supervisors (4.0%)
- Material recording, scheduling, dispatching, and distributing workers (3.6%)
- Secretaries and administrative assistants (3.5%)
- Laborers and material movers, hand (3.2%)
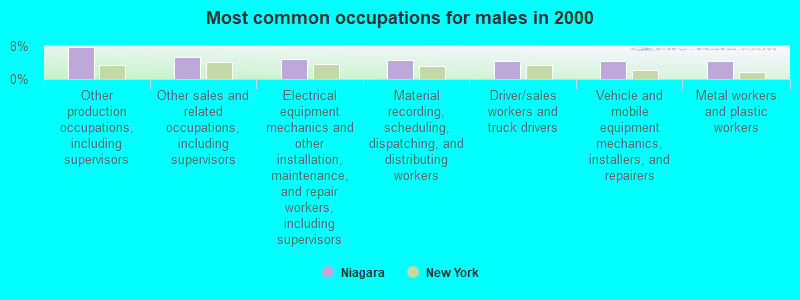
- Other production occupations, including supervisors (7.8%)
- Other sales and related occupations, including supervisors (5.4%)
- Electrical equipment mechanics and other installation, maintenance, and repair workers, including supervisors (4.8%)
- Material recording, scheduling, dispatching, and distributing workers (4.7%)
- Driver/sales workers and truck drivers (4.4%)
- Vehicle and mobile equipment mechanics, installers, and repairers (4.4%)
- Metal workers and plastic workers (4.3%)
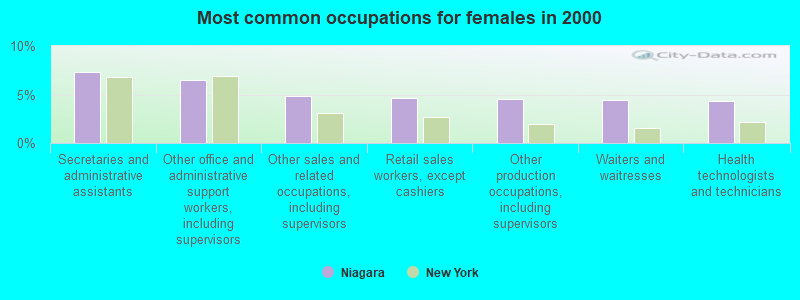
- Secretaries and administrative assistants (7.3%)
- Other office and administrative support workers, including supervisors (6.5%)
- Other sales and related occupations, including supervisors (4.8%)
- Retail sales workers, except cashiers (4.7%)
- Other production occupations, including supervisors (4.6%)
- Waiters and waitresses (4.5%)
- Health technologists and technicians (4.4%)
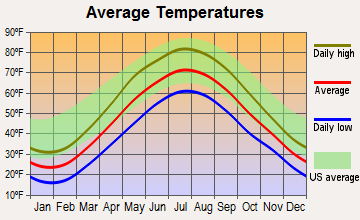
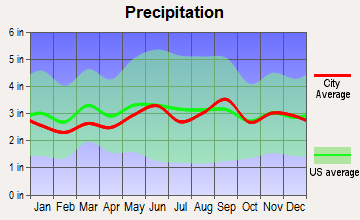
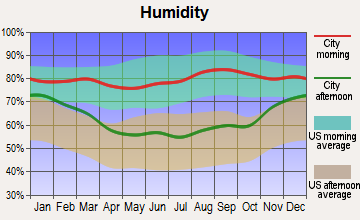
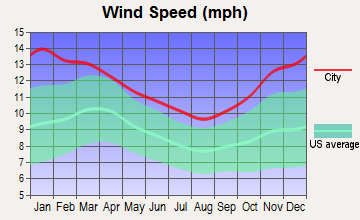
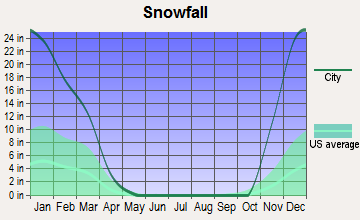
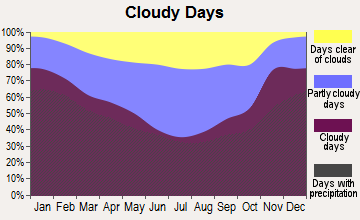
Average climate in Niagara, New York
Based on data reported by over 4,000 weather stations
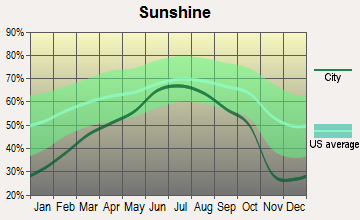
(lower is better)
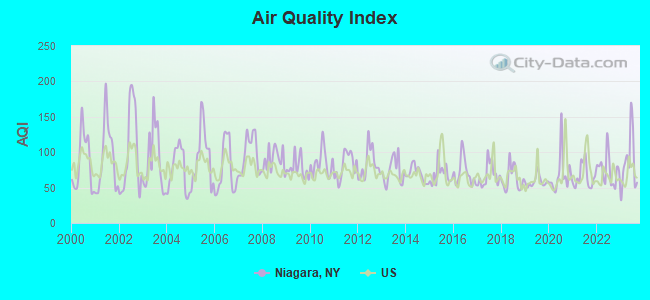
Air Quality Index (AQI) level in 2023 was 86.0. This is about average.
| City: | 86.0 |
| U.S.: | 72.6 |
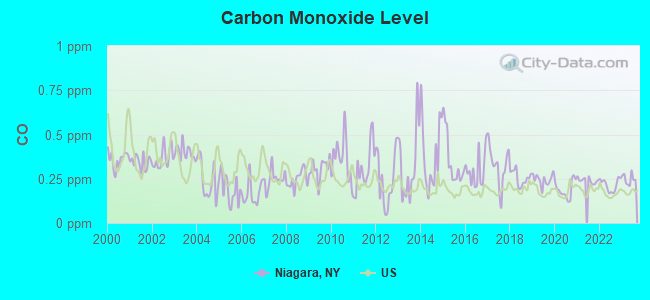
Carbon Monoxide (CO) [ppm] level in 2023 was 0.248. This is about average. Closest monitor was 2.1 miles away from the city center.
| City: | 0.248 |
| U.S.: | 0.251 |
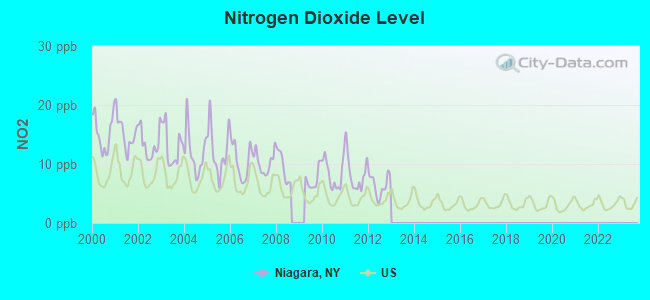
Nitrogen Dioxide (NO2) [ppb] level in 2012 was 6.43. This is worse than average. Closest monitor was 2.1 miles away from the city center.
| City: | 6.43 |
| U.S.: | 5.11 |
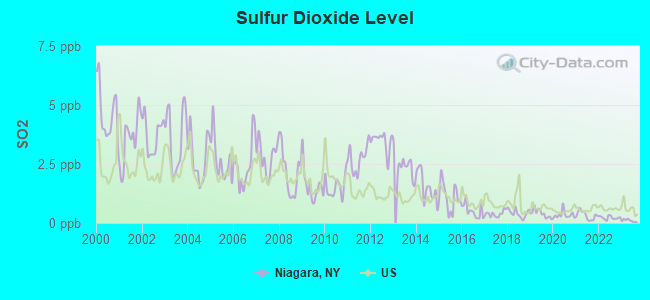
Sulfur Dioxide (SO2) [ppb] level in 2023 was 0.107. This is significantly better than average. Closest monitor was 2.4 miles away from the city center.
| City: | 0.107 |
| U.S.: | 1.515 |
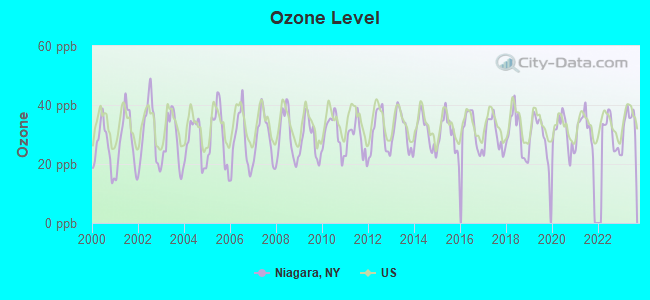
Ozone [ppb] level in 2023 was 33.8. This is about average. Closest monitor was 2.1 miles away from the city center.
| City: | 33.8 |
| U.S.: | 33.3 |
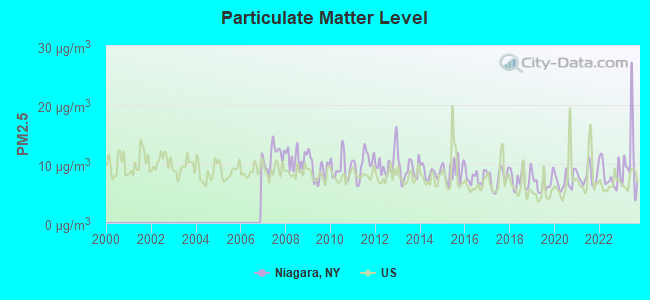
Particulate Matter (PM2.5) [µg/m3] level in 2023 was 10.6. This is worse than average. Closest monitor was 2.4 miles away from the city center.
| City: | 10.6 |
| U.S.: | 8.1 |
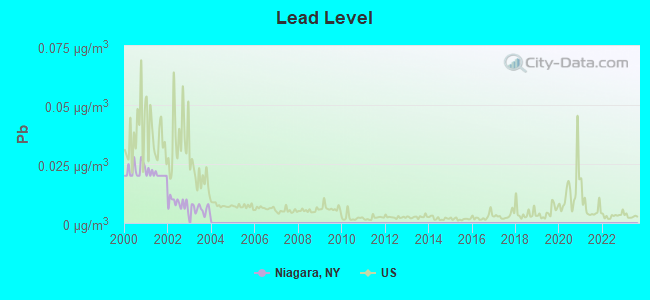
Lead (Pb) [µg/m3] level in 2003 was 0.00542. This is significantly better than average. Closest monitor was 2.1 miles away from the city center.
| City: | 0.00542 |
| U.S.: | 0.00931 |
Earthquake activity:
Niagara-area historical earthquake activity is significantly above New York state average. It is 68% smaller than the overall U.S. average.On 9/25/1998 at 19:52:52, a magnitude 5.2 (4.8 MB, 4.3 MS, 5.2 LG, 4.5 MW, Depth: 3.1 mi, Class: Moderate, Intensity: VI - VII) earthquake occurred 133.5 miles away from the city center
On 1/31/1986 at 16:46:43, a magnitude 5.0 (5.0 MB) earthquake occurred 152.5 miles away from Niagara center
On 10/7/1983 at 10:18:46, a magnitude 5.3 (5.1 MB, 5.3 LG, 5.1 ML) earthquake occurred 240.1 miles away from Niagara center
On 8/23/2011 at 17:51:04, a magnitude 5.8 (5.8 MW, Depth: 3.7 mi) earthquake occurred 364.3 miles away from Niagara center
On 4/20/2002 at 10:50:47, a magnitude 5.3 (5.3 ML, Depth: 3.0 mi) earthquake occurred 281.2 miles away from Niagara center
On 4/20/2002 at 10:50:47, a magnitude 5.2 (5.2 MB, 4.2 MS, 5.2 MW, 5.0 MW) earthquake occurred 279.7 miles away from Niagara center
Magnitude types: regional Lg-wave magnitude (LG), body-wave magnitude (MB), local magnitude (ML), surface-wave magnitude (MS), moment magnitude (MW)
Natural disasters:
The number of natural disasters in Niagara County (22) is greater than the US average (15).Major Disasters (Presidential) Declared: 11
Emergencies Declared: 10
Causes of natural disasters: Floods: 7, Storms: 6, Snowstorms: 4, Hurricanes: 2, Winds: 2, Winter Storms: 2, Blizzard: 1, Chemical Waste: 1, Power Outage: 1, Snow: 1, Tornado: 1, Other: 2 (Note: some incidents may be assigned to more than one category).
Hospitals and medical centers near Niagara:
- UCPA OF NIAGARA COUNTY (Hospital, about 2 miles away; NIAGARA FALLS, NY)
- NIAGARA RENAL CENTER INC (Dialysis Facility, about 3 miles away; NIAGARA FALLS, NY)
- UCPA OF NIAGARA COUNTY (Hospital, about 3 miles away; NIAGARA FALLS, NY)
- MT ST MARYS LONG TERM CARE FACILITY, INC. (Nursing Home, about 4 miles away; NIAGARA FALLS, NY)
- NIAGARA FALLS KIDNEY CARE CENTER (Dialysis Facility, about 4 miles away; NIAGARA FALLS, NY)
- NIAGARA REHABILITATION AND NURSING CENTER (Nursing Home, about 4 miles away; NIAGARA FALLS, NY)
- MOUNT ST MARY'S HOSPITAL AND HEALTH CENTER Acute Care Hospitals (about 4 miles away; LEWISTON, NY)
Amtrak stations near Niagara:
- 3 miles: NIAGARA FALLS (27TH & LOCKPORT RD.) . Services: ticket office, partially wheelchair accessible, enclosed waiting area, public restrooms, public payphones, vending machines, free short-term parking, call for car rental service, call for taxi service.
- 5 miles: NIAGARA FALLS (4267 BRIDGE ST.) . Services: ticket office, partially wheelchair accessible, public payphones, vending machines, free short-term parking, call for taxi service, intercity bus service.
- 13 miles: ST. CATHARINES (ST. CATHERINES, 5 GREAT WESTERN AVE.) . Services: ticket office, partially wheelchair accessible, enclosed waiting area, public restrooms, public payphones, snack bar, free short-term parking, call for car rental service, call for taxi service.
Colleges/universities with over 2000 students nearest to Niagara:
- Niagara University (about 4 miles; Niagara University, NY; Full-time enrollment: 3,677)
- Niagara County Community College (about 7 miles; Sanborn, NY; FT enrollment: 4,757)
- University at Buffalo (about 13 miles; Buffalo, NY; FT enrollment: 25,415)
- Buffalo State SUNY (about 14 miles; Buffalo, NY; FT enrollment: 10,439)
- Daemen College (about 15 miles; Amherst, NY; FT enrollment: 2,365)
- Medaille College (about 15 miles; Buffalo, NY; FT enrollment: 2,361)
- Canisius College (about 15 miles; Buffalo, NY; FT enrollment: 4,376)
Private elementary/middle school in Niagara:
- STELLA NIAGARA EDUCATION PARK (Students: 159, Location: 4421 LOWER RIVER RD, Grades: PK-8)
Points of interest:
Notable locations in Niagara: Falcon Manor (A), Allied Waste Niagara Falls Landfill (B), Niagara Active Fire Company (C), Niagara Town Hall (D). Display/hide their locations on the map
Churches in Niagara include: Saint Leos Church (A), Hope Church (B), Colonial Village Presbyterian Church (C), Niagara Presbyterian Church (D). Display/hide their locations on the map
Park in Niagara: Reservoir Park (1). Display/hide its location on the map
Birthplace of: James Madison (Medal of Honor) - Army Medal of Honor recipient.
| This town: | 2.3 people |
| New York: | 2.6 people |
| This town: | 62.4% |
| Whole state: | 63.5% |
| This town: | 7.8% |
| Whole state: | 6.8% |
Likely homosexual households (counted as self-reported same-sex unmarried-partner households)
- Lesbian couples: 0.4% of all households
- Gay men: 0.2% of all households
| This town: | 9.3% |
| Whole state: | 14.6% |
| This town: | 4.3% |
| Whole state: | 7.4% |
4 people in nursing facilities/skilled-nursing facilities in 2010
Banks with branches in Niagara (2011 data):
- HSBC Bank USA, National Association: Town Of Niagara Branch at 4381 Military Road, branch established on 1964/06/29. Info updated 2010/11/30: Bank assets: $206,009.7 mil, Deposits: $149,026.8 mil, headquarters in Mc Lean, VA, positive income, 474 total offices, Holding Company: Hsbc Holdings Plc
For population 15 years and over in Niagara:
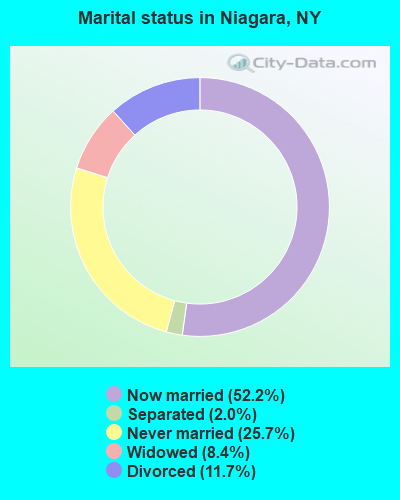
- Never married: 25.7%
- Now married: 52.2%
- Separated: 2.0%
- Widowed: 8.4%
- Divorced: 11.7%
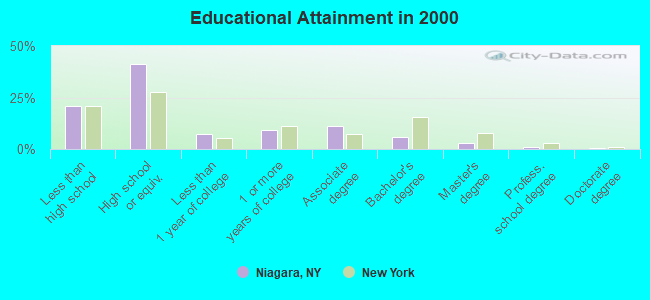
For population 25 years and over in Niagara:
- High school or higher: 79.1%
- Bachelor's degree or higher: 10.3%
- Graduate or professional degree: 4.4%
- Unemployed: 5.3%
- Mean travel time to work (commute): 17.1 minutes
| Here: | 10.1 |
| New York average: | 14.2 |
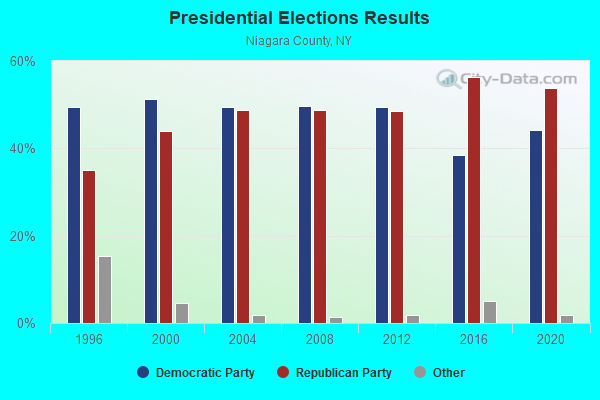
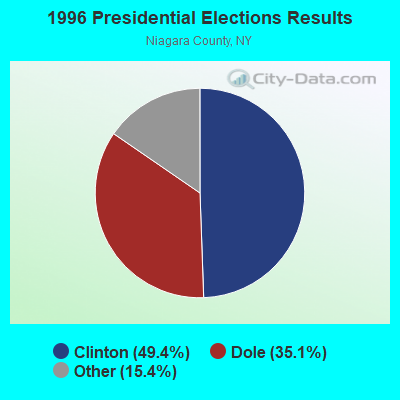
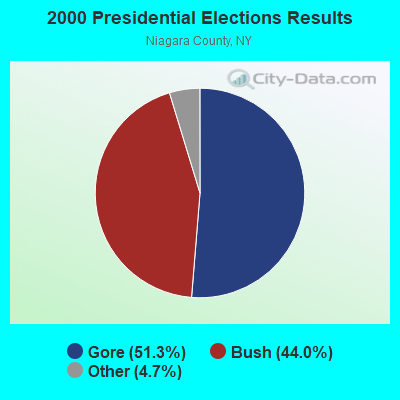
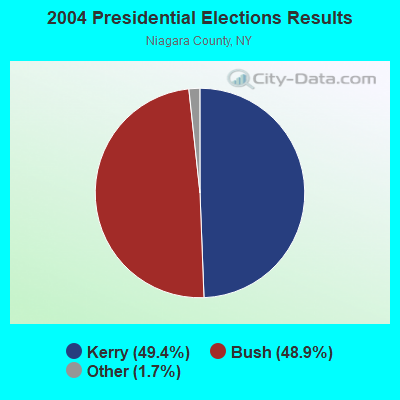
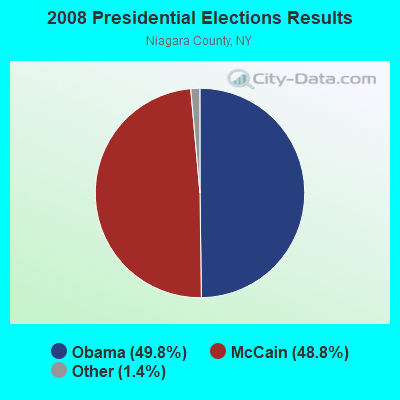
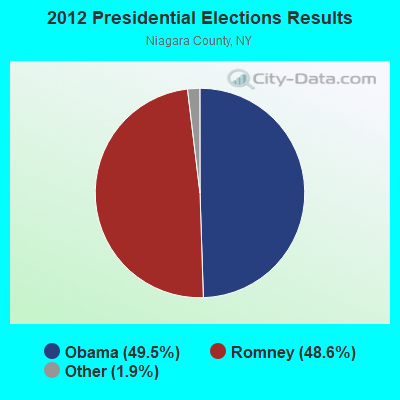
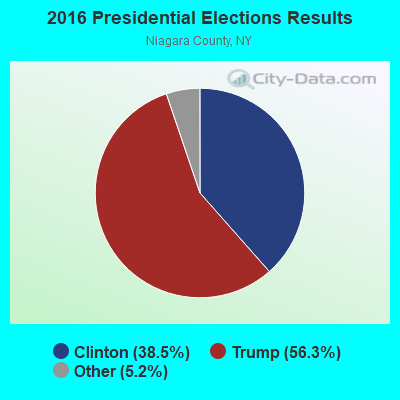
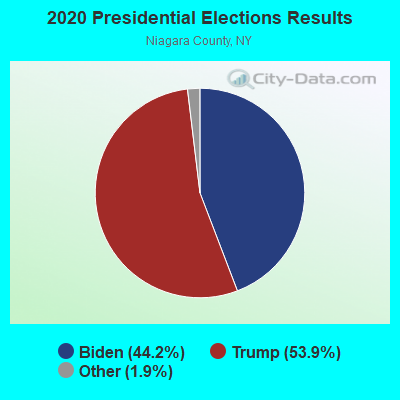
Graphs represent county-level data. Detailed 2008 Election Results
Religion statistics for Niagara, NY (based on Niagara County data)
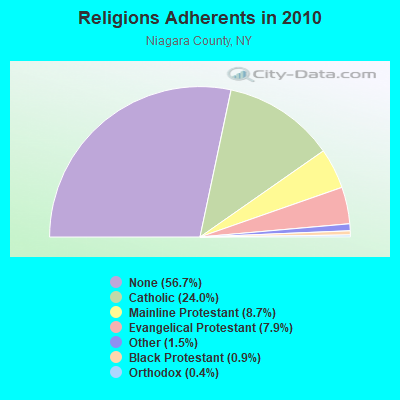
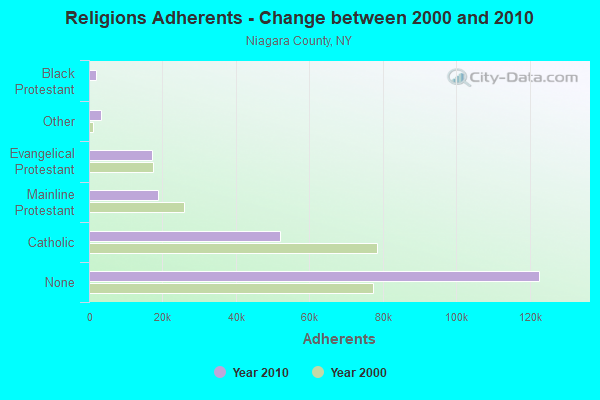
| Religion | Adherents | Congregations |
|---|---|---|
| Catholic | 51,948 | 30 |
| Mainline Protestant | 18,836 | 71 |
| Evangelical Protestant | 17,174 | 78 |
| Other | 3,157 | 17 |
| Black Protestant | 1,895 | 11 |
| Orthodox | 810 | 5 |
| None | 122,649 | - |
Food Environment Statistics:
| Here: | 1.54 / 10,000 pop. |
| New York: | 4.13 / 10,000 pop. |
| Niagara County: | 0.05 / 10,000 pop. |
| New York: | 0.06 / 10,000 pop. |
| Here: | 1.26 / 10,000 pop. |
| New York: | 0.92 / 10,000 pop. |
| This county: | 2.99 / 10,000 pop. |
| New York: | 1.68 / 10,000 pop. |
| Niagara County: | 8.02 / 10,000 pop. |
| New York: | 8.82 / 10,000 pop. |
| This county: | 8.4% |
| New York: | 8.2% |
| This county: | 26.6% |
| New York: | 23.8% |
| This county: | 13.2% |
| New York: | 15.6% |
Businesses in Niagara, NY
- Tim Hortons: 1
Strongest AM radio stations in Niagara:
- WJJL (1440 AM; 5 kW; NIAGARA FALLS, NY; Owner: M.J. PHILLIPS COMMUNICATIONS, INC.)
- WTOR (770 AM; daytime; 9 kW; YOUNGSTOWN, NY; Owner: BIRACH BROADCASTING CORPORATION)
- WBEN (930 AM; 5 kW; BUFFALO, NY; Owner: ENTERCOM BUFFALO LICENSE, LLC)
- WWKB (1520 AM; 50 kW; BUFFALO, NY; Owner: ENTERCOM BUFFALO LICENSE, LLC)
- WGR (550 AM; 5 kW; BUFFALO, NY; Owner: ENTERCOM BUFFALO LICENSE, LLC)
- WHAM (1180 AM; 50 kW; ROCHESTER, NY; Owner: CITICASTERS LICENSES, L.P.)
- WNED (970 AM; 5 kW; BUFFALO, NY)
- WXRL (1300 AM; 5 kW; LANCASTER, NY; Owner: DOME BROADCASTING, INC.)
- WHLD (1270 AM; 5 kW; NIAGARA FALLS, NY; Owner: CITADEL BROADCASTING COMPANY)
- WUFO (1080 AM; daytime; 1 kW; AMHERST, NY)
- WLVL (1340 AM; 1 kW; LOCKPORT, NY; Owner: CULVER COMMUNICATIONS CORP., INC.)
- WWWS (1400 AM; 1 kW; BUFFALO, NY; Owner: ENTERCOM BUFFALO LICENSE, LLC)
- WECK (1230 AM; 1 kW; CHEEKTOWAGA, NY; Owner: INFINITY RADIO OPERATIONS INC.)
Strongest FM radio stations in Niagara:
- WGRF (96.9 FM; BUFFALO, NY; Owner: CITADEL BROADCASTING COMPANY)
- WKSE (98.5 FM; NIAGARA FALLS, NY; Owner: ENTERCOM BUFFALO LICENSE, LLC)
- WBLK (93.7 FM; DEPEW, NY; Owner: INFINITY RADIO OPERATIONS INC.)
- WJYE (96.1 FM; BUFFALO, NY; Owner: INFINITY RADIO OPERATIONS INC.)
- WTSS (102.5 FM; BUFFALO, NY; Owner: ENTERCOM BUFFALO LICENSE, LLC)
- WYRK (106.5 FM; BUFFALO, NY; Owner: INFINITY RADIO OPERATIONS INC.)
- W207BG (89.3 FM; GRAND ISLAND, NY; Owner: FAMILY LIFE MINISTRIES, INC.)
- WEDG (103.3 FM; BUFFALO, NY; Owner: CITADEL BROADCASTING COMPANY)
- WBFO (88.7 FM; BUFFALO, NY; Owner: STATE UNIVERSITY OF NEW YORK)
- W284AP (104.7 FM; BUFFALO, NY; Owner: FAMILY LIFE MINISTRIES, INC.)
- WHTT-FM (104.1 FM; BUFFALO, NY; Owner: CITADEL BROADCASTING COMPANY)
- WNED-FM (94.5 FM; BUFFALO, NY; Owner: WESTERN NEW YORK PUBLIC B/C ASSOC.)
- WDCX (99.5 FM; BUFFALO, NY; Owner: KIMTRON, INC.)
- WBNY (91.3 FM; BUFFALO, NY; Owner: STATE UNIVERSITY OF NEW YORK)
TV broadcast stations around Niagara:
- WNED-TV (Channel 17; BUFFALO, NY; Owner: WESTERN NY PUBLIC BROADCASTING ASSOC.)
- WUTV (Channel 29; BUFFALO, NY; Owner: WUTV LICENSEE, LLC)
- WNLO (Channel 23; BUFFALO, NY; Owner: WIVB BROADCASTING, LLC)
- WBNF-CA (Channel 15; BUFFALO, NY; Owner: FAITH BROADCASTING NETWORK, INC.)
- WDTB-LP (Channel 39; HAMBURG, NY; Owner: WORD OF GOD FELLOWSHIP, INC.)
- WFHW-LP (Channel 58; BUFFALO, NY; Owner: CITIZENS TELEVISION SYSTEM, INC.)
- WBXZ-LP (Channel 56; BUFFALO, NY; Owner: RENARD COMMUNICATIONS CORP.)
- WKBW-TV (Channel 7; BUFFALO, NY; Owner: WKBW-TV LICENSE, INC.)
- WGRZ-TV (Channel 2; BUFFALO, NY; Owner: MULTIMEDIA ENTERTAINMENT, INC.)
- WNYO-TV (Channel 49; BUFFALO, NY; Owner: NEW YORK TELEVISION, INC.)
- WIVB-TV (Channel 4; BUFFALO, NY; Owner: WIVB BROADCASTING, LLC)
Medal of Honor Recipients
Medal of Honor Recipients born in Niagara: Dennis T. Kirby, James Madison.
- National Bridge Inventory (NBI) Statistics
- 20Number of bridges
- 144ft / 44.2mTotal length
- $39,401,000Total costs
- 210,953Total average daily traffic
- 10,925Total average daily truck traffic
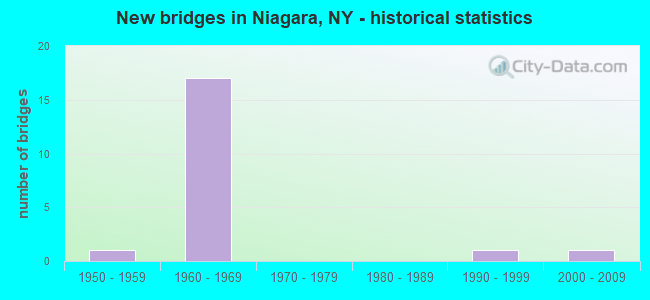
- New bridges - historical statistics
- 11950-1959
- 171960-1969
- 11990-1999
- 12000-2009
FCC Registered Antenna Towers:
27 (See the full list of FCC Registered Antenna Towers in Niagara)FCC Registered Microwave Towers:
1- BOOSTER, 6926 Williams Rd (Lat: 43.085500 Lon: -78.940889), Type: Ltower, Structure height: 6.1 m, Call Sign: WRUP971, Licensee ID: L00032168,
Assigned Frequencies: 23035.0 MHz, 23035.0 MHz, 23035.0 MHz, 23035.0 MHz, 23035.0 MHz, 23035.0 MHz, 23035.0 MHz, 23035.0 MHz, 23035.0 MHz, 23035.0 MHz, 23035.0 MHz, Grant Date: 09/20/2022, Expiration Date: 09/20/2032, Certifier: Daniel Handrich, Registrant: Niagara County Water District, 5450 Ernest Road, Lockport, NY 14094, Phone: (716) 434-8835, Fax: (716) 434-8836, Email:
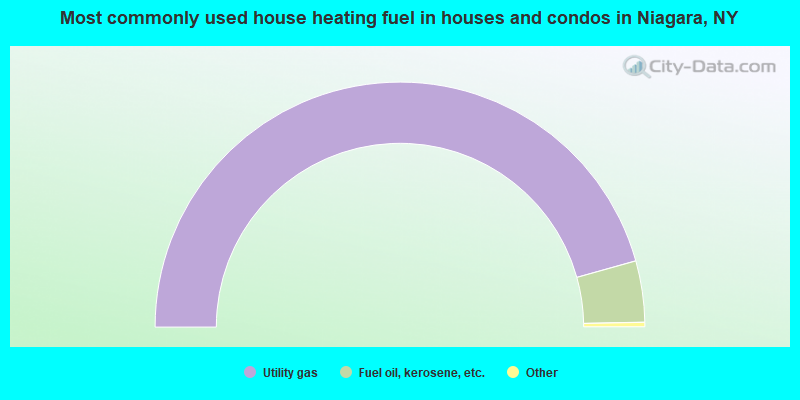
- 91.4%Utility gas
- 8.1%Fuel oil, kerosene, etc.
- 0.3%Electricity
- 0.2%Wood
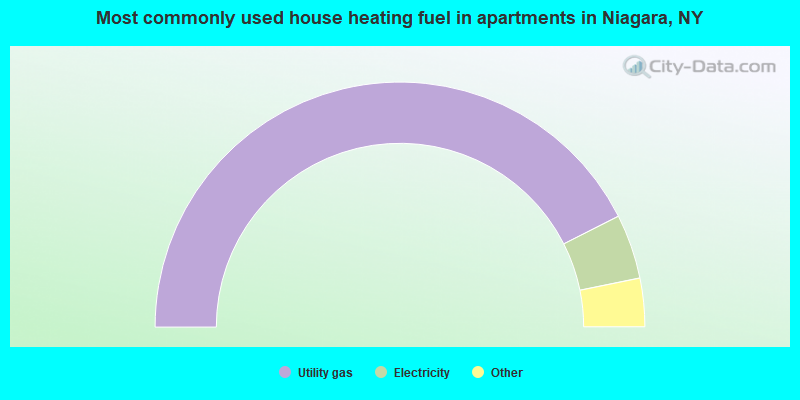
- 85.0%Utility gas
- 8.5%Electricity
- 3.3%Fuel oil, kerosene, etc.
- 2.0%Bottled, tank, or LP gas
- 1.1%No fuel used
Niagara compared to New York state average:
- Median house value below state average.
- Unemployed percentage significantly below state average.
- Black race population percentage significantly below state average.
- Hispanic race population percentage significantly below state average.
- Foreign-born population percentage significantly below state average.
- Renting percentage below state average.
- Length of stay since moving in significantly above state average.
- Number of rooms per house significantly below state average.
- House age significantly below state average.
- Percentage of population with a bachelor's degree or higher significantly below state average.
Niagara on our top lists:
- #1 on the list of "Top 101 cities with largest percentage of females in industries: drugs, sundries, and chemical and allied products merchant wholesalers (population 5,000+)"
- #3 on the list of "Top 101 cities with largest percentage of males in industries: nonmetallic mineral products (population 5,000+)"
- #9 on the list of "Top 101 cities with largest percentage of males in occupations: supervisors of transportation and material moving workers (population 5,000+)"
- #10 on the list of "Top 101 cities with largest percentage of females in occupations: financial managers (population 5,000+)"
- #13 on the list of "Top 101 cities with largest percentage of females in occupations: supervisors of construction and extraction workers (population 5,000+)"
- #13 on the list of "Top 101 cities with largest percentage of males in industries: music stores (population 5,000+)"
- #16 on the list of "Top 101 cities with largest percentage of females in industries: nonmetallic mineral products (population 5,000+)"
- #18 on the list of "Top 101 cities with the lowest number of police officers per 1000 residents (population 5,000+)"
- #23 on the list of "Top 101 cities with largest percentage of females in occupations: special education teachers (population 5,000+)"
- #28 on the list of "Top 101 cities with largest percentage of males in industries: office supplies and stationery stores (population 5,000+)"
- #32 on the list of "Top 101 cities with largest percentage of females in occupations: supervisors of transportation and material moving workers (population 5,000+)"
- #34 on the list of "Top 101 cities with largest percentage of males in industries: leather and allied products (population 5,000+)"
- #36 on the list of "Top 101 cities with largest percentage of males in occupations: food and beverage serving workers except waiters/waitresses (population 5,000+)"
- #40 on the list of "Top 101 cities with largest percentage of males in industries: warehousing and storage (population 5,000+)"
- #43 on the list of "Top 101 cities with largest percentage of females in industries: jewelry, luggage, and leather goods stores (population 5,000+)"
- #54 on the list of "Top 101 cities with largest percentage of males in industries: electrical equipment, appliances, and components (population 5,000+)"
- #57 on the list of "Top 101 cities with largest percentage of males in industries: book stores and news dealers (population 5,000+)"
- #66 on the list of "Top 101 cities with largest percentage of males in industries: motor vehicle and parts dealers (population 5,000+)"
- #68 on the list of "Top 101 cities with largest percentage of females in industries: furniture and home furnishings, and household appliance stores (population 5,000+)"
- #69 on the list of "Top 101 cities with largest percentage of males in industries: chemicals (population 5,000+)"
- #19 on the list of "Top 101 counties with the highest Sulfur Oxides Annual air pollution readings in 2012 (µg/m3)"
- #26 on the list of "Top 101 counties with the lowest ground withdrawal of fresh water for public supply"
- #49 on the list of "Top 101 counties with the lowest percentage of residents relocating from other counties between 2010 and 2011 (pop. 50,000+)"
- #55 on the list of "Top 101 counties with the lowest percentage of residents relocating to other counties in 2011 (pop. 50,000+)"
- #56 on the list of "Top 101 counties with the lowest number of births per 1000 residents 2007-2013"

|
Total of 1 patent application in 2008-2024.