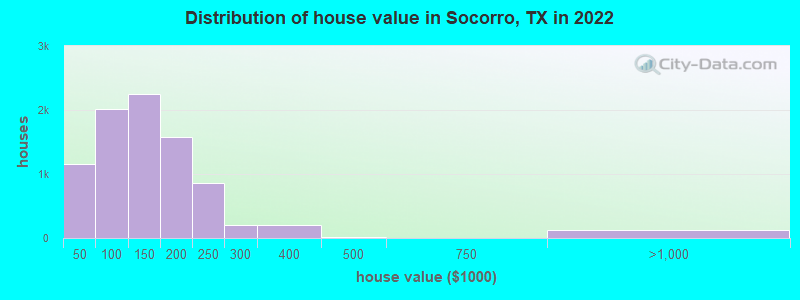
Estimated median house or condo value in 2022: $128,358 (it was $48,700 in 2000)
Socorro:
$128,358
TX:
$275,400
Mean prices in 2022:all housing units: $201,585; detached houses: $209,868; townhouses or other attached units: $191,837; in 2-unit structures: $123,074; in 3-to-4-unit structures: $136,683; in 5-or-more-unit structures: $528,240; mobile homes: $60,145; occupied boats, rvs, vans, etc.: $22,851
Median gross rent in 2022: $963.
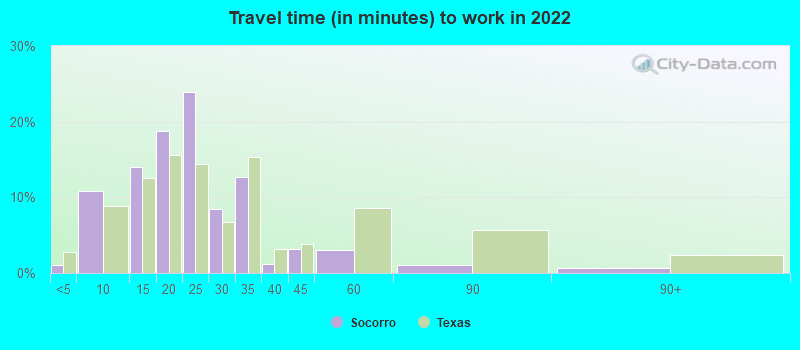
March 2022 cost of living index in Socorro: 81.3 (low, U.S. average is 100)
Percentage of residents living in poverty in 2022: 23.5%
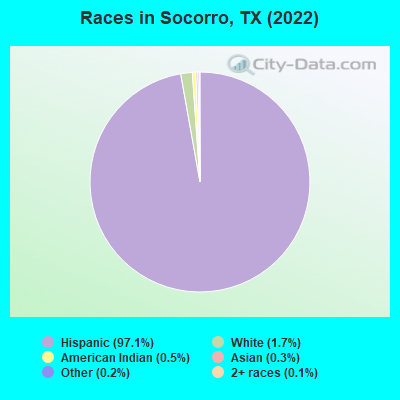
(19.3% for White Non-Hispanic residents, 1.3% for Black residents, 23.5% for Hispanic or Latino residents, 50.8% for American Indian residents, 25.3% for other race residents, 25.6% for two or more races residents)
According to our research of Texas and other state lists, there were 32 registered sex offenders living in Socorro, Texas as of April 28, 2024. The ratio of all residents to sex offenders in Socorro is 1,036 to 1. The ratio of registered sex offenders to all residents in this city is lower than the state average.
Crime rates in Socorro by year
Type
2009
2010
2011
2012
2013
2014
2015
2016
2017
2018
2019
2020
2021
2022
Murders (per 100,000)
0 (0.0)
0 (0.0)
0 (0.0)
0 (0.0)
0 (0.0)
0 (0.0)
0 (0.0)
0 (0.0)
0 (0.0)
0 (0.0)
0 (0.0)
0 (0.0)
1 (2.8)
3 (7.9)
Rapes (per 100,000)
3 (9.2)
6 (18.7)
3 (9.2)
4 (12.0)
8 (24.3)
2 (6.1)
2 (6.0)
5 (14.9)
6 (17.9)
6 (17.5)
5 (14.4)
4 (11.6)
17 (46.9)
22 (58.0)
Robberies (per 100,000)
16 (49.2)
16 (50.0)
6 (18.4)
6 (18.0)
5 (15.2)
5 (15.3)
8 (24.2)
7 (20.9)
7 (20.9)
8 (23.3)
4 (11.5)
5 (14.4)
6 (16.5)
9 (23.7)
Assaults (per 100,000)
85 (261.4)
69 (215.5)
48 (146.8)
45 (135.0)
45 (136.8)
35 (107.3)
28 (84.6)
32 (95.7)
35 (104.6)
31 (90.3)
34 (97.6)
39 (112.6)
51 (140.6)
51 (134.4)
Burglaries (per 100,000)
200 (615.0)
143 (446.7)
85 (260.0)
79 (237.1)
89 (270.6)
69 (211.5)
71 (214.4)
42 (125.6)
38 (113.5)
24 (69.9)
38 (109.1)
22 (63.5)
49 (135.1)
42 (110.7)
Thefts (per 100,000)
442 (1,359)
400 (1,249)
384 (1,175)
336 (1,008)
324 (985.1)
295 (904.2)
248 (749.0)
237 (708.6)
233 (696.1)
202 (588.5)
232 (665.9)
174 (502.5)
182 (501.6)
182 (479.6)
Auto thefts (per 100,000)
65 (199.9)
61 (190.5)
42 (128.5)
30 (90.0)
46 (139.9)
21 (64.4)
32 (96.6)
24 (71.8)
22 (65.7)
25 (72.8)
29 (83.2)
21 (60.6)
52 (143.3)
57 (150.2)
Arson (per 100,000)
1 (3.1)
8 (25.0)
7 (21.4)
2 (6.0)
0 (0.0)
0 (0.0)
0 (0.0)
0 (0.0)
1 (3.0)
0 (0.0)
1 (2.9)
2 (5.8)
3 (8.3)
1 (2.6)
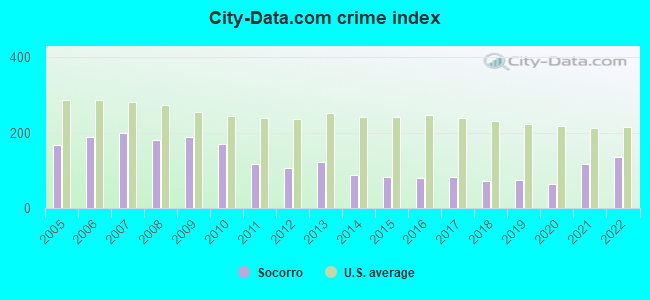
City-Data.com crime index
187.8
169.6
117.7
106.1
120.9
87.1
81.7
80.2
82.6
73.3
75.4
65.5
117.1
135.1
The City-Data.com crime index weighs serious crimes and violent crimes more heavily. Higher means more crime, U.S. average is 246.1. It adjusts for the number of visitors and daily workers commuting into cities.
Latest news from Socorro, TX collected exclusively by city-data.com from local newspapers, TV, and radio stations
Ancestries: American (1.1%).
Current Local Time: MST time zone
Land area: 17.5 square miles.
Population density: 2,158 people per square mile (low).
12,084 residents are foreign born (32.6% Latin America).
This city:
33.9%
Texas:
17.1%
Median real estate property taxes paid for housing units with mortgages in 2022: $3,580 (2.3%) Median real estate property taxes paid for housing units with no mortgage in 2022: $2,311 (2.0%)
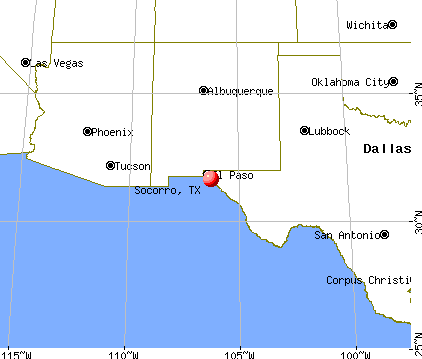
Nearest city with pop. 50,000+: El Paso, TX (13.5 miles , pop. 563,662).
Nearest city with pop. 1,000,000+: Phoenix, AZ (362.4 miles , pop. 1,321,045).
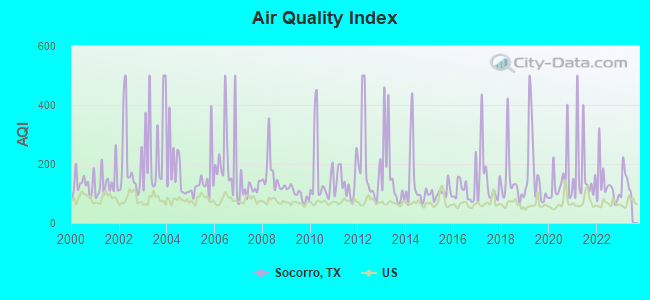
Air Quality Index (AQI) level in 2022 was 126. This is significantly worse than average.
City:
126
U.S.:
73
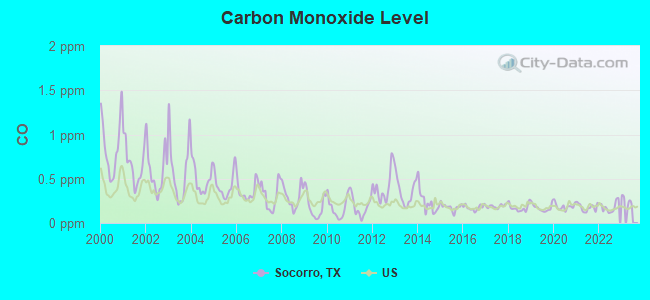
Carbon Monoxide (CO) [ppm] level in 2022 was 0.180. This is better than average.Closest monitor was 2.0 miles away from the city center.
City:
0.180
U.S.:
0.251
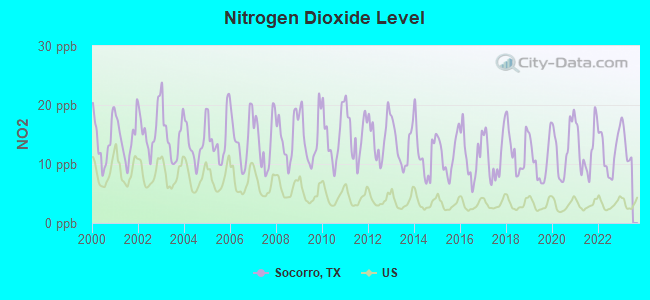
Nitrogen Dioxide (NO2) [ppb] level in 2022 was 11.9. This is significantly worse than average.Closest monitor was 2.0 miles away from the city center.
City:
11.9
U.S.:
5.1
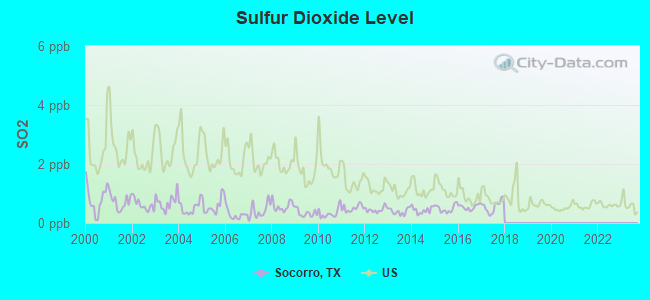
Sulfur Dioxide (SO2) [ppb] level in 2017 was 0.564. This is significantly better than average.Closest monitor was 2.0 miles away from the city center.
City:
0.564
U.S.:
1.515
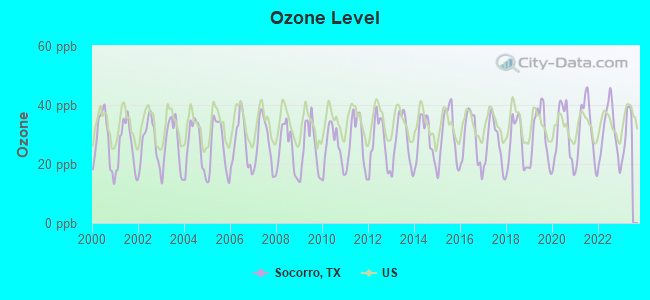
Ozone [ppb] level in 2022 was 31.0. This is about average.Closest monitor was 2.0 miles away from the city center.
City:
31.0
U.S.:
33.3
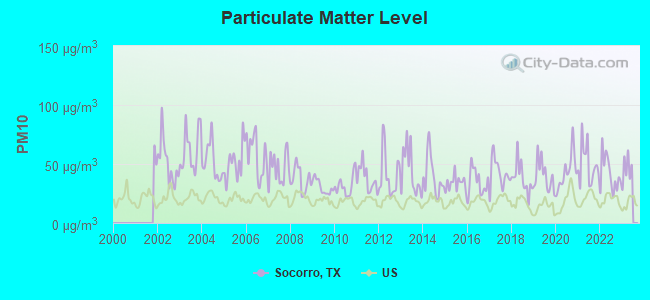
Particulate Matter (PM10) [µg/m3] level in 2022 was 41.7. This is significantly worse than average.Closest monitor was 1.2 miles away from the city center.
City:
41.7
U.S.:
19.2
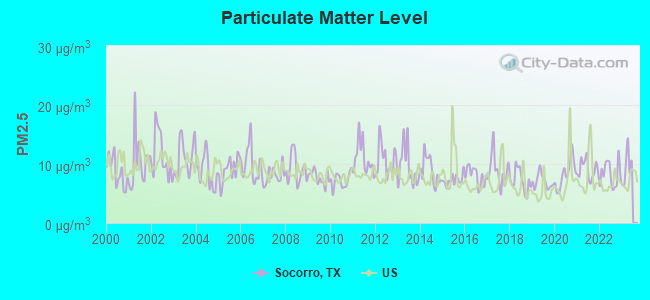
Particulate Matter (PM2.5) [µg/m3] level in 2022 was 8.32. This is about average.Closest monitor was 1.2 miles away from the city center.
City:
8.32
U.S.:
8.11
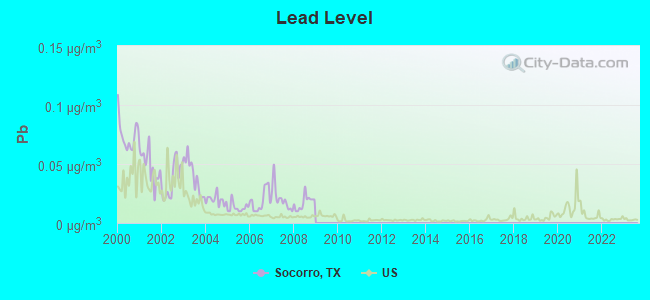
Lead (Pb) [µg/m3] level in 2008 was 0.0174. This is significantly worse than average.Closest monitor was 3.5 miles away from the city center.
City:
0.0174
U.S.:
0.0093
Earthquake activity:
Socorro-area historical earthquake activity is significantly above Texas state average. It is 400% greater than the overall U.S. average.
On 4/14/1995 at 00:32:56, a magnitude 5.7 (5.6 MB, 5.7 MS, 5.7 MW, Depth: 11.1 mi, Class: Moderate, Intensity: VI - VII) earthquake occurred 196.5 miles away from the city center On 1/4/2006 at 08:32:32, a magnitude 6.6 (6.6 MW, Depth: 8.7 mi, Class: Strong, Intensity: VII - IX) earthquake occurred 424.8 miles away from the city center On 6/29/2014 at 04:59:35, a magnitude 5.3 (5.3 MW, Depth: 4.0 mi) earthquake occurred 181.6 miles away from the city center On 3/26/2020 at 15:16:27, a magnitude 5.0 (5.0 MW, Depth: 5.9 mi) earthquake occurred 131.5 miles away from Socorro center On 5/19/1940 at 04:36:40, a magnitude 7.2 (7.2 UK, Class: Major, Intensity: VIII - XII) earthquake occurred 560.6 miles away from the city center, causing $33,000,000 total damage On 3/12/2003 at 23:41:32, a magnitude 6.4 (6.4 MW, Depth: 6.2 mi) earthquake occurred 437.7 miles away from the city center Magnitude types: body-wave magnitude (MB), surface-wave magnitude (MS), moment magnitude (MW)
Natural disasters:
The number of natural disasters in El Paso County (11) is smaller than the US average (15). Major Disasters (Presidential) Declared: 3 Emergencies Declared: 7
Causes of natural disasters: Hurricanes: 5, Fires: 2, Floods: 2, Storm: 1, Other: 2 (Note: some incidents may be assigned to more than one category).
Hospitals and medical centers near Socorro:
NEW MISSION HOME CARE (Home Health Center, about 5 miles away; CLINT, TX)
NEW HOPE COMMUNITY LIVING V I (Hospital, about 5 miles away; EL PASO, TX)
FRESENIUS MEDICAL CARE HORIZON DIALYSIS (Dialysis Facility, about 5 miles away; EL PASO, TX)
ALMAR HOME HEALTH CARE CORP (Home Health Center, about 6 miles away; EL PASO, TX)
REVIVE HOME CARE INC (Home Health Center, about 7 miles away; EL PASO, TX)
HIGHLANDS REGIONAL REHABILITATION HOSPITAL (Hospital, about 7 miles away; EL PASO, TX)
FOUNDATION SURGICAL HOSPITAL OF EL PASO Acute Care Hospitals (about 7 miles away; EL PASO, TX)
Amtrak station near Socorro:
16 miles: EL PASO (700 SAN FRANCISCO AVE.) . Services: ticket office, fully wheelchair accessible, enclosed waiting area, public restrooms, public payphones, vending machines, free short-term parking, paid long-term parking, call for car rental service, taxi stand, public transit connection.
Colleges/universities with over 2000 students nearest to Socorro:
El Paso Community College (about 11 miles; El Paso, TX; Full-time enrollment: 19,576)
Vista College (about 13 miles; El Paso, TX; FT enrollment: 3,453)
The University of Texas at El Paso (about 17 miles; El Paso, TX; FT enrollment: 18,008)
New Mexico State University-Dona Ana (about 53 miles; Las Cruces, NM; FT enrollment: 5,640)
New Mexico State University-Main Campus (about 53 miles; Las Cruces, NM; FT enrollment: 14,497)
Western New Mexico University (about 142 miles; Silver City, NM; FT enrollment: 2,456)
Eastern New Mexico University-Roswell Campus (about 155 miles; Roswell, NM; FT enrollment: 2,212)
User-submitted facts and corrections:
Can you include the URL for the Official website for the City of Socorro, Texas? WWW.SOCORROTEXAS.ORG Mark Threadgill City Clerk 124 S. Horizon Blvd. Socorro, Texas 79927 threadgillma at socorrotexas.org
Center for Employment Training, Correct location: 10610 N. Loop Dr., STE R, Socorro, TX 79927
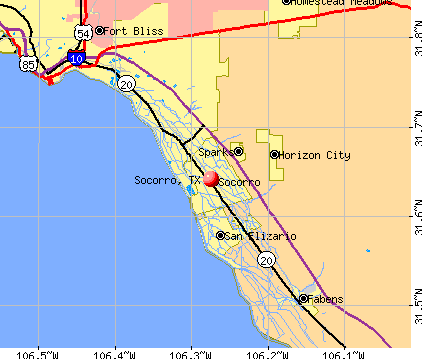
Notable locations in Socorro: Rio Vista Farm Historic District (A), Socorro Fire Department (B), Life Ambulance Service Station 2 (C), Bracero Reception Center (D). Display/hide their locations on the map
Churches in Socorro include: Segunda Iglesia Apostolica de la Fe en Cristo Jesus Church (A), Apostolic Church (B), Apostolic Assembly Church (C), Church of God (D), Saints Peter and Paul Church (E), Socorro Mission (F), Nuestra Senora de Socorro Mission (G). Display/hide their locations on the map
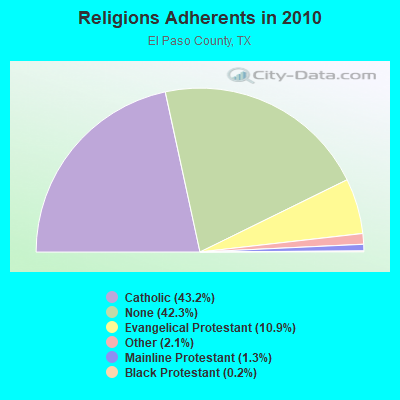
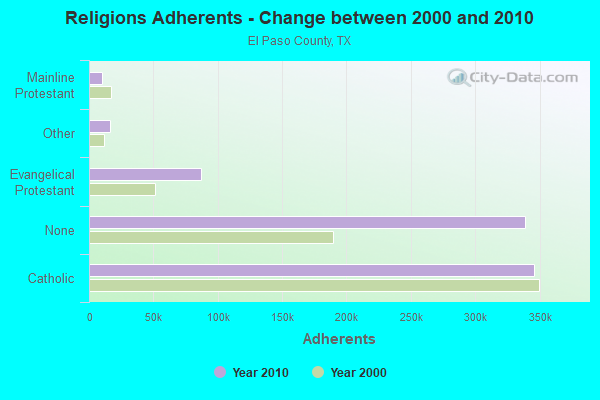
Religion statistics for Socorro, TX (based on El Paso County data)
Religion
Adherents
Congregations
Catholic
345,950
55
Evangelical Protestant
87,056
329
Other
16,675
40
Mainline Protestant
10,145
46
Black Protestant
1,703
12
Orthodox
647
3
None
338,471
-
Source: Clifford Grammich, Kirk Hadaway, Richard Houseal, Dale E.Jones, Alexei Krindatch, Richie Stanley and Richard H.Taylor. 2012. 2010 U.S.Religion Census: Religious Congregations & Membership Study. Association of Statisticians of American Religious Bodies. Jones, Dale E., et al. 2002. Congregations and Membership in the United States 2000. Nashville, TN: Glenmary Research Center. Graphs represent county-level data
Call Sign: AF5EF, Previous Call Sign: KD5ZVU, Licensee ID: L00779396, Grant Date: 11/04/2023, Expiration Date: 12/10/2033, Certifier: Rodolfo A Gutierrez, Registrant: Rodolfo A Gutierrez Sr., 486 A Dini Rozi Dr. Socorro Texas 79927, Socorro, TX 79927
Call Sign: KG7FQI, Licensee ID: L01815676, Grant Date: 09/26/2013, Expiration Date: 09/26/2023, Certifier: Benjamin R Fryer, Registrant: Benjamin R Fryer, 2180 Yellow Valley Rd, Socorro, TX 79927
Call Sign: KI5YIM, Licensee ID: L02600187, Grant Date: 10/04/2022, Expiration Date: 10/04/2032, Certifier: Tomas G Serrano, Registrant: Tomas G Serrano, 11442 Flor Gloriosa Dr, Socorro, TX 79927
FAA Registered Aircraft:
2
Aircraft: PIPER PA-28RT-201T (Category: Land, Seats: 4, Weight: Up to 12,499 Pounds), Engine: CONT MOTOR TSIO-360 SER (225 HP) (Reciprocating) N-Number: 2157M, N2157M, N-2157M, Serial Number: 28R-7931042, Year manufactured: 1979, Airworthiness Date: 02/01/1979, Certificate Issue Date: 03/02/2019 Registrant (Individual): Hiatlay Trejo, 10248 Valle Rubio Dr, Socorro, TX 79927
Aircraft: LSA AMERICA INC ALLEGRO (Category: Land, Seats: 2, Weight: Up to 12,499 Pounds), Engine: ROTAX 912 (80 HP) (4 Cycle) N-Number: 448SS, N448SS, N-448SS, Serial Number: 11-9001, Year manufactured: 2011, Airworthiness Date: 07/23/2011, Certificate Issue Date: 09/14/2016 Registrant (Individual): Peters Franz Klassen, 264 N Nevarez Rd, Socorro, TX 79927 Deregistered:Cancel Date: 01/06/2020
Home Mortgage Disclosure Act Aggregated Statistics For Year 2009 (Based on 1 full and 5 partial tracts)
A) FHA, FSA/RHS & VA Home Purchase Loans
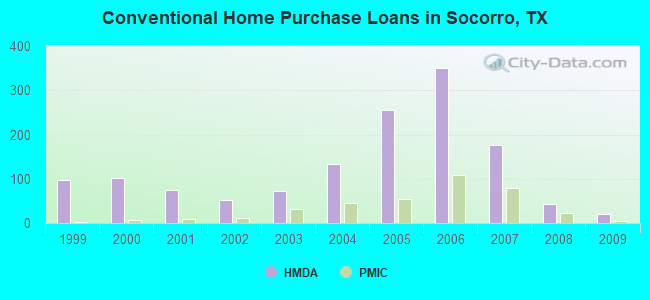
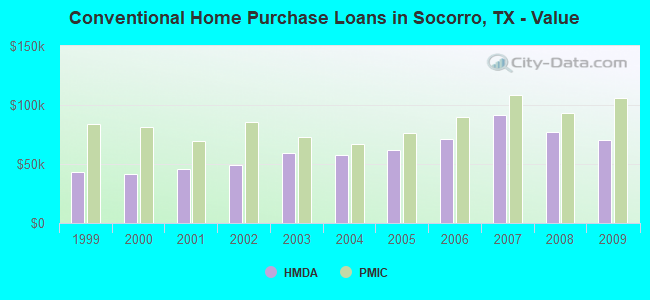
B) Conventional Home Purchase Loans
C) Refinancings
D) Home Improvement Loans
F) Non-occupant Loans on < 5 Family Dwellings (A B C & D)
G) Loans On Manufactured Home Dwelling (A B C & D)
Number
Average Value
Number
Average Value
Number
Average Value
Number
Average Value
Number
Average Value
Number
Average Value
LOANS ORIGINATED
65
$99,916
21
$70,102
77
$83,240
46
$14,433
8
$73,014
7
$54,539
APPLICATIONS APPROVED, NOT ACCEPTED
5
$71,714
6
$69,977
24
$80,085
9
$20,694
1
$75,190
7
$69,299
APPLICATIONS DENIED
16
$96,168
24
$70,465
155
$78,142
82
$24,539
7
$61,760
19
$47,726
APPLICATIONS WITHDRAWN
6
$114,778
5
$144,646
44
$91,846
11
$46,582
3
$91,037
2
$39,715
FILES CLOSED FOR INCOMPLETENESS
1
$187,000
2
$93,345
10
$78,487
2
$38,930
0
$0
1
$35,220
Aggregated Statistics For Year 2008 (Based on 1 full and 5 partial tracts)
A) FHA, FSA/RHS & VA Home Purchase Loans
B) Conventional Home Purchase Loans
C) Refinancings
D) Home Improvement Loans
F) Non-occupant Loans on < 5 Family Dwellings (A B C & D)
G) Loans On Manufactured Home Dwelling (A B C & D)
Number
Average Value
Number
Average Value
Number
Average Value
Number
Average Value
Number
Average Value
Number
Average Value
LOANS ORIGINATED
33
$99,704
43
$77,449
99
$80,362
75
$19,302
17
$71,231
5
$53,836
APPLICATIONS APPROVED, NOT ACCEPTED
5
$64,906
14
$83,711
39
$68,915
17
$35,120
3
$55,183
10
$58,395
APPLICATIONS DENIED
20
$95,392
40
$67,672
273
$79,833
140
$38,679
11
$80,288
27
$54,216
APPLICATIONS WITHDRAWN
11
$97,109
4
$73,365
71
$79,701
19
$59,720
3
$52,900
1
$30,330
FILES CLOSED FOR INCOMPLETENESS
2
$80,340
1
$58,070
13
$84,222
6
$31,598
1
$81,000
1
$25,340
Aggregated Statistics For Year 2007 (Based on 1 full and 5 partial tracts)
A) FHA, FSA/RHS & VA Home Purchase Loans
B) Conventional Home Purchase Loans
C) Refinancings
D) Home Improvement Loans
F) Non-occupant Loans on < 5 Family Dwellings (A B C & D)
G) Loans On Manufactured Home Dwelling (A B C & D)
Number
Average Value
Number
Average Value
Number
Average Value
Number
Average Value
Number
Average Value
Number
Average Value
LOANS ORIGINATED
37
$96,139
177
$91,180
126
$72,940
83
$25,292
26
$66,603
15
$57,161
APPLICATIONS APPROVED, NOT ACCEPTED
4
$106,280
29
$87,544
43
$74,831
20
$30,273
6
$93,047
9
$65,933
APPLICATIONS DENIED
10
$84,437
80
$95,031
332
$77,155
151
$40,085
33
$64,732
36
$60,419
APPLICATIONS WITHDRAWN
0
$0
41
$97,471
97
$82,329
24
$49,168
11
$80,185
2
$70,845
FILES CLOSED FOR INCOMPLETENESS
0
$0
3
$99,127
31
$80,498
8
$42,689
1
$176,990
1
$38,260
Aggregated Statistics For Year 2006 (Based on 1 full and 5 partial tracts)
A) FHA, FSA/RHS & VA Home Purchase Loans
B) Conventional Home Purchase Loans
C) Refinancings
D) Home Improvement Loans
F) Non-occupant Loans on < 5 Family Dwellings (A B C & D)
G) Loans On Manufactured Home Dwelling (A B C & D)
Number
Average Value
Number
Average Value
Number
Average Value
Number
Average Value
Number
Average Value
Number
Average Value
LOANS ORIGINATED
67
$91,428
350
$71,332
109
$72,098
66
$23,366
72
$62,374
12
$42,627
APPLICATIONS APPROVED, NOT ACCEPTED
1
$233,000
87
$60,292
39
$75,590
16
$21,931
21
$61,326
15
$51,943
APPLICATIONS DENIED
15
$81,632
135
$62,197
240
$68,742
138
$29,255
39
$58,233
30
$41,972
APPLICATIONS WITHDRAWN
5
$92,336
70
$71,151
124
$78,571
14
$35,850
20
$48,276
1
$34,430
FILES CLOSED FOR INCOMPLETENESS
0
$0
8
$94,918
20
$90,245
3
$20,060
3
$95,860
0
$0
Aggregated Statistics For Year 2005 (Based on 1 full and 5 partial tracts)
A) FHA, FSA/RHS & VA Home Purchase Loans
B) Conventional Home Purchase Loans
C) Refinancings
D) Home Improvement Loans
F) Non-occupant Loans on < 5 Family Dwellings (A B C & D)
G) Loans On Manufactured Home Dwelling (A B C & D)
Number
Average Value
Number
Average Value
Number
Average Value
Number
Average Value
Number
Average Value
Number
Average Value
LOANS ORIGINATED
122
$81,652
256
$61,695
105
$64,369
64
$34,305
41
$56,462
11
$44,503
APPLICATIONS APPROVED, NOT ACCEPTED
3
$63,287
46
$55,603
32
$60,929
7
$35,106
4
$71,340
16
$40,874
APPLICATIONS DENIED
32
$80,222
122
$61,666
223
$61,836
112
$28,230
20
$54,332
40
$41,797
APPLICATIONS WITHDRAWN
25
$90,428
72
$75,228
108
$75,476
33
$119,808
23
$91,016
2
$63,990
FILES CLOSED FOR INCOMPLETENESS
2
$60,405
11
$113,905
16
$71,542
6
$21,100
2
$75,780
0
$0
Aggregated Statistics For Year 2004 (Based on 1 full and 5 partial tracts)
A) FHA, FSA/RHS & VA Home Purchase Loans
B) Conventional Home Purchase Loans
C) Refinancings
D) Home Improvement Loans
F) Non-occupant Loans on < 5 Family Dwellings (A B C & D)
G) Loans On Manufactured Home Dwelling (A B C & D)
Number
Average Value
Number
Average Value
Number
Average Value
Number
Average Value
Number
Average Value
Number
Average Value
LOANS ORIGINATED
213
$73,572
133
$57,959
125
$60,630
67
$20,155
17
$62,515
10
$33,437
APPLICATIONS APPROVED, NOT ACCEPTED
2
$84,045
24
$54,391
34
$49,660
9
$26,593
5
$69,108
13
$38,077
APPLICATIONS DENIED
55
$75,695
77
$58,545
222
$58,269
95
$27,854
16
$73,126
38
$48,278
APPLICATIONS WITHDRAWN
54
$77,796
34
$49,750
116
$60,015
26
$34,031
4
$59,512
4
$41,665
FILES CLOSED FOR INCOMPLETENESS
2
$53,500
6
$76,308
9
$77,780
1
$30,220
0
$0
0
$0
Aggregated Statistics For Year 2003 (Based on 1 full and 5 partial tracts)
A) FHA, FSA/RHS & VA Home Purchase Loans
B) Conventional Home Purchase Loans
C) Refinancings
D) Home Improvement Loans
F) Non-occupant Loans on < 5 Family Dwellings (A B C & D)
Number
Average Value
Number
Average Value
Number
Average Value
Number
Average Value
Number
Average Value
LOANS ORIGINATED
192
$69,428
73
$59,642
138
$55,558
51
$9,264
15
$50,754
APPLICATIONS APPROVED, NOT ACCEPTED
1
$79,990
12
$59,198
22
$59,722
6
$15,215
2
$45,575
APPLICATIONS DENIED
21
$73,658
65
$46,475
184
$50,439
69
$13,169
11
$44,748
APPLICATIONS WITHDRAWN
34
$74,104
12
$65,728
103
$56,510
15
$12,971
9
$78,472
FILES CLOSED FOR INCOMPLETENESS
3
$60,237
1
$38,720
9
$58,286
0
$0
1
$24,120
Aggregated Statistics For Year 2002 (Based on 1 full and 5 partial tracts)
A) FHA, FSA/RHS & VA Home Purchase Loans
B) Conventional Home Purchase Loans
C) Refinancings
D) Home Improvement Loans
F) Non-occupant Loans on < 5 Family Dwellings (A B C & D)
Number
Average Value
Number
Average Value
Number
Average Value
Number
Average Value
Number
Average Value
LOANS ORIGINATED
29
$63,773
51
$49,119
87
$53,359
41
$9,081
10
$51,075
APPLICATIONS APPROVED, NOT ACCEPTED
3
$67,697
24
$53,489
23
$48,908
5
$16,380
1
$55,450
APPLICATIONS DENIED
6
$58,220
66
$46,904
124
$50,952
75
$15,487
8
$41,904
APPLICATIONS WITHDRAWN
4
$82,222
6
$69,160
72
$51,721
23
$15,163
1
$97,000
FILES CLOSED FOR INCOMPLETENESS
2
$59,500
4
$44,298
9
$61,279
0
$0
1
$29,200
Aggregated Statistics For Year 2001 (Based on 1 full and 5 partial tracts)
A) FHA, FSA/RHS & VA Home Purchase Loans
B) Conventional Home Purchase Loans
C) Refinancings
D) Home Improvement Loans
F) Non-occupant Loans on < 5 Family Dwellings (A B C & D)
Number
Average Value
Number
Average Value
Number
Average Value
Number
Average Value
Number
Average Value
LOANS ORIGINATED
11
$73,215
75
$45,743
86
$50,357
77
$12,153
6
$36,413
APPLICATIONS APPROVED, NOT ACCEPTED
1
$85,990
47
$46,585
21
$53,936
2
$19,275
1
$40,780
APPLICATIONS DENIED
1
$105,680
115
$41,258
87
$47,957
57
$13,180
8
$36,842
APPLICATIONS WITHDRAWN
2
$69,475
7
$53,367
48
$47,925
25
$13,474
1
$69,930
FILES CLOSED FOR INCOMPLETENESS
0
$0
0
$0
9
$55,549
0
$0
1
$29,200
Aggregated Statistics For Year 2000 (Based on 1 full and 5 partial tracts)
A) FHA, FSA/RHS & VA Home Purchase Loans
B) Conventional Home Purchase Loans
C) Refinancings
D) Home Improvement Loans
F) Non-occupant Loans on < 5 Family Dwellings (A B C & D)
Number
Average Value
Number
Average Value
Number
Average Value
Number
Average Value
Number
Average Value
LOANS ORIGINATED
17
$59,985
102
$41,360
58
$46,204
25
$12,390
9
$39,399
APPLICATIONS APPROVED, NOT ACCEPTED
9
$50,679
33
$46,120
13
$49,954
3
$21,477
1
$36,620
APPLICATIONS DENIED
12
$54,783
217
$37,728
49
$45,164
24
$8,345
4
$27,428
APPLICATIONS WITHDRAWN
4
$51,732
20
$50,462
23
$55,991
6
$10,213
2
$40,380
FILES CLOSED FOR INCOMPLETENESS
1
$62,810
2
$47,220
27
$53,057
1
$10,000
0
$0
Aggregated Statistics For Year 1999 (Based on 1 full and 5 partial tracts)
A) FHA, FSA/RHS & VA Home Purchase Loans
B) Conventional Home Purchase Loans
C) Refinancings
D) Home Improvement Loans
F) Non-occupant Loans on < 5 Family Dwellings (A B C & D)
2003 - 2018 National Fire Incident Reporting System (NFIRS) incidents
Based on the data from the years 2003 - 2018 the average number of fires per year is 36. The highest number of fire incidents - 120 took place in 2003, and the least - 2 in 2006. The data has a dropping trend.
When looking into fire subcategories, the most reports belonged to: Outside Fires (41.5%), and Structure Fires (33.4%).
Fire incident types reported to NFIRS in Socorro, TX


 Recent articles from our blog. Our writers, many of them Ph.D. graduates or candidates, create easy-to-read articles on a wide variety of topics.

 (13.5 miles


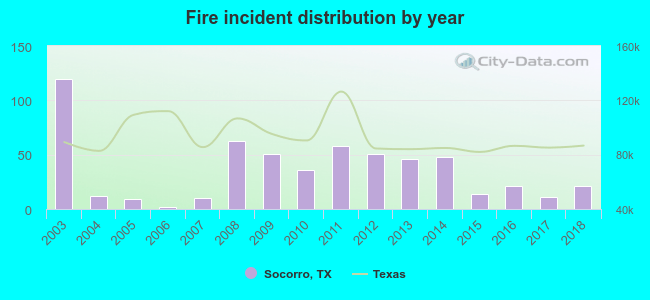 Based on the data from the years 2003 - 2018 the average number of fires per year is 36. The highest number of fire incidents - 120 took place in 2003, and the least - 2 in 2006. The data has a dropping trend.
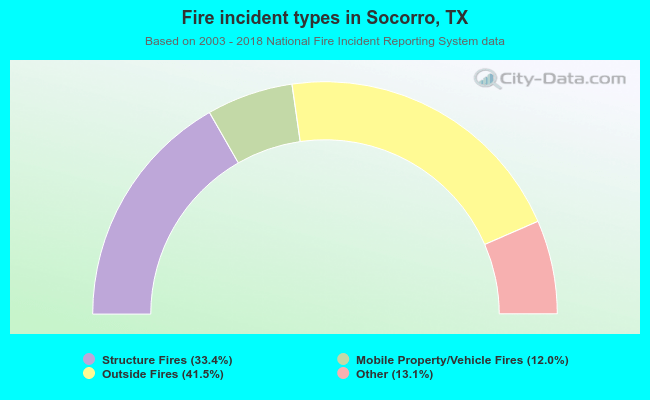 When looking into fire subcategories, the most reports belonged to: Outside Fires (41.5%), and Structure Fires (33.4%).