Cottonwood Creek neighborhood in Richardson, Texas (TX), 75080 detailed profile
Settings
X

Business Search - 14 Million verified businesses
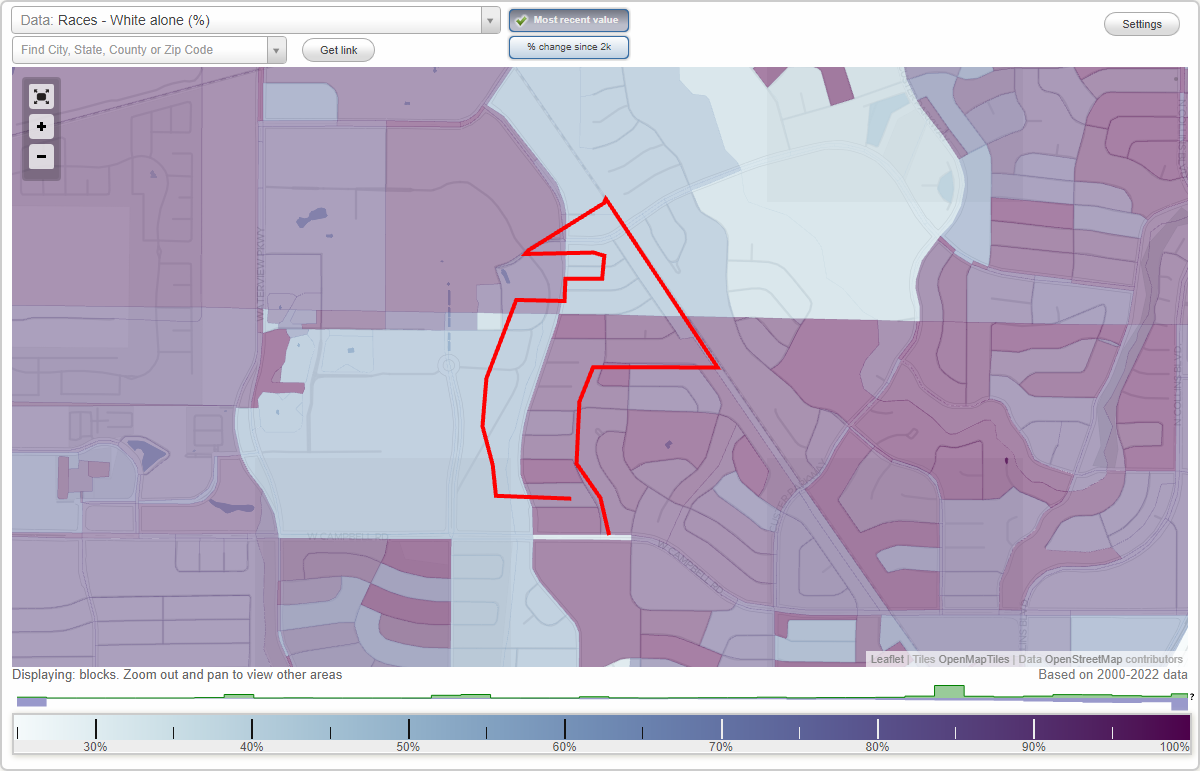
Area: 0.148 square miles
Population: 611
Population density:
| Cottonwood Creek: | 4,132 people per square mile |
| Richardson: | 4,160 people per square mile |

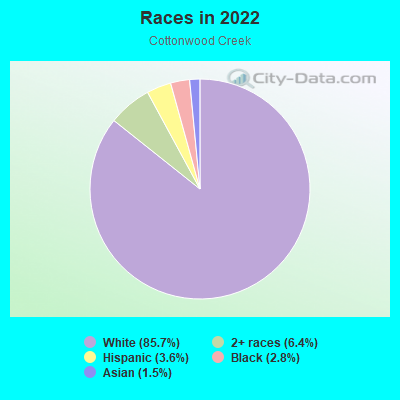
- 52185.7%White
- 396.4%Two or more races
- 223.6%Hispanic or Latino
- 172.8%Black
- 91.5%Asian
Median household income in 2022:
| Cottonwood Creek: | $164,539 |
| Richardson: | $86,175 |
Distribution of median household income
![Distribution of median household income]()
- 4Less than $10,000
- 2$10,000 to $19,999
- 4$20,000 to $29,999
- 7$30,000 to $39,999
- 9$40,000 to $49,999
- 7$50,000 to $59,999
- 16$60,000 to $74,999
- 17$75,000 to $99,999
- 7$100,000 to $124,999
- 21$125,000 to $149,999
- 18$150,000 to $199,999
- 96$200,000 or more

Distribution of owner-occupied house/condo value
![Distribution of owner-occupied house/condo value]()
- 1$50,000 to $99,999
- 2$100,000 to $149,999
- 16$200,000 to $249,999
- 8$250,000 to $299,999
- 20$300,000 to $399,999
- 35$400,000 to $499,999
- 58$500,000 to $749,999
- 45$750,000 to $999,999
- 13$1,000,000 or more

Distribution of rent paid by renters
![Distribution of rent paid by renters]()
- 2$900 to $999
- 1$1,000 to $1,249
- 1$1,500 to $1,999
- 5$2,000 or more

Median rent in 2022:
| Cottonwood Creek: | $2,524 |
| Richardson: | $1,560 |
| Males: | 304 |
| Females: | 306 |
Males:
| This neighborhood: | 37.4 years |
| Whole city: | 34.6 years |
| This neighborhood: | 40.9 years |
| Whole city: | 36.0 years |
Average household size:
| Cottonwood Creek: | 32.0 people |
| Richardson: | 2.3 people |
Percentage of family households:
| Cottonwood Creek: | 66.1% |
| Richardson: | 41.4% |
| Here: | 73.8% |
| Richardson: | 44.1% |
Percentage of married-couple families with children (among all households):
| Cottonwood Creek: | 30.5% |
| Richardson: | 30.4% |
Percentage of single-mother households (among all households):
| Cottonwood Creek: | 2.3% |
| Richardson: | 8.7% |
Percentage of never married males 15 years old and over:
Percentage of never married females 15 years old and over:
| Cottonwood Creek: | 12.8% |
| Richardson: | 21.2% |
Percentage of never married females 15 years old and over:
| Cottonwood Creek: | 6.6% |
| city: | 18.3% |
Percentage of people that speak English not well or not at all:
| Cottonwood Creek: | 0.0% |
| Richardson: | 3.6% |
Percentage of people born in this state:
Percentage of people born in another U.S. state:
Percentage of native residents but born outside the U.S.:
Percentage of foreign born residents:
| Here: | 53.6% |
| Richardson: | 45.6% |
Percentage of people born in another U.S. state:
| Cottonwood Creek: | 39.7% |
| Richardson: | 30.8% |
Percentage of native residents but born outside the U.S.:
| Here: | 1.4% |
| city: | 1.5% |
Percentage of foreign born residents:
| Here: | 5.3% |
| Richardson: | 22.1% |
Owner-occupied
Renter-occupied

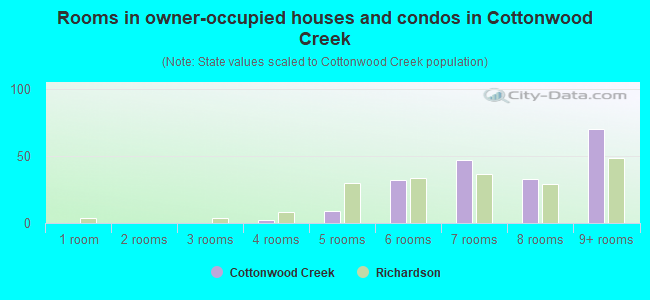
- Rooms in owner-occupied houses and condos in Cottonwood Creek
- 01 room
- 02 rooms
- 03 rooms
- 24 rooms
- 95 rooms
- 326 rooms
- 477 rooms
- 338 rooms
- 709+ rooms
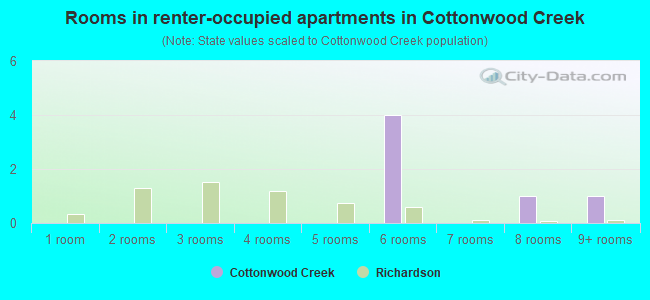
- Rooms in renter-occupied apartments in Cottonwood Creek
- 01 room
- 02 rooms
- 03 rooms
- 04 rooms
- 05 rooms
- 46 rooms
- 07 rooms
- 18 rooms
- 19+ rooms
Owner-occupied
Renter-occupied
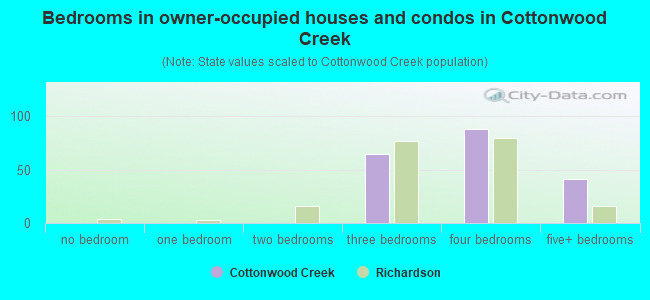
- Bedrooms in owner-occupied houses and condos in Cottonwood Creek
- 0no bedroom
- 01 bedroom
- 02 bedrooms
- 653 bedrooms
- 884 bedrooms
- 415+ bedrooms
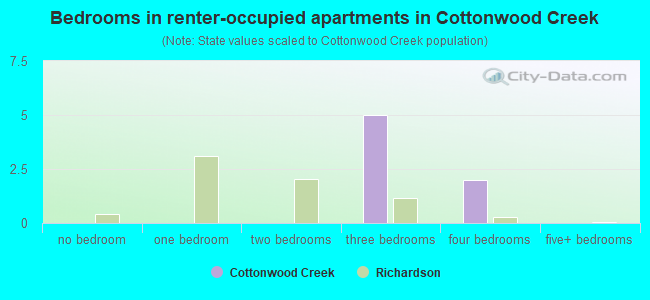
- Bedrooms in renter-occupied apartments in Cottonwood Creek
- 0no bedroom
- 01 bedroom
- 02 bedrooms
- 53 bedrooms
- 24 bedrooms
- 05+ bedrooms
Average number of cars or other vehicles available in houses/condos:
Average number of cars or other vehicles available in apartments:
| This neighborhood: | 2.1 |
| Richardson: | 2.0 |
Average number of cars or other vehicles available in apartments:
| Here: | 1.8 |
| city: | 1.3 |
Percentage of units with a mortgage:
| Cottonwood Creek: | 65.5% |
| Richardson: | 57.8% |
Average estimated value of detached houses in 2022 (100.0% of all units):
| Cottonwood Creek: | $590,341 |
| Richardson: | $422,742 |
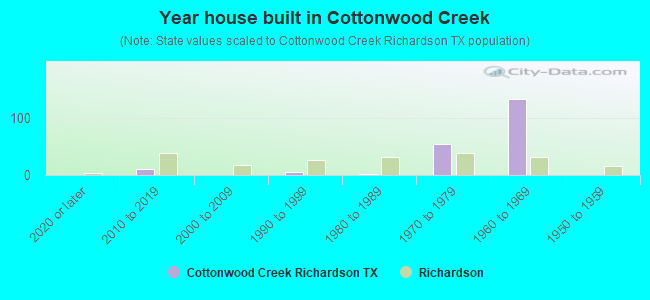
- Year house built in Cottonwood Creek
- 02020 or later
- 112010 to 2019
- 02000 to 2009
- 61990 to 1999
- 21980 to 1989
- 541970 to 1979
- 1331960 to 1969
- 01950 to 1959
- 01940 to 1949
- 01939 or earlier
City-data.com crime index for city in 2020 (higher means more crime):
| City: | 145.3 |
| U.S. average: | 219.5 |
Travel time to work (commute)
![Travel time to work (commute)]()
- 13Less than 5 minutes
- 265 to 9 minutes
- 1810 to 14 minutes
- 1615 to 19 minutes
- 3020 to 24 minutes
- 1825 to 29 minutes
- 4430 to 34 minutes
- 835 to 39 minutes
- 440 to 44 minutes
- 1045 to 59 minutes
- 560 to 89 minutes
- 490 or more minutes

Means of transportation to work
![Means of transportation to work]()
- 70.0%170Drove a car alone
- 6.2%15Carpooled
- 0.8%2Bicycle
- 0.8%2Walked
- 4.1%10Other means
- 16.9%41Worked at home

Time leaving home to go to work
![Time leaving home to go to work]()
- 412:00 a.m. to 4:59 a.m.
- 15:00 a.m. to 5:29 a.m.
- 95:30 a.m. to 5:59 a.m.
- 26:00 a.m. to 6:29 a.m.
- 86:30 a.m. to 6:59 a.m.
- 177:00 a.m. to 7:29 a.m.
- 547:30 a.m. to 7:59 a.m.
- 488:00 a.m. to 8:29 a.m.
- 138:30 a.m. to 8:59 a.m.
- 149:00 a.m. to 9:59 a.m.
- 1410:00 a.m. to 10:59 a.m.
- 211:00 a.m. to 11:59 a.m.
- 312:00 p.m. to 3:59 p.m.
- 54:00 p.m. to 11:59 p.m.

Occupations of males:
- Percentage of males in management occupations (except farmers):
Here: 25.7% city: 16.1%
- Percentage of males in business and financial operations occupations:
Here: 18.0% city: 9.6%
- Percentage of males in computer and mathematical occupations:
Here: 5.3% city: 10.4%
- Percentage of males in architecture and engineering occupations:
Here: 11.3% city: 5.6%
- Percentage of males in life, physical, and social science occupations:
Here: 1.5% city: 0.7%
- Percentage of males in community and social services occupations:
Here: 3.8% city: 1.3%
- Percentage of males in legal occupations:
Here: 2.2% city: 1.6%
- Percentage of males in education, training, and library occupations:
Here: 2.8% city: 5.6%
- Percentage of males in arts, design, entertainment, sports, and media occupations:
Here: 4.4% city: 2.9%
- Percentage of males in healthcare practitioners and technical occupations:
Here: 3.0% city: 3.0%
- Percentage of males in service occupations:
Here: 4.6% city: 9.7%
- Percentage of males in sales and office occupations:
Here: 11.0% city: 15.4%
- Percentage of males in construction, extraction, and maintenance occupations:
Here: 1.0% city: 4.5%
- Percentage of males in transportation occupations:
Here: 3.6% city: 3.6%
Occupations of females:
- Percentage of females in management occupations (except farmers):
Here: 25.7% city: 10.7%
- Percentage of females in business and financial operations occupations:
Here: 5.0% city: 12.7%
- Percentage of females in computer and mathematical occupations:
Here: 3.5% city: 3.9%
- Percentage of females in architecture and engineering occupations:
Here: 2.4% city: 1.6%
- Percentage of females in community and social services occupations:
Here: 4.0% city: 2.2%
- Percentage of females in legal occupations:
Here: 5.6% city: 1.4%
- Percentage of females in education, training, and library occupations:
Here: 14.3% city: 11.4%
- Percentage of females in arts, design, entertainment, sports, and media occupations:
Here: 3.5% city: 2.1%
- Percentage of females in healthcare practitioners and technical occupations:
Here: 22.3% city: 11.0%
- Percentage of females in service occupations:
Here: 5.0% city: 13.6%
- Percentage of females in sales and office occupations:
Here: 7.3% city: 24.3%
- Percentage of females in production occupations:
Here: 1.5% city: 1.9%
Percentage of people 16-64 in Armed Forces:
| Cottonwood Creek: | 0.3% |
| Richardson: | 0.1% |
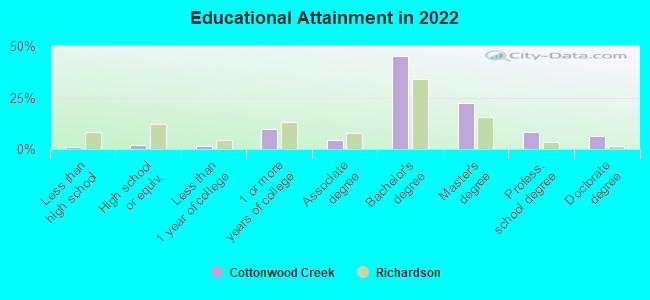
Education in this neighborhood (subdivision or community):
- Percentage of people 3 years and older in K-12 schools:
Cottonwood Creek: 19.9% Richardson: 15.3%
- Percentage of people 3 years and older in undergraduate colleges:
Cottonwood Creek: 4.9% Richardson: 9.6%
- Percentage of people 3 years and older in grad. or professional schools:
Cottonwood Creek: 0.7% Richardson: 2.4%
- Percentage of students K-12 enrolled in private schools:
Cottonwood Creek: 13.2% Richardson: 18.8%
Percentage of population below poverty level:
| Cottonwood Creek: | 2.6% |
| Richardson: | 12.1% |
Median year owner moved in (as recorded in 2022):
Median year renter moved in (as recorded in 2022):
| Cottonwood Creek: | 2007 |
| Richardson: | 2010 |
Median year renter moved in (as recorded in 2022):
| Cottonwood Creek: | 2019 |
| Richardson: | 2021 |
Percentage of married-couple families with both working:
| Cottonwood Creek: | 64.4% |
| Richardson: | 68.7% |
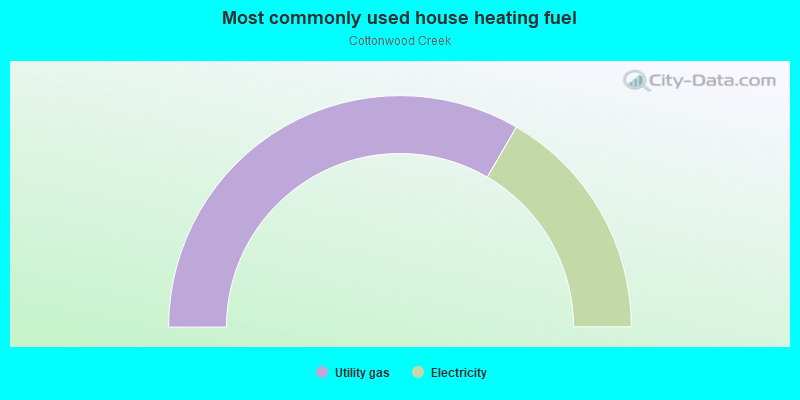
- 66.8%Utility gas
- 33.2%Electricity
Roads and streets:
Valley Forge
Length: 0.25 miles
Direction: SE-NW
Address range: 2400 to 2518
Direction: SE-NW
Address range: 2400 to 2518
W Lookout Dr
Length: 0.10 miles
Directions: E-W, SW-NE
Directions: E-W, SW-NE
Railroad features:
at and Sf Rlwy
Length: 0.08 miles
Direction: SE-NW
Direction: SE-NW
Roads and streets:
Wilderness Trl
Length: 0.23 miles
Directions: E-W, SW-NE
Address range: 1100 to 1123
Directions: E-W, SW-NE
Address range: 1100 to 1123
Bunker Hill
Length: 0.15 miles
Directions: N-S, SE-NW
Address range: 1 to 17
Directions: N-S, SE-NW
Address range: 1 to 17
Flat Creek Dr
Length: 0.08 miles
Direction: E-W
Address range: 2300 to 2399
Direction: E-W
Address range: 2300 to 2399
Valley Forge
Length: 0.07 miles
Direction: SE-NW
Address range: 2400 to 2499
Direction: SE-NW
Address range: 2400 to 2499
Shady Creek Dr
Length: 0.04 miles
Directions: N-S, SE-NW
Address range: 2318 to 2399
Directions: N-S, SE-NW
Address range: 2318 to 2399
Wilderness Cir
Length: 0.02 miles
Direction: N-S
Address range: 1 to 99
Direction: N-S
Address range: 1 to 99