Richardson, Texas Submit your own pictures of this city and show them to the world
OSM Map
General Map
Google Map
MSN Map
OSM Map
General Map
Google Map
MSN Map
OSM Map
General Map
Google Map
MSN Map
OSM Map
General Map
Google Map
MSN Map
Please wait while loading the map...
Population in 2022: 118,802 (100% urban, 0% rural). Population change since 2000: +29.4%Males: 61,236 Females: 57,566
March 2022 cost of living index in Richardson: 97.0 (near average, U.S. average is 100) Percentage of residents living in poverty in 2022: 12.1%for White Non-Hispanic residents , 11.1% for Black residents , 19.6% for Hispanic or Latino residents , 37.4% for American Indian residents , 72.9% for Native Hawaiian and other Pacific Islander residents , 20.9% for other race residents , 16.8% for two or more races residents )
Profiles of local businesses
Business Search - 14 Million verified businesses
Data:
Median household income ($)
Median household income (% change since 2000)
Household income diversity
Ratio of average income to average house value (%)
Ratio of average income to average rent
Median household income ($) - White
Median household income ($) - Black or African American
Median household income ($) - Asian
Median household income ($) - Hispanic or Latino
Median household income ($) - American Indian and Alaska Native
Median household income ($) - Multirace
Median household income ($) - Other Race
Median household income for houses/condos with a mortgage ($)
Median household income for apartments without a mortgage ($)
Races - White alone (%)
Races - White alone (% change since 2000)
Races - Black alone (%)
Races - Black alone (% change since 2000)
Races - American Indian alone (%)
Races - American Indian alone (% change since 2000)
Races - Asian alone (%)
Races - Asian alone (% change since 2000)
Races - Hispanic (%)
Races - Hispanic (% change since 2000)
Races - Native Hawaiian and Other Pacific Islander alone (%)
Races - Native Hawaiian and Other Pacific Islander alone (% change since 2000)
Races - Two or more races (%)
Races - Two or more races (% change since 2000)
Races - Other race alone (%)
Races - Other race alone (% change since 2000)
Racial diversity
Unemployment (%)
Unemployment (% change since 2000)
Unemployment (%) - White
Unemployment (%) - Black or African American
Unemployment (%) - Asian
Unemployment (%) - Hispanic or Latino
Unemployment (%) - American Indian and Alaska Native
Unemployment (%) - Multirace
Unemployment (%) - Other Race
Population density (people per square mile)
Population - Males (%)
Population - Females (%)
Population - Males (%) - White
Population - Males (%) - Black or African American
Population - Males (%) - Asian
Population - Males (%) - Hispanic or Latino
Population - Males (%) - American Indian and Alaska Native
Population - Males (%) - Multirace
Population - Males (%) - Other Race
Population - Females (%) - White
Population - Females (%) - Black or African American
Population - Females (%) - Asian
Population - Females (%) - Hispanic or Latino
Population - Females (%) - American Indian and Alaska Native
Population - Females (%) - Multirace
Population - Females (%) - Other Race
Coronavirus confirmed cases (Apr 27, 2024)
Deaths caused by coronavirus (Apr 27, 2024)
Coronavirus confirmed cases (per 100k population) (Apr 27, 2024)
Deaths caused by coronavirus (per 100k population) (Apr 27, 2024)
Daily increase in number of cases (Apr 27, 2024)
Weekly increase in number of cases (Apr 27, 2024)
Cases doubled (in days) (Apr 27, 2024)
Hospitalized patients (Apr 18, 2022)
Negative test results (Apr 18, 2022)
Total test results (Apr 18, 2022)
COVID Vaccine doses distributed (per 100k population) (Sep 19, 2023)
COVID Vaccine doses administered (per 100k population) (Sep 19, 2023)
COVID Vaccine doses distributed (Sep 19, 2023)
COVID Vaccine doses administered (Sep 19, 2023)
Likely homosexual households (%)
Likely homosexual households (% change since 2000)
Likely homosexual households - Lesbian couples (%)
Likely homosexual households - Lesbian couples (% change since 2000)
Likely homosexual households - Gay men (%)
Likely homosexual households - Gay men (% change since 2000)
Cost of living index
Median gross rent ($)
Median contract rent ($)
Median monthly housing costs ($)
Median house or condo value ($)
Median house or condo value ($ change since 2000)
Mean house or condo value by units in structure - 1, detached ($)
Mean house or condo value by units in structure - 1, attached ($)
Mean house or condo value by units in structure - 2 ($)
Mean house or condo value by units in structure by units in structure - 3 or 4 ($)
Mean house or condo value by units in structure - 5 or more ($)
Mean house or condo value by units in structure - Boat, RV, van, etc. ($)
Mean house or condo value by units in structure - Mobile home ($)
Median house or condo value ($) - White
Median house or condo value ($) - Black or African American
Median house or condo value ($) - Asian
Median house or condo value ($) - Hispanic or Latino
Median house or condo value ($) - American Indian and Alaska Native
Median house or condo value ($) - Multirace
Median house or condo value ($) - Other Race
Median resident age
Resident age diversity
Median resident age - Males
Median resident age - Females
Median resident age - White
Median resident age - Black or African American
Median resident age - Asian
Median resident age - Hispanic or Latino
Median resident age - American Indian and Alaska Native
Median resident age - Multirace
Median resident age - Other Race
Median resident age - Males - White
Median resident age - Males - Black or African American
Median resident age - Males - Asian
Median resident age - Males - Hispanic or Latino
Median resident age - Males - American Indian and Alaska Native
Median resident age - Males - Multirace
Median resident age - Males - Other Race
Median resident age - Females - White
Median resident age - Females - Black or African American
Median resident age - Females - Asian
Median resident age - Females - Hispanic or Latino
Median resident age - Females - American Indian and Alaska Native
Median resident age - Females - Multirace
Median resident age - Females - Other Race
Commute - mean travel time to work (minutes)
Travel time to work - Less than 5 minutes (%)
Travel time to work - Less than 5 minutes (% change since 2000)
Travel time to work - 5 to 9 minutes (%)
Travel time to work - 5 to 9 minutes (% change since 2000)
Travel time to work - 10 to 19 minutes (%)
Travel time to work - 10 to 19 minutes (% change since 2000)
Travel time to work - 20 to 29 minutes (%)
Travel time to work - 20 to 29 minutes (% change since 2000)
Travel time to work - 30 to 39 minutes (%)
Travel time to work - 30 to 39 minutes (% change since 2000)
Travel time to work - 40 to 59 minutes (%)
Travel time to work - 40 to 59 minutes (% change since 2000)
Travel time to work - 60 to 89 minutes (%)
Travel time to work - 60 to 89 minutes (% change since 2000)
Travel time to work - 90 or more minutes (%)
Travel time to work - 90 or more minutes (% change since 2000)
Marital status - Never married (%)
Marital status - Now married (%)
Marital status - Separated (%)
Marital status - Widowed (%)
Marital status - Divorced (%)
Median family income ($)
Median family income (% change since 2000)
Median non-family income ($)
Median non-family income (% change since 2000)
Median per capita income ($)
Median per capita income (% change since 2000)
Median family income ($) - White
Median family income ($) - Black or African American
Median family income ($) - Asian
Median family income ($) - Hispanic or Latino
Median family income ($) - American Indian and Alaska Native
Median family income ($) - Multirace
Median family income ($) - Other Race
Median year house/condo built
Median year apartment built
Year house built - Built 2005 or later (%)
Year house built - Built 2000 to 2004 (%)
Year house built - Built 1990 to 1999 (%)
Year house built - Built 1980 to 1989 (%)
Year house built - Built 1970 to 1979 (%)
Year house built - Built 1960 to 1969 (%)
Year house built - Built 1950 to 1959 (%)
Year house built - Built 1940 to 1949 (%)
Year house built - Built 1939 or earlier (%)
Average household size
Household density (households per square mile)
Average household size - White
Average household size - Black or African American
Average household size - Asian
Average household size - Hispanic or Latino
Average household size - American Indian and Alaska Native
Average household size - Multirace
Average household size - Other Race
Occupied housing units (%)
Vacant housing units (%)
Owner occupied housing units (%)
Renter occupied housing units (%)
Vacancy status - For rent (%)
Vacancy status - For sale only (%)
Vacancy status - Rented or sold, not occupied (%)
Vacancy status - For seasonal, recreational, or occasional use (%)
Vacancy status - For migrant workers (%)
Vacancy status - Other vacant (%)
Residents with income below the poverty level (%)
Residents with income below 50% of the poverty level (%)
Children below poverty level (%)
Poor families by family type - Married-couple family (%)
Poor families by family type - Male, no wife present (%)
Poor families by family type - Female, no husband present (%)
Poverty status for native-born residents (%)
Poverty status for foreign-born residents (%)
Poverty among high school graduates not in families (%)
Poverty among people who did not graduate high school not in families (%)
Residents with income below the poverty level (%) - White
Residents with income below the poverty level (%) - Black or African American
Residents with income below the poverty level (%) - Asian
Residents with income below the poverty level (%) - Hispanic or Latino
Residents with income below the poverty level (%) - American Indian and Alaska Native
Residents with income below the poverty level (%) - Multirace
Residents with income below the poverty level (%) - Other Race
Air pollution - Air Quality Index (AQI)
Air pollution - CO
Air pollution - NO2
Air pollution - SO2
Air pollution - Ozone
Air pollution - PM10
Air pollution - PM25
Air pollution - Pb
Crime - Murders per 100,000 population
Crime - Rapes per 100,000 population
Crime - Robberies per 100,000 population
Crime - Assaults per 100,000 population
Crime - Burglaries per 100,000 population
Crime - Thefts per 100,000 population
Crime - Auto thefts per 100,000 population
Crime - Arson per 100,000 population
Crime - City-data.com crime index
Crime - Violent crime index
Crime - Property crime index
Crime - Murders per 100,000 population (5 year average)
Crime - Rapes per 100,000 population (5 year average)
Crime - Robberies per 100,000 population (5 year average)
Crime - Assaults per 100,000 population (5 year average)
Crime - Burglaries per 100,000 population (5 year average)
Crime - Thefts per 100,000 population (5 year average)
Crime - Auto thefts per 100,000 population (5 year average)
Crime - Arson per 100,000 population (5 year average)
Crime - City-data.com crime index (5 year average)
Crime - Violent crime index (5 year average)
Crime - Property crime index (5 year average)
1996 Presidential Elections Results (%) - Democratic Party (Clinton)
1996 Presidential Elections Results (%) - Republican Party (Dole)
1996 Presidential Elections Results (%) - Other
2000 Presidential Elections Results (%) - Democratic Party (Gore)
2000 Presidential Elections Results (%) - Republican Party (Bush)
2000 Presidential Elections Results (%) - Other
2004 Presidential Elections Results (%) - Democratic Party (Kerry)
2004 Presidential Elections Results (%) - Republican Party (Bush)
2004 Presidential Elections Results (%) - Other
2008 Presidential Elections Results (%) - Democratic Party (Obama)
2008 Presidential Elections Results (%) - Republican Party (McCain)
2008 Presidential Elections Results (%) - Other
2012 Presidential Elections Results (%) - Democratic Party (Obama)
2012 Presidential Elections Results (%) - Republican Party (Romney)
2012 Presidential Elections Results (%) - Other
2016 Presidential Elections Results (%) - Democratic Party (Clinton)
2016 Presidential Elections Results (%) - Republican Party (Trump)
2016 Presidential Elections Results (%) - Other
2020 Presidential Elections Results (%) - Democratic Party (Biden)
2020 Presidential Elections Results (%) - Republican Party (Trump)
2020 Presidential Elections Results (%) - Other
Ancestries Reported - Arab (%)
Ancestries Reported - Czech (%)
Ancestries Reported - Danish (%)
Ancestries Reported - Dutch (%)
Ancestries Reported - English (%)
Ancestries Reported - French (%)
Ancestries Reported - French Canadian (%)
Ancestries Reported - German (%)
Ancestries Reported - Greek (%)
Ancestries Reported - Hungarian (%)
Ancestries Reported - Irish (%)
Ancestries Reported - Italian (%)
Ancestries Reported - Lithuanian (%)
Ancestries Reported - Norwegian (%)
Ancestries Reported - Polish (%)
Ancestries Reported - Portuguese (%)
Ancestries Reported - Russian (%)
Ancestries Reported - Scotch-Irish (%)
Ancestries Reported - Scottish (%)
Ancestries Reported - Slovak (%)
Ancestries Reported - Subsaharan African (%)
Ancestries Reported - Swedish (%)
Ancestries Reported - Swiss (%)
Ancestries Reported - Ukrainian (%)
Ancestries Reported - United States (%)
Ancestries Reported - Welsh (%)
Ancestries Reported - West Indian (%)
Ancestries Reported - Other (%)
Educational Attainment - No schooling completed (%)
Educational Attainment - Less than high school (%)
Educational Attainment - High school or equivalent (%)
Educational Attainment - Less than 1 year of college (%)
Educational Attainment - 1 or more years of college (%)
Educational Attainment - Associate degree (%)
Educational Attainment - Bachelor's degree (%)
Educational Attainment - Master's degree (%)
Educational Attainment - Professional school degree (%)
Educational Attainment - Doctorate degree (%)
School Enrollment - Nursery, preschool (%)
School Enrollment - Kindergarten (%)
School Enrollment - Grade 1 to 4 (%)
School Enrollment - Grade 5 to 8 (%)
School Enrollment - Grade 9 to 12 (%)
School Enrollment - College undergrad (%)
School Enrollment - Graduate or professional (%)
School Enrollment - Not enrolled in school (%)
School enrollment - Public schools (%)
School enrollment - Private schools (%)
School enrollment - Not enrolled (%)
Median number of rooms in houses and condos
Median number of rooms in apartments
Housing units lacking complete plumbing facilities (%)
Housing units lacking complete kitchen facilities (%)
Density of houses
Urban houses (%)
Rural houses (%)
Households with people 60 years and over (%)
Households with people 65 years and over (%)
Households with people 75 years and over (%)
Households with one or more nonrelatives (%)
Households with no nonrelatives (%)
Population in households (%)
Family households (%)
Nonfamily households (%)
Population in families (%)
Family households with own children (%)
Median number of bedrooms in owner occupied houses
Mean number of bedrooms in owner occupied houses
Median number of bedrooms in renter occupied houses
Mean number of bedrooms in renter occupied houses
Median number of vehichles in owner occupied houses
Mean number of vehichles in owner occupied houses
Median number of vehichles in renter occupied houses
Mean number of vehichles in renter occupied houses
Mortgage status - with mortgage (%)
Mortgage status - with second mortgage (%)
Mortgage status - with home equity loan (%)
Mortgage status - with both second mortgage and home equity loan (%)
Mortgage status - without a mortgage (%)
Average family size
Average family size - White
Average family size - Black or African American
Average family size - Asian
Average family size - Hispanic or Latino
Average family size - American Indian and Alaska Native
Average family size - Multirace
Average family size - Other Race
Geographical mobility - Same house 1 year ago (%)
Geographical mobility - Moved within same county (%)
Geographical mobility - Moved from different county within same state (%)
Geographical mobility - Moved from different state (%)
Geographical mobility - Moved from abroad (%)
Place of birth - Born in state of residence (%)
Place of birth - Born in other state (%)
Place of birth - Native, outside of US (%)
Place of birth - Foreign born (%)
Housing units in structures - 1, detached (%)
Housing units in structures - 1, attached (%)
Housing units in structures - 2 (%)
Housing units in structures - 3 or 4 (%)
Housing units in structures - 5 to 9 (%)
Housing units in structures - 10 to 19 (%)
Housing units in structures - 20 to 49 (%)
Housing units in structures - 50 or more (%)
Housing units in structures - Mobile home (%)
Housing units in structures - Boat, RV, van, etc. (%)
House/condo owner moved in on average (years ago)
Renter moved in on average (years ago)
Year householder moved into unit - Moved in 1999 to March 2000 (%)
Year householder moved into unit - Moved in 1995 to 1998 (%)
Year householder moved into unit - Moved in 1990 to 1994 (%)
Year householder moved into unit - Moved in 1980 to 1989 (%)
Year householder moved into unit - Moved in 1970 to 1979 (%)
Year householder moved into unit - Moved in 1969 or earlier (%)
Means of transportation to work - Drove car alone (%)
Means of transportation to work - Carpooled (%)
Means of transportation to work - Public transportation (%)
Means of transportation to work - Bus or trolley bus (%)
Means of transportation to work - Streetcar or trolley car (%)
Means of transportation to work - Subway or elevated (%)
Means of transportation to work - Railroad (%)
Means of transportation to work - Ferryboat (%)
Means of transportation to work - Taxicab (%)
Means of transportation to work - Motorcycle (%)
Means of transportation to work - Bicycle (%)
Means of transportation to work - Walked (%)
Means of transportation to work - Other means (%)
Working at home (%)
Industry diversity
Most Common Industries - Agriculture, forestry, fishing and hunting, and mining (%)
Most Common Industries - Agriculture, forestry, fishing and hunting (%)
Most Common Industries - Mining, quarrying, and oil and gas extraction (%)
Most Common Industries - Construction (%)
Most Common Industries - Manufacturing (%)
Most Common Industries - Wholesale trade (%)
Most Common Industries - Retail trade (%)
Most Common Industries - Transportation and warehousing, and utilities (%)
Most Common Industries - Transportation and warehousing (%)
Most Common Industries - Utilities (%)
Most Common Industries - Information (%)
Most Common Industries - Finance and insurance, and real estate and rental and leasing (%)
Most Common Industries - Finance and insurance (%)
Most Common Industries - Real estate and rental and leasing (%)
Most Common Industries - Professional, scientific, and management, and administrative and waste management services (%)
Most Common Industries - Professional, scientific, and technical services (%)
Most Common Industries - Management of companies and enterprises (%)
Most Common Industries - Administrative and support and waste management services (%)
Most Common Industries - Educational services, and health care and social assistance (%)
Most Common Industries - Educational services (%)
Most Common Industries - Health care and social assistance (%)
Most Common Industries - Arts, entertainment, and recreation, and accommodation and food services (%)
Most Common Industries - Arts, entertainment, and recreation (%)
Most Common Industries - Accommodation and food services (%)
Most Common Industries - Other services, except public administration (%)
Most Common Industries - Public administration (%)
Occupation diversity
Most Common Occupations - Management, business, science, and arts occupations (%)
Most Common Occupations - Management, business, and financial occupations (%)
Most Common Occupations - Management occupations (%)
Most Common Occupations - Business and financial operations occupations (%)
Most Common Occupations - Computer, engineering, and science occupations (%)
Most Common Occupations - Computer and mathematical occupations (%)
Most Common Occupations - Architecture and engineering occupations (%)
Most Common Occupations - Life, physical, and social science occupations (%)
Most Common Occupations - Education, legal, community service, arts, and media occupations (%)
Most Common Occupations - Community and social service occupations (%)
Most Common Occupations - Legal occupations (%)
Most Common Occupations - Education, training, and library occupations (%)
Most Common Occupations - Arts, design, entertainment, sports, and media occupations (%)
Most Common Occupations - Healthcare practitioners and technical occupations (%)
Most Common Occupations - Health diagnosing and treating practitioners and other technical occupations (%)
Most Common Occupations - Health technologists and technicians (%)
Most Common Occupations - Service occupations (%)
Most Common Occupations - Healthcare support occupations (%)
Most Common Occupations - Protective service occupations (%)
Most Common Occupations - Fire fighting and prevention, and other protective service workers including supervisors (%)
Most Common Occupations - Law enforcement workers including supervisors (%)
Most Common Occupations - Food preparation and serving related occupations (%)
Most Common Occupations - Building and grounds cleaning and maintenance occupations (%)
Most Common Occupations - Personal care and service occupations (%)
Most Common Occupations - Sales and office occupations (%)
Most Common Occupations - Sales and related occupations (%)
Most Common Occupations - Office and administrative support occupations (%)
Most Common Occupations - Natural resources, construction, and maintenance occupations (%)
Most Common Occupations - Farming, fishing, and forestry occupations (%)
Most Common Occupations - Construction and extraction occupations (%)
Most Common Occupations - Installation, maintenance, and repair occupations (%)
Most Common Occupations - Production, transportation, and material moving occupations (%)
Most Common Occupations - Production occupations (%)
Most Common Occupations - Transportation occupations (%)
Most Common Occupations - Material moving occupations (%)
People in Group quarters - Institutionalized population (%)
People in Group quarters - Correctional institutions (%)
People in Group quarters - Federal prisons and detention centers (%)
People in Group quarters - Halfway houses (%)
People in Group quarters - Local jails and other confinement facilities (including police lockups) (%)
People in Group quarters - Military disciplinary barracks (%)
People in Group quarters - State prisons (%)
People in Group quarters - Other types of correctional institutions (%)
People in Group quarters - Nursing homes (%)
People in Group quarters - Hospitals/wards, hospices, and schools for the handicapped (%)
People in Group quarters - Hospitals/wards and hospices for chronically ill (%)
People in Group quarters - Hospices or homes for chronically ill (%)
People in Group quarters - Military hospitals or wards for chronically ill (%)
People in Group quarters - Other hospitals or wards for chronically ill (%)
People in Group quarters - Hospitals or wards for drug/alcohol abuse (%)
People in Group quarters - Mental (Psychiatric) hospitals or wards (%)
People in Group quarters - Schools, hospitals, or wards for the mentally retarded (%)
People in Group quarters - Schools, hospitals, or wards for the physically handicapped (%)
People in Group quarters - Institutions for the deaf (%)
People in Group quarters - Institutions for the blind (%)
People in Group quarters - Orthopedic wards and institutions for the physically handicapped (%)
People in Group quarters - Wards in general hospitals for patients who have no usual home elsewhere (%)
People in Group quarters - Wards in military hospitals for patients who have no usual home elsewhere (%)
People in Group quarters - Juvenile institutions (%)
People in Group quarters - Long-term care (%)
People in Group quarters - Homes for abused, dependent, and neglected children (%)
People in Group quarters - Residential treatment centers for emotionally disturbed children (%)
People in Group quarters - Training schools for juvenile delinquents (%)
People in Group quarters - Short-term care, detention or diagnostic centers for delinquent children (%)
People in Group quarters - Type of juvenile institution unknown (%)
People in Group quarters - Noninstitutionalized population (%)
People in Group quarters - College dormitories (includes college quarters off campus) (%)
People in Group quarters - Military quarters (%)
People in Group quarters - On base (%)
People in Group quarters - Barracks, unaccompanied personnel housing (UPH), (Enlisted/Officer), ;and similar group living quarters for military personnel (%)
People in Group quarters - Transient quarters for temporary residents (%)
People in Group quarters - Military ships (%)
People in Group quarters - Group homes (%)
People in Group quarters - Homes or halfway houses for drug/alcohol abuse (%)
People in Group quarters - Homes for the mentally ill (%)
People in Group quarters - Homes for the mentally retarded (%)
People in Group quarters - Homes for the physically handicapped (%)
People in Group quarters - Other group homes (%)
People in Group quarters - Religious group quarters (%)
People in Group quarters - Dormitories (%)
People in Group quarters - Agriculture workers' dormitories on farms (%)
People in Group quarters - Job Corps and vocational training facilities (%)
People in Group quarters - Other workers' dormitories (%)
People in Group quarters - Crews of maritime vessels (%)
People in Group quarters - Other nonhousehold living situations (%)
People in Group quarters - Other noninstitutional group quarters (%)
Residents speaking English at home (%)
Residents speaking English at home - Born in the United States (%)
Residents speaking English at home - Native, born elsewhere (%)
Residents speaking English at home - Foreign born (%)
Residents speaking Spanish at home (%)
Residents speaking Spanish at home - Born in the United States (%)
Residents speaking Spanish at home - Native, born elsewhere (%)
Residents speaking Spanish at home - Foreign born (%)
Residents speaking other language at home (%)
Residents speaking other language at home - Born in the United States (%)
Residents speaking other language at home - Native, born elsewhere (%)
Residents speaking other language at home - Foreign born (%)
Class of Workers - Employee of private company (%)
Class of Workers - Self-employed in own incorporated business (%)
Class of Workers - Private not-for-profit wage and salary workers (%)
Class of Workers - Local government workers (%)
Class of Workers - State government workers (%)
Class of Workers - Federal government workers (%)
Class of Workers - Self-employed workers in own not incorporated business and Unpaid family workers (%)
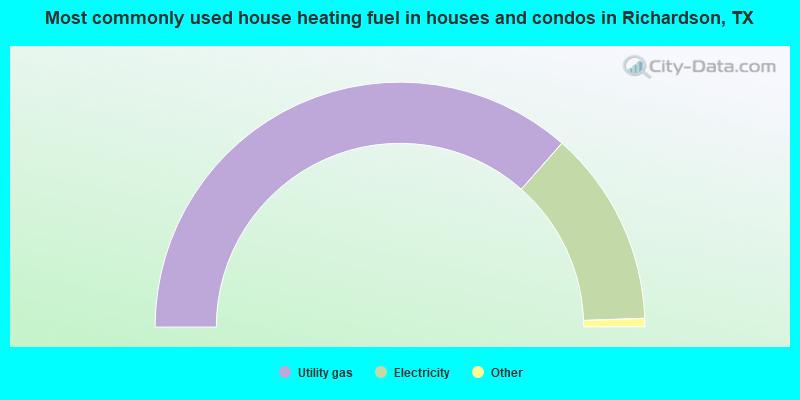
House heating fuel used in houses and condos - Utility gas (%)
House heating fuel used in houses and condos - Bottled, tank, or LP gas (%)
House heating fuel used in houses and condos - Electricity (%)
House heating fuel used in houses and condos - Fuel oil, kerosene, etc. (%)
House heating fuel used in houses and condos - Coal or coke (%)
House heating fuel used in houses and condos - Wood (%)
House heating fuel used in houses and condos - Solar energy (%)
House heating fuel used in houses and condos - Other fuel (%)
House heating fuel used in houses and condos - No fuel used (%)
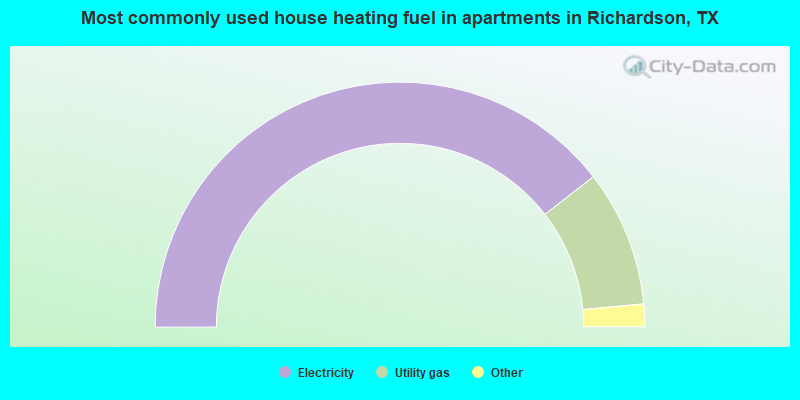
House heating fuel used in apartments - Utility gas (%)
House heating fuel used in apartments - Bottled, tank, or LP gas (%)
House heating fuel used in apartments - Electricity (%)
House heating fuel used in apartments - Fuel oil, kerosene, etc. (%)
House heating fuel used in apartments - Coal or coke (%)
House heating fuel used in apartments - Wood (%)
House heating fuel used in apartments - Solar energy (%)
House heating fuel used in apartments - Other fuel (%)
House heating fuel used in apartments - No fuel used (%)
Armed forces status - In Armed Forces (%)
Armed forces status - Civilian (%)
Armed forces status - Civilian - Veteran (%)
Armed forces status - Civilian - Nonveteran (%)
Fatal accidents locations in years 2005-2021
Fatal accidents locations in 2005
Fatal accidents locations in 2006
Fatal accidents locations in 2007
Fatal accidents locations in 2008
Fatal accidents locations in 2009
Fatal accidents locations in 2010
Fatal accidents locations in 2011
Fatal accidents locations in 2012
Fatal accidents locations in 2013
Fatal accidents locations in 2014
Fatal accidents locations in 2015
Fatal accidents locations in 2016
Fatal accidents locations in 2017
Fatal accidents locations in 2018
Fatal accidents locations in 2019
Fatal accidents locations in 2020
Fatal accidents locations in 2021
Alcohol use - People drinking some alcohol every month (%)
Alcohol use - People not drinking at all (%)
Alcohol use - Average days/month drinking alcohol
Alcohol use - Average drinks/week
Alcohol use - Average days/year people drink much
Audiometry - Average condition of hearing (%)
Audiometry - People that can hear a whisper from across a quiet room (%)
Audiometry - People that can hear normal voice from across a quiet room (%)
Audiometry - Ears ringing, roaring, buzzing (%)
Audiometry - Had a job exposure to loud noise (%)
Audiometry - Had off-work exposure to loud noise (%)
Blood Pressure & Cholesterol - Has high blood pressure (%)
Blood Pressure & Cholesterol - Checking blood pressure at home (%)
Blood Pressure & Cholesterol - Frequently checking blood cholesterol (%)
Blood Pressure & Cholesterol - Has high cholesterol level (%)
Consumer Behavior - Money monthly spent on food at supermarket/grocery store
Consumer Behavior - Money monthly spent on food at other stores
Consumer Behavior - Money monthly spent on eating out
Consumer Behavior - Money monthly spent on carryout/delivered foods
Consumer Behavior - Income spent on food at supermarket/grocery store (%)
Consumer Behavior - Income spent on food at other stores (%)
Consumer Behavior - Income spent on eating out (%)
Consumer Behavior - Income spent on carryout/delivered foods (%)
Current Health Status - General health condition (%)
Current Health Status - Blood donors (%)
Current Health Status - Has blood ever tested for HIV virus (%)
Current Health Status - Left-handed people (%)
Dermatology - People using sunscreen (%)
Diabetes - Diabetics (%)
Diabetes - Had a blood test for high blood sugar (%)
Diabetes - People taking insulin (%)
Diet Behavior & Nutrition - Diet health (%)
Diet Behavior & Nutrition - Milk product consumption (# of products/month)
Diet Behavior & Nutrition - Meals not home prepared (#/week)
Diet Behavior & Nutrition - Meals from fast food or pizza place (#/week)
Diet Behavior & Nutrition - Ready-to-eat foods (#/month)
Diet Behavior & Nutrition - Frozen meals/pizza (#/month)
Drug Use - People that ever used marijuana or hashish (%)
Drug Use - Ever used hard drugs (%)
Drug Use - Ever used any form of cocaine (%)
Drug Use - Ever used heroin (%)
Drug Use - Ever used methamphetamine (%)
Health Insurance - People covered by health insurance (%)
Kidney Conditions-Urology - Avg. # of times urinating at night
Medical Conditions - People with asthma (%)
Medical Conditions - People with anemia (%)
Medical Conditions - People with psoriasis (%)
Medical Conditions - People with overweight (%)
Medical Conditions - Elderly people having difficulties in thinking or remembering (%)
Medical Conditions - People who ever received blood transfusion (%)
Medical Conditions - People having trouble seeing even with glass/contacts (%)
Medical Conditions - People with arthritis (%)
Medical Conditions - People with gout (%)
Medical Conditions - People with congestive heart failure (%)
Medical Conditions - People with coronary heart disease (%)
Medical Conditions - People with angina pectoris (%)
Medical Conditions - People who ever had heart attack (%)
Medical Conditions - People who ever had stroke (%)
Medical Conditions - People with emphysema (%)
Medical Conditions - People with thyroid problem (%)
Medical Conditions - People with chronic bronchitis (%)
Medical Conditions - People with any liver condition (%)
Medical Conditions - People who ever had cancer or malignancy (%)
Mental Health - People who have little interest in doing things (%)
Mental Health - People feeling down, depressed, or hopeless (%)
Mental Health - People who have trouble sleeping or sleeping too much (%)
Mental Health - People feeling tired or having little energy (%)
Mental Health - People with poor appetite or overeating (%)
Mental Health - People feeling bad about themself (%)
Mental Health - People who have trouble concentrating on things (%)
Mental Health - People moving or speaking slowly or too fast (%)
Mental Health - People having thoughts they would be better off dead (%)
Oral Health - Average years since last visit a dentist
Oral Health - People embarrassed because of mouth (%)
Oral Health - People with gum disease (%)
Oral Health - General health of teeth and gums (%)
Oral Health - Average days a week using dental floss/device
Oral Health - Average days a week using mouthwash for dental problem
Oral Health - Average number of teeth
Pesticide Use - Households using pesticides to control insects (%)
Pesticide Use - Households using pesticides to kill weeds (%)
Physical Activity - People doing vigorous-intensity work activities (%)
Physical Activity - People doing moderate-intensity work activities (%)
Physical Activity - People walking or bicycling (%)
Physical Activity - People doing vigorous-intensity recreational activities (%)
Physical Activity - People doing moderate-intensity recreational activities (%)
Physical Activity - Average hours a day doing sedentary activities
Physical Activity - Average hours a day watching TV or videos
Physical Activity - Average hours a day using computer
Physical Functioning - People having limitations keeping them from working (%)
Physical Functioning - People limited in amount of work they can do (%)
Physical Functioning - People that need special equipment to walk (%)
Physical Functioning - People experiencing confusion/memory problems (%)
Physical Functioning - People requiring special healthcare equipment (%)
Prescription Medications - Average number of prescription medicines taking
Preventive Aspirin Use - Adults 40+ taking low-dose aspirin (%)
Reproductive Health - Vaginal deliveries (%)
Reproductive Health - Cesarean deliveries (%)
Reproductive Health - Deliveries resulted in a live birth (%)
Reproductive Health - Pregnancies resulted in a delivery (%)
Reproductive Health - Women breastfeeding newborns (%)
Reproductive Health - Women that had a hysterectomy (%)
Reproductive Health - Women that had both ovaries removed (%)
Reproductive Health - Women that have ever taken birth control pills (%)
Reproductive Health - Women taking birth control pills (%)
Reproductive Health - Women that have ever used Depo-Provera or injectables (%)
Reproductive Health - Women that have ever used female hormones (%)
Sexual Behavior - People 18+ that ever had sex (vaginal, anal, or oral) (%)
Sexual Behavior - Males 18+ that ever had vaginal sex with a woman (%)
Sexual Behavior - Males 18+ that ever performed oral sex on a woman (%)
Sexual Behavior - Males 18+ that ever had anal sex with a woman (%)
Sexual Behavior - Males 18+ that ever had any sex with a man (%)
Sexual Behavior - Females 18+ that ever had vaginal sex with a man (%)
Sexual Behavior - Females 18+ that ever performed oral sex on a man (%)
Sexual Behavior - Females 18+ that ever had anal sex with a man (%)
Sexual Behavior - Females 18+ that ever had any kind of sex with a woman (%)
Sexual Behavior - Average age people first had sex
Sexual Behavior - Average number of female sex partners in lifetime (males 18+)
Sexual Behavior - Average number of female vaginal sex partners in lifetime (males 18+)
Sexual Behavior - Average age people first performed oral sex on a woman (18+)
Sexual Behavior - Average number of woman performed oral sex on in lifetime (18+)
Sexual Behavior - Average number of male sex partners in lifetime (males 18+)
Sexual Behavior - Average number of male anal sex partners in lifetime (males 18+)
Sexual Behavior - Average age people first performed oral sex on a man (18+)
Sexual Behavior - Average number of male oral sex partners in lifetime (18+)
Sexual Behavior - People using protection when performing oral sex (%)
Sexual Behavior - Average number of times people have vaginal or anal sex a year
Sexual Behavior - People having sex without condom (%)
Sexual Behavior - Average number of male sex partners in lifetime (females 18+)
Sexual Behavior - Average number of male vaginal sex partners in lifetime (females 18+)
Sexual Behavior - Average number of female sex partners in lifetime (females 18+)
Sexual Behavior - Circumcised males 18+ (%)
Sleep Disorders - Average hours sleeping at night
Sleep Disorders - People that has trouble sleeping (%)
Smoking-Cigarette Use - People smoking cigarettes (%)
Taste & Smell - People 40+ having problems with smell (%)
Taste & Smell - People 40+ having problems with taste (%)
Taste & Smell - People 40+ that ever had wisdom teeth removed (%)
Taste & Smell - People 40+ that ever had tonsils teeth removed (%)
Taste & Smell - People 40+ that ever had a loss of consciousness because of a head injury (%)
Taste & Smell - People 40+ that ever had a broken nose or other serious injury to face or skull (%)
Taste & Smell - People 40+ that ever had two or more sinus infections (%)
Weight - Average height (inches)
Weight - Average weight (pounds)
Weight - Average BMI
Weight - People that are obese (%)
Weight - People that ever were obese (%)
Weight - People trying to lose weight (%)
According to our research of Texas and other state lists, there were 24 registered sex offenders living in Richardson, Texas as of April 27, 2024 . The ratio of all residents to sex offenders in Richardson is 4,626 to 1.The ratio of registered sex offenders to all residents in this city is much lower than the state average.
The City-Data.com crime index weighs serious crimes and violent crimes more heavily. Higher means more crime, U.S. average is 246.1. It adjusts for the number of visitors and daily workers commuting into cities.
- means the value is smaller than the state average.
- means the value is about the same as the state average.
- means the value is bigger than the state average.
Crime rate in Richardson detailed stats: murders, rapes, robberies, assaults, burglaries, thefts, arson Officers per 1,000 residents here:
1.33Texas average:
2.07
Latest news from Richardson, TX collected exclusively by city-data.com from local newspapers, TV, and radio stations
Richardson, TX City Guides: Ancestries: English (6.1%), German (4.7%), American (4.3%), European (3.2%), Irish (2.9%), Ethiopian (1.6%).
Current Local Time:
Land area: 28.6 square miles.
Population density: 4,159 people per square mile (average).
28,223 residents are foreign born (12.4% Asia , 5.9% Latin America , 3.0% Africa ).
This city:
23.9%Texas:
17.1%
Median real estate property taxes paid for housing units with mortgages in 2022: $6,577 (1.5%)Median real estate property taxes paid for housing units with no mortgage in 2022: $4,714 (1.3%)
Nearest city with pop. 200,000+: Plano, TX
Nearest city with pop. 1,000,000+: Dallas, TX
Nearest cities:
Latitude: 32.97 N, Longitude: 96.72 W
Daytime population change due to commuting: +42,335 (+35.6%)Workers who live and work in this city: 26,906 (42.6%)
Property values in Richardson, TX
Single-family new house construction building permits:
2022: 92 buildings , average cost: $500,8002021: 40 buildings , average cost: $683,0002020: 45 buildings , average cost: $836,6002019: 69 buildings , average cost: $572,0002018: 85 buildings , average cost: $434,0002017: 134 buildings , average cost: $429,2002016: 78 buildings , average cost: $405,0002015: 114 buildings , average cost: $375,5002014: 95 buildings , average cost: $354,3002013: 150 buildings , average cost: $289,8002012: 431 buildings , average cost: $213,6002011: 55 buildings , average cost: $208,7002010: 56 buildings , average cost: $208,8002009: 55 buildings , average cost: $208,4002008: 68 buildings , average cost: $210,0002007: 148 buildings , average cost: $204,0002006: 104 buildings , average cost: $255,1002005: 125 buildings , average cost: $263,5002004: 107 buildings , average cost: $233,6002003: 175 buildings , average cost: $332,7002002: 202 buildings , average cost: $316,6002001: 379 buildings , average cost: $212,3002000: 504 buildings , average cost: $238,3001999: 486 buildings , average cost: $227,8001998: 508 buildings , average cost: $186,3001997: 462 buildings , average cost: $158,200Unemployment in December 2023:
Population change in the 1990s: +16,795 (+22.4%).
Most common occupations in Richardson, TX (%)
Both Males Females
Other management occupations, except farmers and farm managers (7.2%)
Cooks and food preparation workers (7.0%)
Computer specialists (5.9%)
Engineers (3.9%)
Secretaries and administrative assistants (2.9%)
Building and grounds cleaning and maintenance occupations (2.6%)
Cashiers (2.4%)
Computer specialists (8.5%)
Other management occupations, except farmers and farm managers (7.7%)
Cooks and food preparation workers (7.3%)
Engineers (6.3%)
Material recording, scheduling, dispatching, and distributing workers (3.1%)
Electrical equipment mechanics and other installation, maintenance, and repair workers, including supervisors (2.7%)
Building and grounds cleaning and maintenance occupations (2.6%)
Cooks and food preparation workers (6.6%)
Other management occupations, except farmers and farm managers (6.5%)
Secretaries and administrative assistants (6.2%)
Other office and administrative support workers, including supervisors (4.2%)
Registered nurses (3.5%)
Cashiers (3.4%)
Computer specialists (2.7%)
Tornado activity:
Richardson-area historical tornado activity is above Texas state average. It is 153% greater than the overall U.S. average.
On 4/25/1994, a category F4 (max. wind speeds 207-260 mph) tornado 20.6 miles away from the Richardson city center killed 3 people and injured 48 people and caused between $50,000,000 and $500,000,000 in damages.
On 5/26/1976, a category F3 (max. wind speeds 158-206 mph) tornado 4.9 miles away from the city center injured one person and caused between $500,000 and $5,000,000 in damages.
Earthquake activity:
Richardson-area historical earthquake activity is significantly above Texas state average. It is 486% greater than the overall U.S. average. On 11/6/2011 at 03:53:10, a magnitude 5.7 (5.7 MW, Depth: 3.2 mi, Class: Moderate, Intensity: VI - VII) earthquake occurred 177.5 miles away from the city center On 9/3/2016 at 12:02:44, a magnitude 5.8 (5.8 MW, Depth: 3.5 mi) earthquake occurred 239.6 miles away from the city center On 6/16/1978 at 11:46:54, a magnitude 5.3 (4.4 MB, 4.6 UK, 5.3 ML) earthquake occurred 235.0 miles away from the city center On 5/17/2012 at 08:12:00, a magnitude 4.8 (4.8 MW, Depth: 3.1 mi, Class: Light, Intensity: IV - V) earthquake occurred 154.7 miles away from the city center On 11/7/2016 at 01:44:24, a magnitude 5.0 (5.0 MW, Depth: 2.8 mi) earthquake occurred 209.3 miles away from the city center On 11/8/2011 at 02:46:57, a magnitude 4.8 (4.8 MW, Depth: 3.1 mi) earthquake occurred 177.5 miles away from Richardson center Magnitude types: body-wave magnitude (MB), local magnitude (ML), moment magnitude (MW) Natural disasters: The number of natural disasters in Dallas County (21) is greater than the US average (15).Major Disasters (Presidential) Declared: 9Emergencies Declared: 10Hurricanes: 7, Storms: 7, Floods: 5, Tornadoes: 5, Fires: 4, Winds: 2, Flash Flood: 1, Winter Storm: 1, Other: 2 (Note: some incidents may be assigned to more than one category). Main business address for: KANEB PIPE LINE OPERATING PARTNERSHIP LP PIPE LINES (NO NATURAL GAS) ), Reef Global Energy IV, L.P. CRUDE PETROLEUM & NATURAL GAS ), KANEB PIPE LINE PARTNERS L P WHOLESALE-PETROLEUM BULK STATIONS & TERMINALS ), LENNOX INTERNATIONAL INC AIR COND & WARM AIR HEATING EQUIP & COMM & INDL REFRIG EQUIP ), Reef Global Energy V, L.P. CRUDE PETROLEUM & NATURAL GAS ), Remote Dynamics Inc RADIO TELEPHONE COMMUNICATIONS ), KANEB SERVICES LLC WHOLESALE-PETROLEUM & PETROLEUM PRODUCTS (NO BULK STATIONS) ), INET TECHNOLOGIES INC SERVICES-PREPACKAGED SOFTWARE ) and 8 other public companies .
Hospitals in Richardson: ALWAYS AND EVER HOSPICE INC (670 W ARAPAHO, SUITE 12) METHODIST RICHARDSON MEDICAL CENTER (Government - Hospital District or Authority, provides emergency services, 401 W CAMPBELL RD) MOSAIC (1809 AUBURN) UNITED CEREBRAL PALSY ABILITY (615-617 WOODHAVEN PL) Home Health Centers in Richardson: 1ST NORTHSTAR HOME HEALTH SERVICES INC (5407 FAVERSHAM DR) CREDENCE HOME HEALTH SERVICES INC (1701 N GREENVILLE SUITE 816) EBT HOME HEALTH SERVICES (1219 ABRAMS RD SUITE 110) JEFTONS HEALTH CARE SERVICES INC (3808 BRANTFORD DR) LUCENT HOME HEALTH LLC (1485 RICHARDSON DRIVE SUITE 135) MIDAS HEALTHCARE SERVICES INC (801 EAST CAMPBELL ROAD SUITE 155) NYS HOME HEALTH LLC (100 N CENTRAL EXPWY STE 703) PATIENCE HOME HEALTH SERVICES INC (999 E ARAPAHO ROAD SUITE 120) PROFESSIONAL HEALTHCARE SERVICES (811 SOUTH CENTRAL EXPRESSWAY SUITE 515) SMARTCARE HEALTH SERVICES INC (811 SOUTH CENTRAL EXPWY SUITE 411) Nursing Homes in Richardson: BAYLOR RICHARDSON MED CE (401 WEST CAMPBELL ROAD) HERITAGE VILLAGE (1111 ROCKINGHAM DR) LANDMARK OF RICHARDSON HEALTH AND REHAB (1510 NORTH PLANO ROAD) LINDAN PARK CARE CENTER LP (1510 N PLANO RD) REMINGTON MEDICAL RESORT-RICHARDSON (1350 E LOOKOUT DR) SAN REMO (3550 N SHILOH RD) THE GARDENS OF RICHARDSON (1111 W SHORE DR) THE PLAZA AT RICHARDSON (1301 RICHARDSON DR) THE VILLAGE AT RICHARDSON (1111 ROCKINGHAM LN) Amtrak station near Richardson: 15 miles: DALLAS (400 S. HOUSTON ST.) Services: ticket office, fully wheelchair accessible, enclosed waiting area, public restrooms, public payphones, vending machines, paid short-term parking, paid long-term parking, call for car rental service, taxi stand, public transit connection.
Colleges/Universities in Richardson: The University of Texas at Dallas Full-time enrollment: 16,777; Location: 800 West Campbell Road; Public; Website: www.utdallas.edu; Offers Doctor's degree )
ITT Technical Institute-Richardson Full-time enrollment: 706; Location: 2101 Waterview Pky; Private, for-profit; Website: www.itt-tech.edu)
Vista College-Online Full-time enrollment: 324; Location: 300 N. Coit Road, Suite 300; Private, for-profit; Website: vistacollege.edu)
Utah College of Massage Therapy-Dallas Full-time enrollment: 238; Location: 1055 S. Sherman Street; Private, for-profit; Website: www.texasmassagetherapy.com)
National American University-Richardson Full-time enrollment: 69; Location: 300 North Coit Road Suite 225; Private, for-profit; Website: www.national.edu/locations/richardson)
Other colleges/universities with over 2000 students near Richardson:
Richland College (about 4 miles; Dallas, TX ; Full-time enrollment: 11,617)
Brookhaven College (about 9 miles; Farmers Branch, TX ; FT enrollment: 6,868)
Southern Methodist University (about 10 miles; Dallas, TX ; FT enrollment: 9,150)
Eastfield College (about 11 miles; Mesquite, TX ; FT enrollment: 8,323)
El Centro College (about 14 miles; Dallas, TX ; FT enrollment: 6,086)
Collin County Community College District (about 15 miles; McKinney, TX ; FT enrollment: 18,044)
University of Dallas (about 15 miles; Irving, TX ; FT enrollment: 2,192)
Public high schools in Richardson: BERKNER H S Students: 2,727, Location: 1600 E SPRING VLY RD, Grades: 9-12)PEARCE H S Students: 1,959, Location: 1600 N COIT RD, Grades: 9-12)RICHARDSON H S Students: 448, Location: 1250 W BELT LINE RD, Grades: 9-12)EVOLUTION ACADEMY CHARTER SCHOOL Students: 379, Location: 1101 S SHERMAN ST, Grades: 9-12, Charter school )CHRISTA MCAULIFFE LEARNING CENTER Students: 57, Location: 900 S GREENVILLE AVE, Grades: 2-12)P A S S LEARNING CTR Students: 12, Location: 400 E SPRING VLY RD, Grades: 8-9)WINFREE ACADEMY CHARTER SCHOOL (RICHARDSON) Location: 1661 GATEWAY BLVD, Grades: 9-12, Charter school )
PREMIER H S OF RICHARDSON Location: 1111 DIGITAL DR, Grades: 9-12, Charter school )
JJAEP Location: 400 E SPRING VALLEY RD, Grades: 9-12)Private high schools in Richardson: CANYON CREEK CHRISTIAN ACADEMY Students: 400, Location: 2800 CUSTER PKWY, Grades: PK-12)
I A N T QUR'ANIC ACADEMY Students: 238, Location: 840 ABRAMS RD, Grades: KG-12)
NORTH DALLAS ADVENTIST ACADEMY Students: 214, Location: 302 CENTENNIAL BLVD, Grades: PK-12)
PEACE ACADEMY Students: 209, Location: 701 N PLANO RD, Grades: PK-10)
THE ALEXANDER SCHOOL Students: 23, Location: 409 INTERNATIONAL PKWY, Grades: 7-12)
Biggest public elementary/middle schools in Richardson: STINSON EL Students: 758, Location: 4201 GREENFIELD DR, Grades: KG-5)APOLLO J H Students: 742, Location: 1600 APOLLO RD, Grades: 7-8)RICHARDSON WEST J H Students: 650, Location: 1309 HOLLY DR, Grades: 7-8)MATH/SCIENCE/TECH MAGNET Students: 649, Location: 450 ABRAMS RD, Grades: KG-6)MILLER EL Students: 594, Location: 5651 COVENTRY DR, Grades: KG-5)RICHLAND EL Students: 593, Location: 550 PARK BEND, Grades: KG-6)ALDRIDGE EL Students: 548, Location: 720 PLEASANT VALLEY LN, Grades: KG-5)ARAPAHO CLASSICAL MAGNET Students: 547, Location: 1300 CYPRESS DR, Grades: KG-6)RICHARDSON NORTH J H Students: 537, Location: 1820 N FLOYD RD, Grades: 7-8)DOVER EL Students: 528, Location: 700 DOVER DR, Grades: PK-6)Private elementary/middle schools in Richardson: ST JOSEPH CATHOLIC SCHOOL Students: 363, Location: 600 S JUPITER RD, Grades: KG-8)
ST PAUL THE APOSTLE SCHOOL Students: 331, Location: 720 S FLOYD RD, Grades: PK-8)
BRECKINRIDGE MONTESSORI SCHOOL Students: 207, Location: 3900 BRECKENRIDGE BLVD, Grades: UG-4)
DALLAS NORTH MONTESSORI SCHOOL Students: 37, Location: 1149 ROCKINGHAM DR, Grades: PK-3)
See full list of schools located in Richardson Library in Richardson: RICHARDSON PUBLIC LIBRARY Operating income: $3,412,929; Location: 900 CIVIC CENTER DR; 237,908 books ; 12,175 audio materials ; 12,155 video materials ; 12 local licensed databases ; 50 state licensed databases ; 300 print serial subscriptions )
User-submitted facts and corrections:
Highland Academy is now The Lattner SChool located at 701 Centennial Blvd. in Richardson and we can be contacted at 972-238-7567.
Baylor Richardson Medical Center is now known as Richardson Medical Center.
Notable locations in Richardson: (A) , Richardson Fire Department Station 1 (B) , Richardson Fire Department Station 6 (C) , Richardson Fire Department Station 3 (D) , Richardson Fire Department Station 2 (E) , Richardson Fire Department Station 4 (F) , Richardson Fire Department Station 5 (G) . Display/hide their locations on the map
Shopping Centers: (1) , Spring Creek Village Shopping Center (2) , Richardson Square Shopping Center (3) . Display/hide their locations on the map
Main business address in Richardson include: (A) , Reef Global Energy IV, L.P. (B) , KANEB PIPE LINE PARTNERS L P (C) , LENNOX INTERNATIONAL INC (D) , Reef Global Energy V, L.P. (E) , Remote Dynamics Inc (F) , KANEB SERVICES LLC (G) , INET TECHNOLOGIES INC (H) . Display/hide their locations on the map
Churches in Richardson include: (A) , The Church of Jesus Christ of Latter Day Saints (B) , Town North Presbyterian Church (C) , Korean Presbyterian Church (D) , Community Bible Chapel Church (E) , Christians at Richardson East Church (F) , Shady Grove Church (G) , Fellowship Bible Church North (H) , Richland Bible Fellowship Church (I) . Display/hide their locations on the map
Cemeteries: (1) , Routh Cemetery (2) . Display/hide their locations on the map
Streams, rivers, and creeks: (A) , Cottonwood Creek (B) , Beck Branch (C) . Display/hide their locations on the map
Parks in Richardson include: (1) , Heights Park (2) , Richland Park (3) , Prairie Creek Park (4) , Mimosa Park (5) , Mark Twain Park (6) , Woodland Park (7) , Yale Park (8) , Terrace Park (9) . Display/hide their locations on the map
Tourist attractions: (1) , Cyber Zone (Amusement & Theme Parks; 501 South Plano Road) (2) , Amf (Amusement & Theme Parks; 2101 North Central Expressway) (3) . Display/hide their approximate locations on the map
Hotels: (1) , Best Western Dallas Telecom Area (13636 Goldmark Drive) (2) , Champ Restaurant Equipment Supplies (317 Hilltop Ave) (3) , 1bbweb Bed and Breakfast Directory (P.O. Box 836173) (4) , Charles Thompson & Associates (1748 North Greenville Avenue) (5) . Display/hide their approximate locations on the map
Birthplace of: Joseph Nation - Politician, Anthony Dill - College basketball player (Texas State Bobcats), Eddie Jackson (American football) - Football player, Rodrick Epps - College basketball player (Texas Arlington Mavericks), Scott Turner (American football) - Football player.
Dallas County has a predicted average indoor radon screening level less than 2 pCi/L (pico curies per liter) - Low Potential Average household size: This city:
2.5 peopleTexas:
2.8 people
Percentage of family households: This city:
66.0%Whole state:
69.9%
Percentage of households with unmarried partners: This city:
4.5%Whole state:
6.0%
Likely homosexual households (counted as self-reported same-sex unmarried-partner households)
Lesbian couples: 0.4% of all households Gay men: 0.5% of all households
People in group quarters in Richardson in 2010:
501 people in nursing facilities/skilled-nursing facilities
387 people in college/university student housing
16 people in local jails and other municipal confinement facilities
14 people in workers' group living quarters and job corps centers
13 people in group homes intended for adults
People in group quarters in Richardson in 2000:
509 people in nursing homes
161 people in other noninstitutional group quarters
40 people in other group homes
31 people in homes or halfway houses for drug/alcohol abuse
20 people in local jails and other confinement facilities (including police lockups)
20 people in homes for the mentally retarded
10 people in mental (psychiatric) hospitals or wards
6 people in homes for the physically handicapped
5 people in hospitals or wards for drug/alcohol abuse
4 people in orthopedic wards and institutions for the physically handicapped
2 people in homes for the mentally ill
Banks with most branches in Richardson (2011 data):
JPMorgan Chase Bank, National Association: 9 branches. Info updated 2011/11/10: Bank assets: $1,811,678.0 mil, Deposits: $1,190,738.0 mil, headquarters in Columbus, OH, positive income , International Specialization, 5577 total offices , Holding Company: Jpmorgan Chase & Co.
Compass Bank: Richardson East Branch, Arapaho In-Store Branch, Promenade Motorbank Branch, Promenade Branch. Info updated 2011/02/24: Bank assets: $63,107.0 mil, Deposits: $46,232.4 mil, headquarters in Birmingham, AL, negative income in the last year , Commercial Lending Specialization, 720 total offices , Holding Company: Banco Bilbao Vizcaya Argentaria, S.A.
Bank of America, National Association: Lennox Ctr. Bkg. Store Branch, Centennial Branch, Richardson Square Office, Richardson Branch. Info updated 2009/11/18: Bank assets: $1,451,969.3 mil, Deposits: $1,077,176.8 mil, headquarters in Charlotte, NC, positive income , 5782 total offices , Holding Company: Bank Of America Corporation
Wells Fargo Bank, National Association: Campbell Branch, Custer Parkway Branch, University Of Texas At Dallas. Info updated 2011/04/05: Bank assets: $1,161,490.0 mil, Deposits: $905,653.0 mil, headquarters in Sioux Falls, SD, positive income , 6395 total offices , Holding Company: Wells Fargo & Company
Comerica Bank: Campbell/Central Branch, Richardson - Beltline Branch, Central/Spring Valley Branch. Info updated 2011/07/29: Bank assets: $60,970.5 mil, Deposits: $48,300.9 mil, headquarters in Dallas, TX, positive income , Commercial Lending Specialization, 497 total offices , Holding Company: Comerica Incorporated
ViewPoint Bank, National Association: Richardson Branch, West Richardson Branch, Richardson Motor Branch. Info updated 2012/01/06: Bank assets: $3,179.7 mil, Deposits: $2,050.8 mil, headquarters in Plano, TX, positive income , Mortgage Lending Specialization, 24 total offices , Holding Company: Viewpoint Financial Group, Inc.
The Frost National Bank: Dallas Richarson Motorbank Branch at 850 E. Campbell Rd, branch established on 2008/11/17; Richardson Branch at 700 E. Campbell Road, Suite 130, branch established on 2008/12/15. Info updated 2006/12/21: Bank assets: $20,372.1 mil, Deposits: $16,846.8 mil, headquarters in San Antonio, TX, positive income , Commercial Lending Specialization, 133 total offices , Holding Company: Cullen/Frost Bankers, Inc.
First National Bank Texas: Richardson Banking Center - Rc 873 at 430 N. Coit Road, branch established on 2004/07/01; Centennial Banking Center - Rc 526 at 536 Centennial, branch established on 2004/02/09. Info updated 2006/11/03: Bank assets: $944.3 mil, Deposits: $815.9 mil, headquarters in Killeen, TX, positive income , Mortgage Lending Specialization, 250 total offices , Holding Company: First Community Bancshares, Inc.
BOKF, National Association: East Richardson Branch at 1600 E Belt Line Road, branch established on 2000/10/01; Richardson Branch at 333 West Campbell Road, branch established on 1976/02/23. Info updated 2012/02/28: Bank assets: $25,360.0 mil, Deposits: $19,171.3 mil, headquarters in Tulsa, OK, positive income , Commercial Lending Specialization, 189 total offices , Holding Company: Bok Financial Corporation
19 other banks with 20 local branches
For population 15 years and over in Richardson:
Never married: 38.9%Now married: 47.4%Separated: 1.5%Widowed: 3.6%Divorced: 8.6% For population 25 years and over in Richardson:
High school or higher: 92.5%Bachelor's degree or higher: 54.7%Graduate or professional degree: 20.4%Unemployed: 3.2%Mean travel time to work (commute): 17.1 minutes
Education Gini index (Inequality in education) Here:
11.8Texas average:
14.0
Religion statistics for Richardson, TX (based on Dallas County data)
Religion Adherents Congregations Evangelical Protestant 615,849 1,672 Catholic 446,996 57 Mainline Protestant 166,224 240 Other 147,445 174 Black Protestant 69,831 174 Orthodox 8,813 19 None 912,981 -
Source: Clifford Grammich, Kirk Hadaway, Richard Houseal, Dale E.Jones, Alexei Krindatch, Richie Stanley and Richard H.Taylor. 2012. 2010 U.S.Religion Census: Religious Congregations & Membership Study. Association of Statisticians of American Religious Bodies. Jones, Dale E., et al. 2002. Congregations and Membership in the United States 2000. Nashville, TN: Glenmary Research Center. Graphs represent county-level data
Food Environment Statistics: Number of grocery stores : 392This county :
1.64 / 10,000 pop.Texas :
1.47 / 10,000 pop.
Number of supercenters and club stores : 25Dallas County :
0.10 / 10,000 pop.Texas :
0.14 / 10,000 pop.
Number of convenience stores (no gas) : 275Dallas County :
1.15 / 10,000 pop.State :
1.11 / 10,000 pop.
Number of convenience stores (with gas) : 673Dallas County :
2.82 / 10,000 pop.State :
3.95 / 10,000 pop.
Number of full-service restaurants : 1,603Dallas County :
6.73 / 10,000 pop.Texas :
6.13 / 10,000 pop.
Adult diabetes rate : Dallas County :
8.8%Texas :
8.9%
Adult obesity rate : Dallas County :
27.1%Texas :
26.6%
Low-income preschool obesity rate : Dallas County :
17.0%State :
15.7%
Health and Nutrition: Healthy diet rate : Richardson:
51.6%Texas:
48.6%
Average overall health of teeth and gums : This city:
50.1%State:
47.4%
People feeling badly about themselves : Richardson:
20.0%Texas:
20.6%
People not drinking alcohol at all : Richardson:
10.3%State:
10.3%
Average hours sleeping at night : Overweight people : This city:
32.7%Texas:
33.1%
General health condition : Richardson:
58.3%State:
56.2%
Average condition of hearing : More about Health and Nutrition of Richardson, TX Residents
Local government employment and payroll (March 2022)
Function
Full-time employees
Monthly full-time payroll
Average yearly full-time wage
Part-time employees
Monthly part-time payroll
Police Protection - Officers
162 $1,510,185 $111,866 3 $9,404 Firefighters
159 $1,471,927 $111,089 0 $0 Parks and Recreation
139 $699,544 $60,392 60 $47,175 Police - Other
85 $481,753 $68,012 30 $34,432 Other and Unallocable
82 $477,788 $69,920 4 $4,570 Financial Administration
79 $561,547 $85,298 3 $8,470 Solid Waste Management
43 $186,354 $52,006 0 $0 Streets and Highways
39 $263,907 $81,202 0 $0 Housing and Community Development (Local)
38 $326,200 $103,011 1 $3,465 Local Libraries
29 $152,325 $63,031 34 $45,054 Water Supply
23 $136,577 $71,258 2 $2,936 Health
18 $91,286 $60,857 0 $0 Other Government Administration
17 $181,653 $128,226 0 $0 Judicial and Legal
12 $67,080 $67,080 6 $21,284 Sewerage
6 $37,658 $75,316 0 $0 Fire - Other
6 $33,996 $67,992 0 $0
Totals for Government
937 $6,679,780 $85,547 143 $176,791
Richardson government finances - Expenditure in 2021 (per resident):
Construction - Regular Highways: $23,448,000 ($197.37)
General - Other: $22,684,000 ($190.94)Local Fire Protection: $18,700,000 ($157.40)Water Utilities: $3,149,000 ($26.51)Natural Resources - Other: $1,414,000 ($11.90)Solid Waste Management: $1,186,000 ($9.98)Current Operations - Water Utilities: $37,699,000 ($317.33)
Sewerage: $35,314,000 ($297.25)Police Protection: $32,532,000 ($273.83)Local Fire Protection: $26,520,000 ($223.23)Parks and Recreation: $21,044,000 ($177.14)General - Other: $17,608,000 ($148.21)Solid Waste Management: $15,042,000 ($126.61)Regular Highways: $12,560,000 ($105.72)Libraries: $3,740,000 ($31.48)Central Staff Services: $3,253,000 ($27.38)Financial Administration: $3,234,000 ($27.22)General Public Buildings: $2,703,000 ($22.75)Health - Other: $2,127,000 ($17.90)Natural Resources - Other: $1,972,000 ($16.60)Judicial and Legal Services: $1,930,000 ($16.25)Protective Inspection and Regulation - Other: $1,416,000 ($11.92)General - Interest on Debt: $14,403,000 ($121.24)
Other Capital Outlay - Parks and Recreation: $2,036,000 ($17.14)
General - Other: $593,000 ($4.99)Health - Other: $2,000 ($0.02)Total Salaries and Wages: $116,053,000 ($976.86)
Water Utilities - Interest on Debt: $1,724,000 ($14.51)
Richardson government finances - Revenue in 2021 (per resident):
Charges - Sewerage: $31,605,000 ($266.03)
Solid Waste Management: $14,810,000 ($124.66)Parks and Recreation: $6,439,000 ($54.20)Other: $5,882,000 ($49.51)Natural Resources - Other: $2,813,000 ($23.68)Federal Intergovernmental - Other: $260,000 ($2.19)
Local Intergovernmental - Other: $1,804,000 ($15.18)
Miscellaneous - Interest Earnings: $3,844,000 ($32.36)
Fines and Forfeits: $2,852,000 ($24.01)General Revenue - Other: $1,136,000 ($9.56)Donations From Private Sources: $453,000 ($3.81)Revenue - Water Utilities: $51,810,000 ($436.10)
State Intergovernmental - Other: $2,359,000 ($19.86)
Highways: $841,000 ($7.08)General Local Government Support: $607,000 ($5.11)Health and Hospitals: $310,000 ($2.61)Tax - Property: $107,353,000 ($903.63)
General Sales and Gross Receipts: $41,585,000 ($350.04)Public Utilities Sales: $17,944,000 ($151.04)Other Selective Sales: $4,395,000 ($36.99)Other License: $2,987,000 ($25.14)Occupation and Business License - Other: $288,000 ($2.42)Amusements Sales: $46,000 ($0.39)
Richardson government finances - Debt in 2021 (per resident):
Long Term Debt - Beginning Outstanding - Unspecified Public Purpose: $319,470,000 ($2689.10)
Outstanding Unspecified Public Purpose: $286,390,000 ($2410.65)Retired Unspecified Public Purpose: $33,080,000 ($278.45)
Richardson government finances - Cash and Securities in 2021 (per resident):
Bond Funds - Cash and Securities: $93,181,000 ($784.34)
Other Funds - Cash and Securities: $98,338,000 ($827.75)
Sinking Funds - Cash and Securities: $3,499,000 ($29.45)
7.50% of this county's 2021 resident taxpayers lived in other counties in 2020 ($78,710 average adjusted gross income )
Here:
7.50%Texas average:
8.12%
0.01% of residents moved from foreign countries ($115 average AGI )Dallas County:
0.01%Texas average:
0.04%
Top counties from which taxpayers relocated into this county between 2020 and 2021:
8.56% of this county's 2020 resident taxpayers moved to other counties in 2021 ($74,660 average adjusted gross income )
Here:
8.56%Texas average:
7.40%
0.02% of residents moved to foreign countries ($227 average AGI )Dallas County:
0.02%Texas average:
0.03%
Top counties to which taxpayers relocated from this county between 2020 and 2021:
Businesses in Richardson, TX
Name Count Name Count
24 Hour Fitness 1 LA Fitness 1 7-Eleven 6 Lane Furniture 1 ALDI 1 Little Caesars Pizza 2 AMF Bowling 1 Long John Silver's 1 AT&T 3 Lowe's 1 Albertsons 1 Marriott 4 Applebee's 1 Mazda 1 Arby's 3 McDonald's 6 AutoZone 1 New Balance 1 Baskin-Robbins 1 Nike 8 Blockbuster 2 Nissan 1 Budget Car Rental 1 OfficeMax 1 Burger King 2 Panera Bread 1 Burlington Coat Factory 1 Papa John's Pizza 1 CVS 4 Payless 2 Chevrolet 1 Pizza Hut 1 Chick-Fil-A 2 Qdoba Mexican Grill 1 Chipotle 1 Quiznos 3 Curves 1 RadioShack 2 Domino's Pizza 2 Red Roof Inn 1 DressBarn 1 SONIC Drive-In 2 Dressbarn 1 Safeway 3 Econo Lodge 1 Sears 2 FedEx 14 Sprint Nextel 1 Firestone Complete Auto Care 2 Staples 1 Ford 1 Starbucks 7 GNC 2 Subway 8 GameStop 3 T-Mobile 5 H&R Block 3 T.J.Maxx 1 Hawthorn 1 Taco Bell 2 Hilton 1 Target 1 Holiday Inn 1 Toyota 1 Home Depot 1 U-Haul 3 Homestead Studio Suites 1 UPS 14 Honda 1 Volkswagen 1 Hyatt 1 Vons 3 IHOP 1 Waffle House 1 Jack In The Box 3 Walgreens 2 Jimmy John's 3 Walmart 2 Jones New York 2 Wendy's 4 KFC 1 Whole Foods Market 1 Kroger 2 YMCA 1
Strongest AM radio stations in Richardson:
KRLD (1080 AM; 50 kW; DALLAS, TX; Owner: TEXAS INFINITY BROADCASTING L.P.)
KAAM (770 AM; 10 kW; GARLAND, TX; Owner: DONTRON, INC.)
KSKY (660 AM; 20 kW; BALCH SPRINGS, TX; Owner: BISON MEDIA, INC.)
KFXR (1190 AM; 50 kW; DALLAS, TX; Owner: CLEAR CHANNEL BROADCASTING LICENSES, INC.)
KBIS (1150 AM; 25 kW; HIGHLAND PARK, TX; Owner: DALLAS AM RADIO PARTNERS, L.P.)
KZMP (1540 AM; 50 kW; UNIVERSITY PARK, TX; Owner: ENTRAVISION HOLDINGS, LLC)
WBAP (820 AM; 50 kW; FORT WORTH, TX; Owner: WBAP-KSCS OPERATING, LTD.)
KTCK (1310 AM; 9 kW; DALLAS, TX; Owner: KRBE LICO, INC.)
KESS (1270 AM; 50 kW; FORT WORTH, TX; Owner: KESS-AM LICENSE CORP.)
KLIF (570 AM; 5 kW; DALLAS, TX; Owner: KLIF LICO, INC.)
KGGR (1040 AM; daytime; 5 kW; DALLAS, TX; Owner: MORTENSON BROADCASTING COMPANY)
KAHZ (1360 AM; 50 kW; HURST, TX)
KMKI (620 AM; 5 kW; PLANO, TX; Owner: ABC, INC)
Strongest FM radio stations in Richardson:
WRR (101.1 FM; DALLAS, TX; Owner: CITY OF DALLAS, TEXAS)
KPLX (99.5 FM; FORT WORTH, TX; Owner: KPLX LICO, INC.)
KLUV-FM (98.7 FM; DALLAS, TX; Owner: INFINITY BROADCASTING CORPORATION OF DALLAS)
KLLI (105.3 FM; DALLAS, TX; Owner: INFINITY BROADCASTING CORPORATION OF DALLAS)
KHKS (106.1 FM; DENTON, TX; Owner: AMFM TEXAS LICENSES LIMITED PARTNERSHIP)
KOAI (107.5 FM; FORT WORTH, TX; Owner: INFINITY KOAI-FM, INC.)
KZPS (92.5 FM; DALLAS, TX; Owner: AMFM TEXAS LICENSES LIMITED PARTNERSHIP)
KVIL-FM (103.7 FM; HIGHLAND PARK-DALLAS, TX; Owner: INFINITY BROADCASTING CORPORATION OF TEXAS)
KEGL (97.1 FM; FORT WORTH, TX; Owner: CITICASTERS LICENSES, L.P.)
KKDA-FM (104.5 FM; DALLAS, TX; Owner: SERVICE BROADCASTING I, LTD.)
KRBV (100.3 FM; DALLAS, TX; Owner: INFINITY BROADCASTING CORP. OF FORT WORTH)
KBFB (97.9 FM; DALLAS, TX; Owner: RADIO ONE LICENSES, LLC)
KSCS (96.3 FM; FORT WORTH, TX; Owner: WBAP-KSCS OPERATING, LTD.)
KLNO (94.1 FM; FORT WORTH, TX; Owner: HBC LICENSE CORPORATION)
KCBI (90.9 FM; DALLAS, TX; Owner: CRISWELL CENTER FOR BIBLICAL STUDIES)
KEOM (88.5 FM; MESQUITE, TX; Owner: MESQUITE INDEPENDENT SCHOOL DISTRICT)
KDGE (102.1 FM; FORT WORTH-DALLAS, TX; Owner: CAPSTAR TX LIMITED PARTNERSHIP)
KDMX (102.9 FM; DALLAS, TX; Owner: CITICASTERS LICENSES, L.P.)
KERA (90.1 FM; DALLAS, TX; Owner: NORTH TEXAS PUBLIC BROADCASTING, INC.)
KESN (103.3 FM; ALLEN, TX; Owner: WBAP-KSCS OPERATING, LTD.)
TV broadcast stations around Richardson:
KLEG-LP (Channel 44; DALLAS, TX; Owner: DILIP VISWANATH)
KLDT (Channel 55; LAKE DALLAS, TX; Owner: JOHNSON BROADCASTING OF DALLAS, INC.)
KJJM-LP (Channel 46; DALLAS/MESQUITE, TX; Owner: JANE McGINNIS)
KTVT (Channel 11; FORT WORTH, TX; Owner: CBS STATIONS GROUP OF TEXAS L.P.)
KXAS-TV (Channel 5; FORT WORTH, TX; Owner: STATION VENTURE OPERATIONS, LP)
KDTN (Channel 2; DENTON, TX; Owner: NORTH TEXAS PUBLIC BROADCASTING, INC.)
KMPX (Channel 29; DECATUR, TX; Owner: WORD OF GOD FELLOWSHIP, INC.)
KTXA (Channel 21; FORT WORTH, TX; Owner: VIACOM TELEVISION STATIONS GROUP OF DALLAS/FORT WORTH L.P.)
KUVN (Channel 23; GARLAND, TX; Owner: KUVN LICENSE PARTNERSHIP, L.P.)
KSTR-TV (Channel 49; IRVING, TX; Owner: TELEFUTURA DALLAS LLC)
KPXD (Channel 68; ARLINGTON, TX; Owner: PAXSON DALLAS LICENSE, INC.)
KERA-TV (Channel 13; DALLAS, TX; Owner: NORTH TEXAS PUBLIC BROADCASTING, INC.)
WFAA-TV (Channel 8; DALLAS, TX; Owner: WFAA-TV, L.P.)
KXTX-TV (Channel 39; DALLAS, TX; Owner: TELEMUNDO OF TEXAS PARTNERSHIP, LP)
KDTX-TV (Channel 58; DALLAS, TX; Owner: TRINITY BROADCASTING OF TEXAS, INC.)
KDFW (Channel 4; DALLAS, TX; Owner: KDFW LICENSE, INC.)
KDAF (Channel 33; DALLAS, TX; Owner: TRIBUNE TELEVISION COMPANY)
KDFI (Channel 27; DALLAS, TX; Owner: NEW DMIC, INC.)
KTAQ (Channel 47; GREENVILLE, TX; Owner: MIKE SIMONS)
K26HF (Channel 26; BRITTON, TX; Owner: MAKO COMMUNICATIONS, LLC)
KHPK-LP (Channel 28; DE SOTO, TX; Owner: MAKO COMMUNICATIONS, LLC)
K25FW (Channel 25; CORSICANA, TX; Owner: VENTANA TELEVISION, INC.)
KATA-LP (Channel 60; MESQUITE, TX; Owner: JANE McGINNIS)
KFWD (Channel 52; FORT WORTH, TX; Owner: HIC BROADCAST, INC.)
KVFW-LP (Channel 65; FORT WORTH, TX; Owner: GERALD BENAVIDES)
National Bridge Inventory (NBI) Statistics 151 Number of bridges3,104ft / 946m Total length $1,242,000 Total costs4,484,097 Total average daily traffic200,142 Total average daily truck traffic
New bridges - historical statistics
2 1950-1959 19 1960-1969 23 1970-1979 21 1980-1989 62 1990-1999 14 2000-2009 10 2010-2019
See full National Bridge Inventory statistics for Richardson, TX
Home Mortgage Disclosure Act Aggregated Statistics For Year 2009(Based on 14 full and 8 partial tracts) A) FHA, FSA/RHS & VA B) Conventional C) Refinancings D) Home Improvement Loans E) Loans on Dwellings For 5+ Families F) Non-occupant Loans on G) Loans On Manufactured Number Average Value Number Average Value Number Average Value Number Average Value Number Average Value Number Average Value Number Average Value
LOANS ORIGINATED 407 $159,565 553 $158,100 1,557 $159,000 73 $55,412 1 $18,418,000 108 $120,472 2 $33,055 APPLICATIONS APPROVED, NOT ACCEPTED 19 $155,103 30 $124,872 117 $142,205 18 $33,779 0 $0 8 $96,901 0 $0 APPLICATIONS DENIED 36 $147,141 59 $123,708 424 $151,637 84 $32,471 1 $236,000 28 $110,954 3 $48,067 APPLICATIONS WITHDRAWN 45 $144,854 68 $154,384 349 $155,921 17 $107,011 0 $0 12 $103,264 0 $0 FILES CLOSED FOR INCOMPLETENESS 3 $138,960 15 $134,987 79 $163,755 3 $22,370 0 $0 10 $112,816 0 $0
Aggregated Statistics For Year 2008(Based on 14 full and 8 partial tracts) A) FHA, FSA/RHS & VA B) Conventional C) Refinancings D) Home Improvement Loans E) Loans on Dwellings For 5+ Families F) Non-occupant Loans on G) Loans On Manufactured Number Average Value Number Average Value Number Average Value Number Average Value Number Average Value Number Average Value Number Average Value
LOANS ORIGINATED 294 $154,659 830 $151,480 671 $146,641 168 $46,086 1 $1,397,000 160 $122,858 3 $24,423 APPLICATIONS APPROVED, NOT ACCEPTED 12 $123,620 88 $148,179 86 $135,713 53 $32,578 1 $1,501,000 10 $105,713 1 $38,000 APPLICATIONS DENIED 25 $142,212 141 $120,627 402 $135,568 178 $40,776 1 $129,780 68 $105,700 4 $48,725 APPLICATIONS WITHDRAWN 31 $158,949 113 $161,188 180 $145,984 23 $77,916 0 $0 30 $105,261 0 $0 FILES CLOSED FOR INCOMPLETENESS 3 $112,440 23 $138,933 46 $144,708 5 $28,398 0 $0 6 $111,312 0 $0
Aggregated Statistics For Year 2007(Based on 14 full and 8 partial tracts) A) FHA, FSA/RHS & VA B) Conventional C) Refinancings D) Home Improvement Loans E) Loans on Dwellings For 5+ Families F) Non-occupant Loans on G) Loans On Manufactured Number Average Value Number Average Value Number Average Value Number Average Value Number Average Value Number Average Value Number Average Value
LOANS ORIGINATED 123 $148,246 1,673 $130,475 691 $140,826 210 $48,844 4 $1,909,735 242 $118,002 1 $36,640 APPLICATIONS APPROVED, NOT ACCEPTED 5 $134,172 236 $118,836 153 $129,608 54 $41,844 0 $0 40 $132,844 6 $63,687 APPLICATIONS DENIED 16 $142,199 255 $118,372 541 $135,690 182 $44,148 0 $0 91 $130,166 6 $45,650 APPLICATIONS WITHDRAWN 17 $151,880 165 $132,325 278 $135,725 30 $63,909 0 $0 31 $111,456 0 $0 FILES CLOSED FOR INCOMPLETENESS 4 $136,600 50 $146,473 102 $154,733 10 $54,057 0 $0 8 $116,050 0 $0
Aggregated Statistics For Year 2006(Based on 14 full and 8 partial tracts) A) FHA, FSA/RHS & VA B) Conventional C) Refinancings D) Home Improvement Loans E) Loans on Dwellings For 5+ Families F) Non-occupant Loans on G) Loans On Manufactured Number Average Value Number Average Value Number Average Value Number Average Value Number Average Value Number Average Value Number Average Value
LOANS ORIGINATED 103 $144,355 2,029 $109,769 721 $126,719 202 $50,693 4 $904,672 286 $105,239 7 $48,677 APPLICATIONS APPROVED, NOT ACCEPTED 4 $130,667 248 $106,035 130 $126,050 61 $36,980 0 $0 47 $94,240 3 $72,807 APPLICATIONS DENIED 11 $137,038 402 $108,349 518 $131,965 192 $46,432 1 $1,950,510 89 $91,751 4 $39,025 APPLICATIONS WITHDRAWN 10 $139,903 270 $111,704 360 $137,324 37 $70,237 0 $0 47 $83,352 1 $105,040 FILES CLOSED FOR INCOMPLETENESS 2 $69,150 48 $125,783 167 $152,883 8 $38,246 0 $0 7 $149,726 0 $0
Aggregated Statistics For Year 2005(Based on 14 full and 8 partial tracts) A) FHA, FSA/RHS & VA B) Conventional C) Refinancings D) Home Improvement Loans E) Loans on Dwellings For 5+ Families F) Non-occupant Loans on G) Loans On Manufactured Number Average Value Number Average Value Number Average Value Number Average Value Number Average Value Number Average Value Number Average Value
LOANS ORIGINATED 131 $132,885 2,151 $107,185 1,214 $122,706 195 $61,030 8 $2,562,602 357 $90,925 7 $54,567 APPLICATIONS APPROVED, NOT ACCEPTED 2 $109,690 255 $106,572 201 $113,252 54 $46,203 0 $0 43 $90,103 1 $65,160 APPLICATIONS DENIED 21 $133,342 394 $106,598 713 $119,758 189 $44,308 1 $551,780 101 $102,265 8 $38,096 APPLICATIONS WITHDRAWN 13 $132,428 266 $121,952 666 $142,918 61 $176,295 0 $0 57 $120,856 2 $149,625 FILES CLOSED FOR INCOMPLETENESS 3 $134,353 55 $108,015 158 $132,248 7 $44,716 0 $0 12 $121,394 1 $41,950
Aggregated Statistics For Year 2004(Based on 14 full and 8 partial tracts) A) FHA, FSA/RHS & VA B) Conventional C) Refinancings D) Home Improvement Loans E) Loans on Dwellings For 5+ Families F) Non-occupant Loans on G) Loans On Manufactured Number Average Value Number Average Value Number Average Value Number Average Value Number Average Value Number Average Value Number Average Value
LOANS ORIGINATED 155 $133,498 1,954 $110,136 1,908 $118,535 204 $49,595 3 $1,291,453 304 $96,351 2 $19,160 APPLICATIONS APPROVED, NOT ACCEPTED 9 $135,110 269 $104,690 289 $114,752 63 $32,132 0 $0 39 $94,193 3 $53,480 APPLICATIONS DENIED 22 $119,782 294 $109,491 946 $119,657 158 $39,004 1 $791,580 78 $85,417 4 $20,685 APPLICATIONS WITHDRAWN 23 $125,120 205 $132,660 854 $123,550 28 $56,182 0 $0 55 $114,610 0 $0 FILES CLOSED FOR INCOMPLETENESS 4 $116,208 67 $110,398 174 $127,441 8 $67,409 0 $0 17 $113,948 0 $0
Aggregated Statistics For Year 2003(Based on 14 full and 8 partial tracts) A) FHA, FSA/RHS & VA B) Conventional C) Refinancings D) Home Improvement Loans E) Loans on Dwellings For 5+ Families F) Non-occupant Loans on Number Average Value Number Average Value Number Average Value Number Average Value Number Average Value Number Average Value
LOANS ORIGINATED 200 $124,057 1,646 $115,221 5,245 $119,534 219 $35,078 6 $3,533,045 365 $91,196 APPLICATIONS APPROVED, NOT ACCEPTED 8 $127,812 155 $105,957 590 $108,301 115 $40,754 0 $0 47 $93,382 APPLICATIONS DENIED 21 $121,974 259 $104,827 1,278 $112,925 165 $26,747 0 $0 93 $98,286 APPLICATIONS WITHDRAWN 24 $118,899 219 $125,953 1,035 $122,251 26 $42,911 0 $0 47 $104,354 FILES CLOSED FOR INCOMPLETENESS 8 $119,642 61 $113,604 157 $118,747 2 $95,770 0 $0 8 $72,186
Aggregated Statistics For Year 2002(Based on 10 full and 6 partial tracts) A) FHA, FSA/RHS & VA B) Conventional C) Refinancings D) Home Improvement Loans E) Loans on Dwellings For 5+ Families F) Non-occupant Loans on Number Average Value Number Average Value Number Average Value Number Average Value Number Average Value Number Average Value
LOANS ORIGINATED 224 $116,626 1,081 $101,390 1,992 $109,965 143 $27,315 1 $635,270 254 $84,815 APPLICATIONS APPROVED, NOT ACCEPTED 2 $103,480 125 $89,093 287 $96,697 68 $31,356 0 $0 33 $77,787 APPLICATIONS DENIED 17 $122,901 159 $77,676 477 $92,497 108 $26,507 0 $0 48 $72,592 APPLICATIONS WITHDRAWN 28 $104,645 107 $102,280 470 $103,445 20 $38,618 0 $0 31 $81,447 FILES CLOSED FOR INCOMPLETENESS 4 $130,010 64 $98,376 101 $108,266 3 $20,333 1 $2,359,900 13 $61,535
Aggregated Statistics For Year 2001(Based on 10 full and 6 partial tracts) A) FHA, FSA/RHS & VA B) Conventional C) Refinancings D) Home Improvement Loans E) Loans on Dwellings For 5+ Families F) Non-occupant Loans on Number Average Value Number Average Value Number Average Value Number Average Value Number Average Value Number Average Value
LOANS ORIGINATED 291 $114,983 1,082 $106,634 1,291 $107,634 186 $26,662 3 $1,374,227 122 $88,717 APPLICATIONS APPROVED, NOT ACCEPTED 6 $68,055 98 $89,837 141 $80,859 84 $24,305 0 $0 20 $56,192 APPLICATIONS DENIED 20 $86,654 268 $62,626 343 $89,140 131 $24,556 0 $0 31 $56,337 APPLICATIONS WITHDRAWN 23 $110,031 124 $106,924 255 $101,802 31 $17,509 0 $0 13 $81,537 FILES CLOSED FOR INCOMPLETENESS 11 $117,755 38 $102,673 74 $101,506 5 $22,808 0 $0 5 $49,194
Aggregated Statistics For Year 2000(Based on 10 full and 6 partial tracts) A) FHA, FSA/RHS & VA B) Conventional C) Refinancings D) Home Improvement Loans E) Loans on Dwellings For 5+ Families F) Non-occupant Loans on Number Average Value Number Average Value Number Average Value Number Average Value Number Average Value Number Average Value
LOANS ORIGINATED 267 $106,993 1,059 $102,067 262 $82,819 186 $25,703 3 $1,526,923 82 $76,507 APPLICATIONS APPROVED, NOT ACCEPTED 11 $118,893 102 $94,177 68 $76,909 74 $25,914 0 $0 5 $45,952 APPLICATIONS DENIED 14 $102,704 181 $75,155 106 $77,155 96 $22,993 0 $0 15 $66,705 APPLICATIONS WITHDRAWN 17 $108,349 104 $107,698 87 $95,891 15 $27,671 0 $0 10 $61,843 FILES CLOSED FOR INCOMPLETENESS 3 $100,907 32 $112,417 51 $89,737 12 $24,546 0 $0 2 $61,295
Aggregated Statistics For Year 1999(Based on 12 full and 9 partial tracts) A) FHA, FSA/RHS & VA B) Conventional C) Refinancings D) Home Improvement Loans E) Loans on Dwellings For 5+ Families F) Non-occupant Loans on Number Average Value Number Average Value Number Average Value Number Average Value Number Average Value Number Average Value
LOANS ORIGINATED 412 $103,672 1,625 $109,178 945 $89,594 308 $25,237 4 $1,627,012 170 $70,122 APPLICATIONS APPROVED, NOT ACCEPTED 14 $95,807 181 $87,175 156 $89,795 118 $20,441 0 $0 27 $62,938 APPLICATIONS DENIED 33 $91,554 272 $86,439 251 $85,885 161 $20,723 0 $0 32 $61,014 APPLICATIONS WITHDRAWN 30 $103,476 157 $123,439 275 $88,165 23 $19,467 1 $9,600,000 14 $57,879 FILES CLOSED FOR INCOMPLETENESS 6 $88,707 39 $120,214 91 $85,154 19 $22,563 0 $0 8 $73,959
Detailed mortgage data for all 22 tracts in Richardson, TX
Private Mortgage Insurance Companies Aggregated Statistics For Year 2009(Based on 14 full and 8 partial tracts) A) Conventional B) Refinancings C) Non-occupant Loans on Number Average Value Number Average Value Number Average Value
LOANS ORIGINATED 121 $186,439 64 $190,530 2 $139,000 APPLICATIONS APPROVED, NOT ACCEPTED 19 $186,169 19 $183,638 1 $153,290 APPLICATIONS DENIED 11 $198,400 9 $168,969 0 $0 APPLICATIONS WITHDRAWN 3 $122,623 4 $170,665 0 $0 FILES CLOSED FOR INCOMPLETENESS 2 $122,500 3 $144,887 1 $126,000
Aggregated Statistics For Year 2008(Based on 14 full and 8 partial tracts) A) Conventional B) Refinancings C) Non-occupant Loans on Number Average Value Number Average Value Number Average Value
LOANS ORIGINATED 277 $172,068 47 $176,149 25 $133,013 APPLICATIONS APPROVED, NOT ACCEPTED 68 $159,244 17 $160,044 17 $130,029 APPLICATIONS DENIED 22 $147,754 2 $138,780 13 $145,540 APPLICATIONS WITHDRAWN 13 $165,520 2 $137,890 3 $136,160 FILES CLOSED FOR INCOMPLETENESS 7 $166,023 2 $170,290 1 $161,480
Aggregated Statistics For Year 2007(Based on 14 full and 8 partial tracts) A) Conventional B) Refinancings C) Non-occupant Loans on Number Average Value Number Average Value Number Average Value
LOANS ORIGINATED 354 $159,035 62 $173,834 33 $105,289 APPLICATIONS APPROVED, NOT ACCEPTED 66 $151,469 19 $169,791 7 $123,106 APPLICATIONS DENIED 5 $190,464 0 $0 0 $0 APPLICATIONS WITHDRAWN 11 $174,913 5 $148,446 0 $0 FILES CLOSED FOR INCOMPLETENESS 0 $0 0 $0 0 $0
Aggregated Statistics For Year 2006(Based on 14 full and 8 partial tracts) A) Conventional B) Refinancings C) Non-occupant Loans on Number Average Value Number Average Value Number Average Value
LOANS ORIGINATED 200 $145,557 25 $160,563 15 $122,429 APPLICATIONS APPROVED, NOT ACCEPTED 19 $145,611 12 $182,830 3 $116,110 APPLICATIONS DENIED 1 $148,940 2 $134,025 0 $0 APPLICATIONS WITHDRAWN 9 $139,447 2 $152,860 1 $121,000 FILES CLOSED FOR INCOMPLETENESS 0 $0 0 $0 0 $0
Aggregated Statistics For Year 2005(Based on 14 full and 8 partial tracts) A) Conventional B) Refinancings C) Non-occupant Loans on Number Average Value Number Average Value Number Average Value
LOANS ORIGINATED 173 $140,714 45 $144,761 17 $101,849 APPLICATIONS APPROVED, NOT ACCEPTED 27 $134,274 18 $144,789 7 $122,603 APPLICATIONS DENIED 1 $210,250 0 $0 1 $149,000 APPLICATIONS WITHDRAWN 2 $185,210 9 $210,673 1 $125,660 FILES CLOSED FOR INCOMPLETENESS 3 $131,687 1 $308,840 0 $0
Aggregated Statistics For Year 2004(Based on 14 full and 8 partial tracts) A) Conventional B) Refinancings C) Non-occupant Loans on Number Average Value Number Average Value Number Average Value
LOANS ORIGINATED 220 $147,109 103 $145,025 37 $112,472 APPLICATIONS APPROVED, NOT ACCEPTED 39 $163,198 39 $158,472 4 $140,400 APPLICATIONS DENIED 3 $169,710 2 $100,655 3 $116,770 APPLICATIONS WITHDRAWN 16 $140,871 5 $146,658 6 $96,108 FILES CLOSED FOR INCOMPLETENESS 2 $176,650 1 $442,600 1 $94,000
Aggregated Statistics For Year 2003(Based on 14 full and 8 partial tracts) A) Conventional B) Refinancings C) Non-occupant Loans on Number Average Value Number Average Value Number Average Value
LOANS ORIGINATED 328 $134,436 254 $156,839 40 $102,672 APPLICATIONS APPROVED, NOT ACCEPTED 49 $130,880 65 $157,182 8 $99,249 APPLICATIONS DENIED 6 $109,790 1 $290,130 1 $183,340 APPLICATIONS WITHDRAWN 17 $117,620 16 $167,475 4 $98,438 FILES CLOSED FOR INCOMPLETENESS 3 $152,243 2 $139,455 0 $0
Aggregated Statistics For Year 2002(Based on 10 full and 6 partial tracts) A) Conventional B) Refinancings C) Non-occupant Loans on Number Average Value Number Average Value Number Average Value
LOANS ORIGINATED 278 $119,684 80 $135,068 30 $91,063 APPLICATIONS APPROVED, NOT ACCEPTED 90 $127,991 25 $124,093 10 $98,772 APPLICATIONS DENIED 16 $108,628 2 $129,095 5 $89,334 APPLICATIONS WITHDRAWN 33 $132,259 8 $112,128 4 $107,805 FILES CLOSED FOR INCOMPLETENESS 16 $117,868 1 $132,950 0 $0
Aggregated Statistics For Year 2001(Based on 10 full and 6 partial tracts) A) Conventional B) Refinancings C) Non-occupant Loans on Number Average Value Number Average Value Number Average Value
LOANS ORIGINATED 277 $126,723 78 $132,007 18 $99,890 APPLICATIONS APPROVED, NOT ACCEPTED 103 $129,687 19 $125,171 9 $118,881 APPLICATIONS DENIED 23 $112,327 4 $103,090 3 $128,567 APPLICATIONS WITHDRAWN 22 $122,322 2 $157,330 3 $72,590 FILES CLOSED FOR INCOMPLETENESS 24 $136,278 0 $0 0 $0
Aggregated Statistics For Year 2000(Based on 10 full and 6 partial tracts) A) Conventional B) Refinancings C) Non-occupant Loans on Number Average Value Number Average Value Number Average Value
LOANS ORIGINATED 283 $119,657 25 $101,344 17 $89,678 APPLICATIONS APPROVED, NOT ACCEPTED 27 $112,467 9 $132,444 4 $66,422 APPLICATIONS DENIED 10 $155,548 1 $124,000 0 $0 APPLICATIONS WITHDRAWN 5 $117,612 1 $144,640 0 $0 FILES CLOSED FOR INCOMPLETENESS 8 $160,656 1 $117,000 0 $0
Aggregated Statistics For Year 1999(Based on 12 full and 8 partial tracts) A) Conventional B) Refinancings C) Non-occupant Loans on Number Average Value Number Average Value Number Average Value
LOANS ORIGINATED 466 $121,159 110 $113,701 25 $88,359 APPLICATIONS APPROVED, NOT ACCEPTED 44 $126,533 38 $108,896 3 $69,390 APPLICATIONS DENIED 19 $121,301 8 $114,228 2 $87,885 APPLICATIONS WITHDRAWN 9 $100,240 9 $128,520 2 $82,790 FILES CLOSED FOR INCOMPLETENESS 11 $116,298 6 $111,070 1 $108,260
Fire-safe hotels and motels in Richardson, Texas:
Red Roof, 13685 N Central Exprwy, Richardson, Texas 75243 Phone: (972) 234-1016, Fax: (214) 260-6047
Wingate By Wyndham Richardson, 1577 Gateway Blvd, Richardson, Texas 75080 Phone: (972) 234-5400, Fax: (888) 377-1204
Radisson Hotel Dallas North At Richardson, 1981 N Central Expy, Richardson, Texas 75080 Phone: (972) 644-4000, Fax: (972) 808-5352
Omni Richardson Hotel, 701 E Campbell Rd, Richardson, Texas 75081 Phone: (972) 231-9600, Fax: (972) 907-2578
Hyatt House Dallas Richardson, 2301 N Central Expy, Richardson, Texas 75080 Phone: (972) 671-8080, Fax: (972) 671-1292
Extended Stay America, 901 E Campbell, Richardson, Texas 75081 Phone: (972) 479-0500, Fax: (972) 231-5066
Hilton Garden Inn, 1001 W President George Bush, Richardson, Texas 75080 Phone: (972) 792-9393, Fax: (972) 792-9494
Springhill Suites, 3251 E President George Bush Hwy, Richardson, Texas 75082 Phone: (972) 479-0300, Fax: (972) 479-0700
6 other hotels and motels
All 14 fire-safe hotels and motels in Richardson, Texas
Most common first names in Richardson, TX among deceased individuals Name Count Lived (average)
Mary 313 79.0 years William 262 73.4 years John 254 72.8 years James 244 73.5 years Robert 219 70.8 years Charles 144 71.0 years Dorothy 129 78.7 years Helen 128 80.0 years Ruth 117 82.6 years George 106 77.0 years
Most common last names in Richardson, TX among deceased individuals Last name Count Lived (average)
Smith 136 78.7 years Williams 80 77.3 years Johnson 73 73.4 years Jones 68 75.7 years Davis 64 78.3 years Brown 61 72.5 years Wilson 52 76.7 years Taylor 51 78.5 years Thompson 51 79.0 years Miller 47 77.8 years
Richardson compared to Texas state average:
Unemployed percentage significantly below state average. Hispanic race population percentage below state average. Median age above state average. Foreign-born population percentage above state average. Number of college students above state average. Percentage of population with a bachelor's degree or higher significantly above state average. Richardson, TX compared to other similar cities: Richardson on our top lists :
#14 on the list of "Top 101 cities with largest percentage of females in occupations: installation, maintenance, and repair occupations (population 50,000+)"
#17 on the list of "Top 101 cities with largest percentage of males in occupations: architecture and engineering occupations (population 50,000+)"
#18 on the list of "Top 101 cities with largest percentage of females in industries: information (population 50,000+)"
#20 on the list of "Top 101 cities with largest percentage of females in occupations: computer and mathematical occupations (population 50,000+)"
#23 on the list of "Top 101 cities with largest percentage of males in occupations: computer and mathematical occupations (population 50,000+)"
#49 on the list of "Top 101 cities with largest percentage of males in industries: professional, scientific, and technical services (population 50,000+)"
#54 on the list of "Top 101 cities with largest percentage of males in occupations: health technologists and technicians (population 50,000+)"
#58 on the list of "Top 101 cities with the hottest summers (population 50,000+)"
#74 on the list of "Top 101 cities that people commute into (largest positive percentage daily daytime population change due to commuting) (population 50,000+)"
#75 on the list of "Top 101 cities with the lowest number of assaults per 100,000 residents (population 50,000+)"
#77 on the list of "Top 101 cities with the largest racial income disparity between any two races with at least 2,000 householders"
#78 on the list of "Top 101 cities with largest percentage of males in occupations: arts, design, entertainment, sports, and media occupations (population 50,000+)"
#82 on the list of "Top 101 cities with the lowest number of arson incidents per 100,000 residents (population 50,000+)"
#89 on the list of "Top 101 cities with the smallest percentage of unmarried partner households (population 50,000+)"
#101 on the list of "Top 101 cities with the most people having Master's or Doctorate degrees (population 50,000+)"
#14 (75081) on the list of "Top 101 zip codes with the most Internet business establishments in 2005"
#3 on the list of "Top 101 counties with the most Evangelical Protestant adherents"
#3 on the list of "Top 101 counties with the most Evangelical Protestant congregations"
#5 on the list of "Top 101 counties with the highest average weight of females"
#6 on the list of "Top 101 counties with the most Mainline Protestant adherents"
#7 on the list of "Top 101 counties with the most Black Protestant congregations"
Top Patent Applicants
Jun Li (71)
Habib Madani (70)
Tiejun J. Xia (69)
Zhouyue Pi (69)
Theodore W. Houston (69)
Young-Han Nam (68)
Zukang Shen (53)
Zeeshan Naseh (46)
Motoyoshi Sekiya (44)
Paparao Palacharla (43)
Total of 4053 patent applications in 2008-2024.


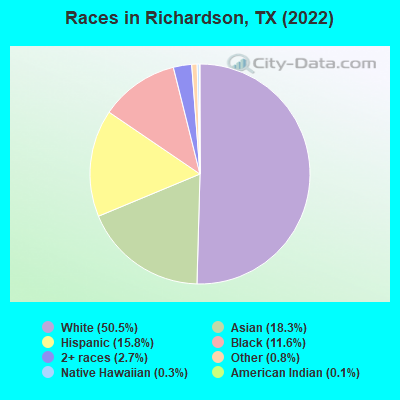
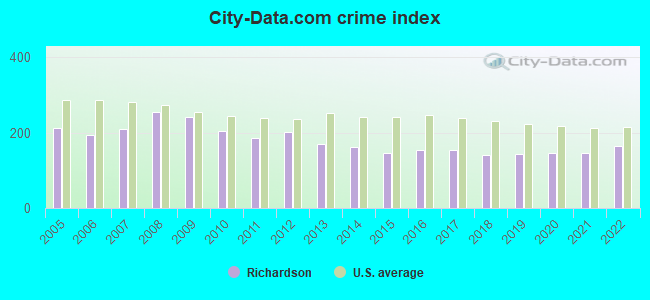
 Recent articles from our blog. Our writers, many of them Ph.D. graduates or candidates, create easy-to-read articles on a wide variety of topics.

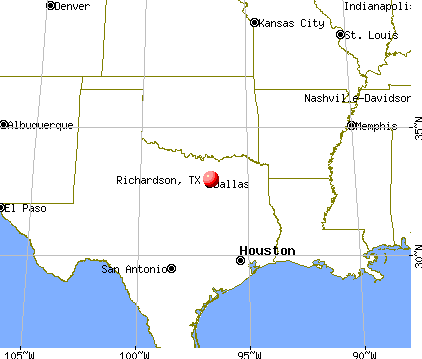
 (6.1 miles
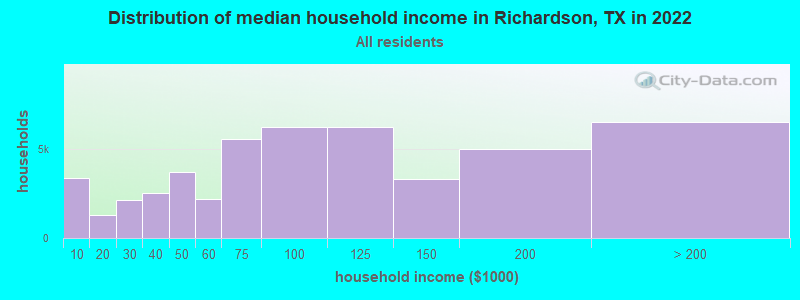
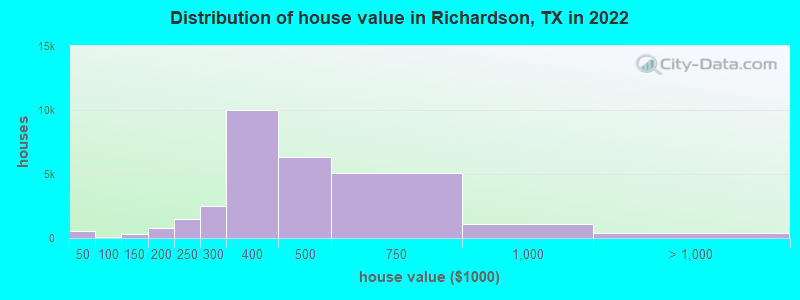
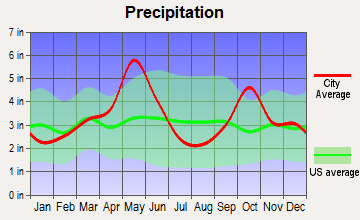
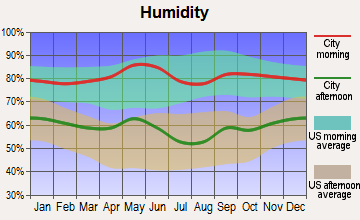
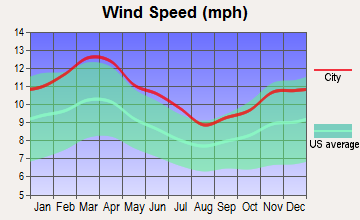
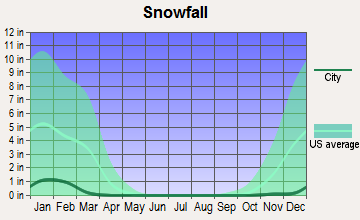
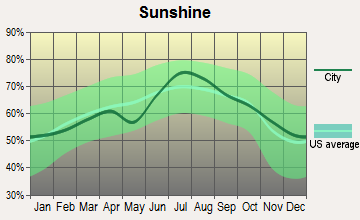
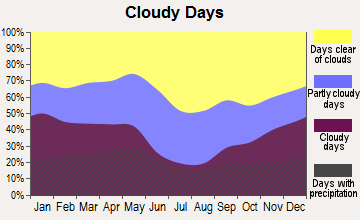


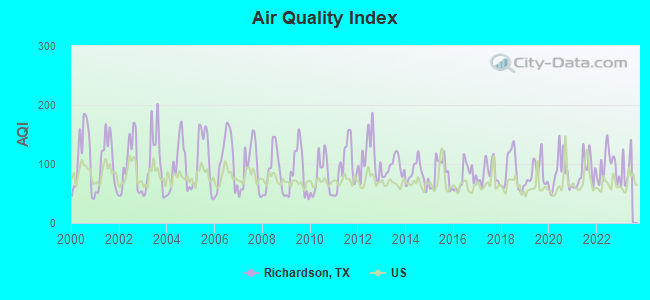
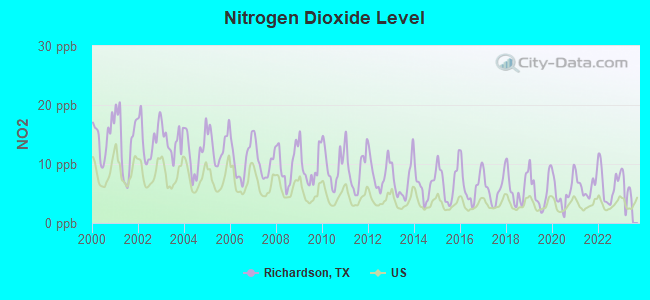
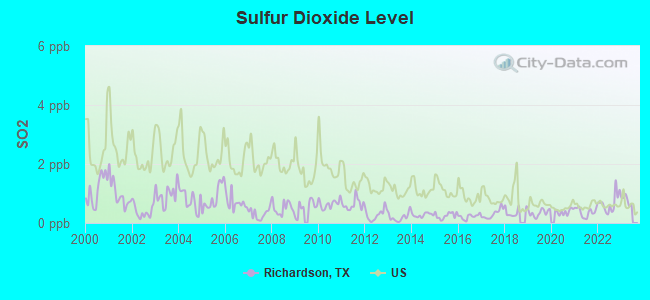
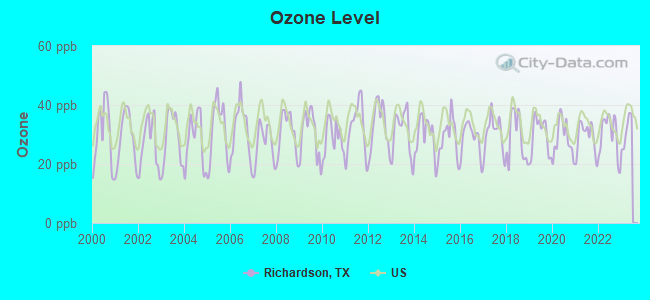
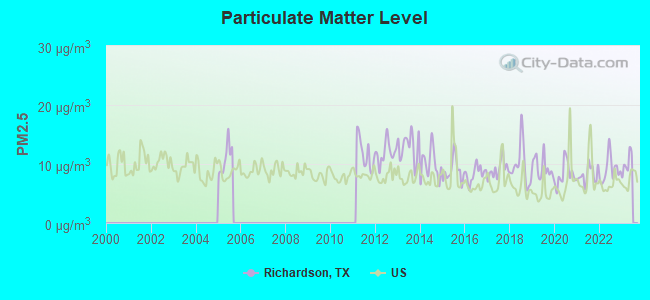
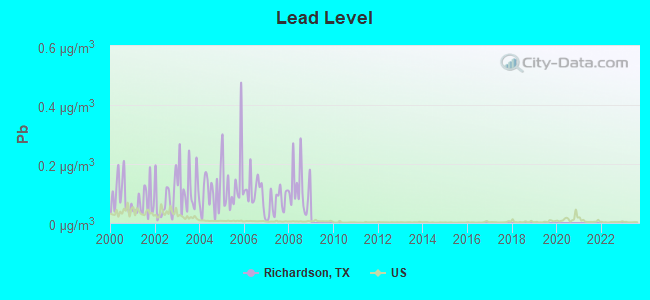

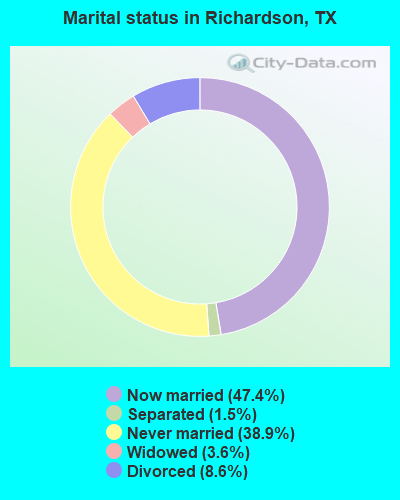
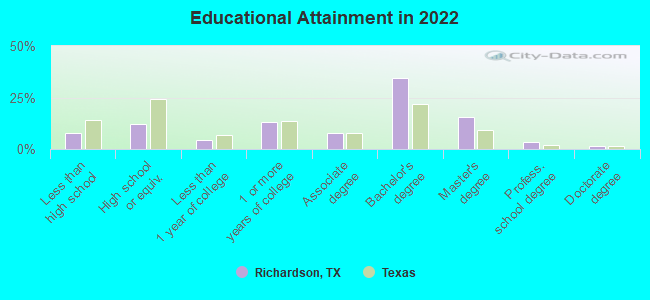
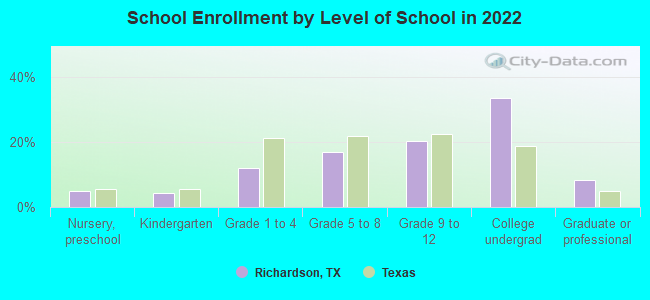
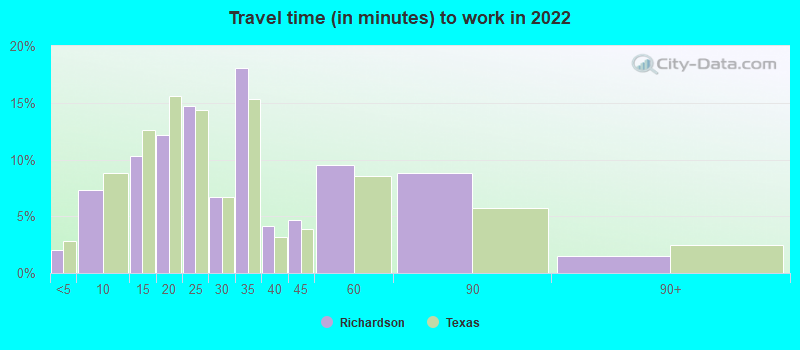
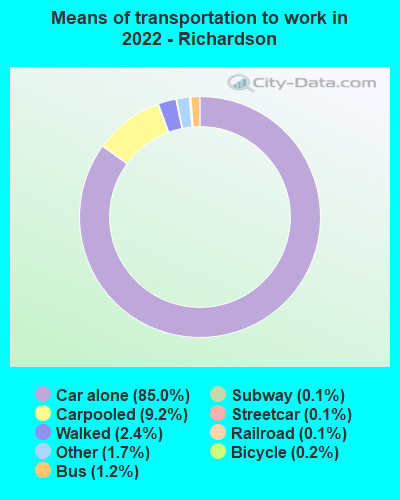
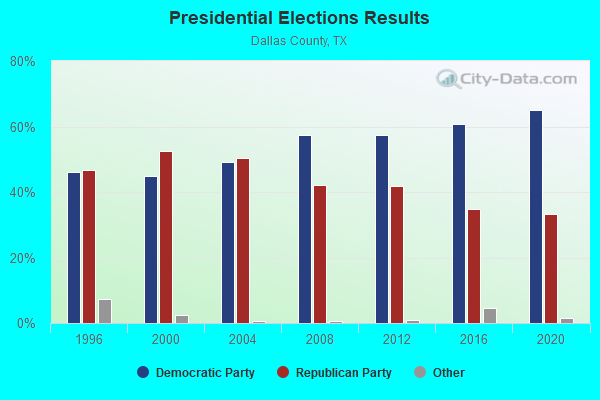
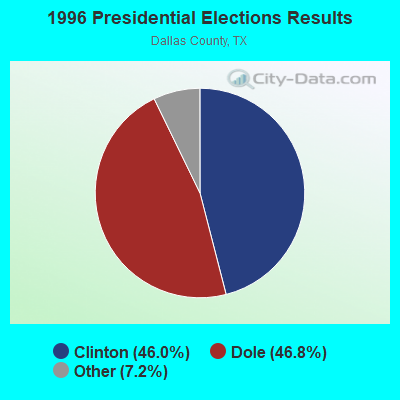
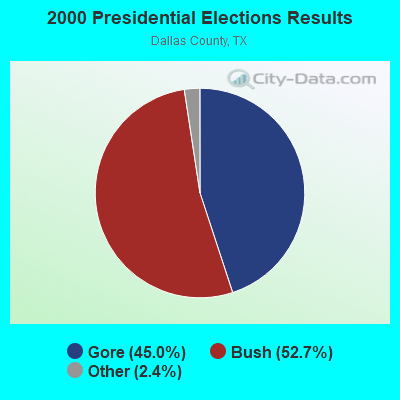
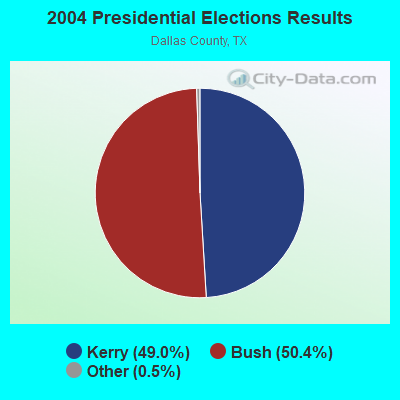
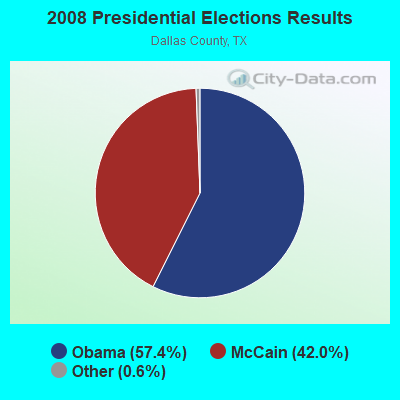

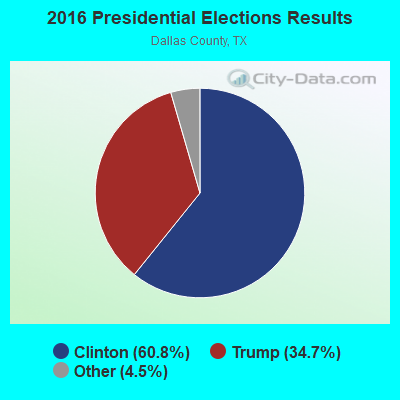
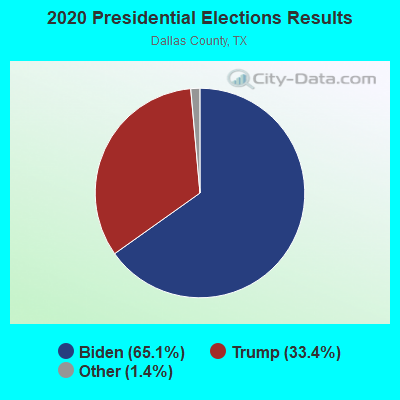
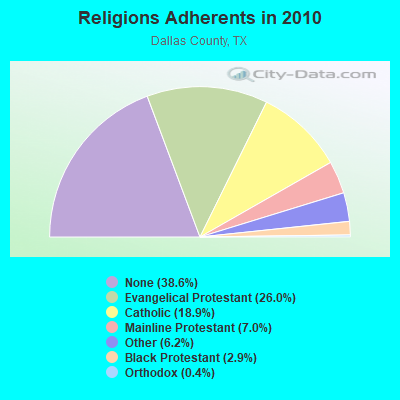
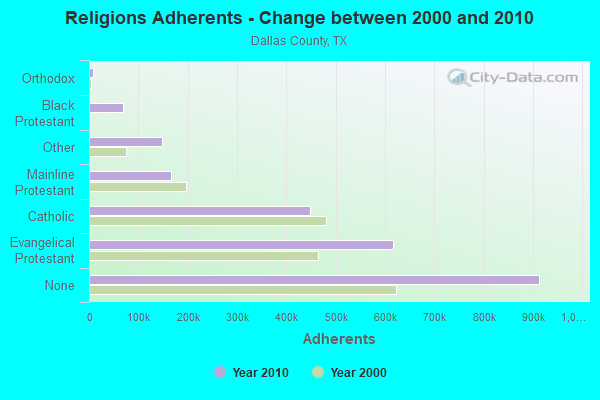
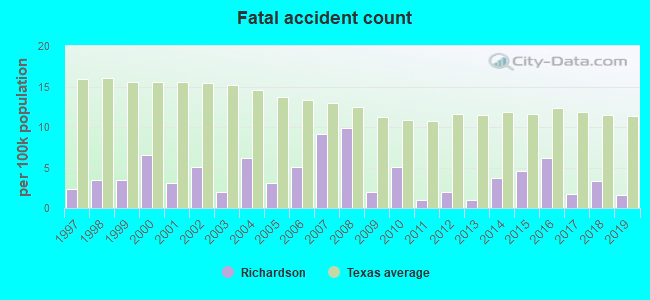
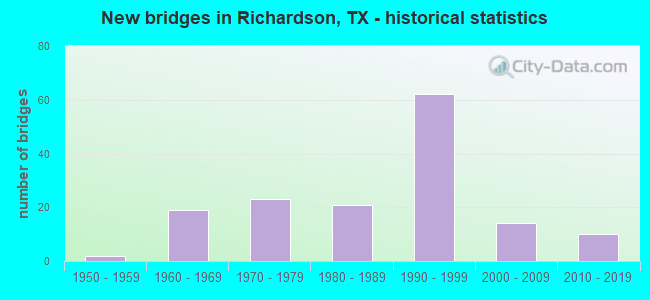
 According to the data from the years 2002 - 2018 the average number of fires per year is 231. The highest number of reported fires - 320 took place in 2005, and the least - 178 in 2016. The data has a decreasing trend.
 When looking into fire subcategories, the most incidents belonged to: Outside Fires (38.8%), and Structure Fires (32.6%).