University Park, Texas
Submit your own pictures of this city and show them to the world
- OSM Map
- General Map
- Google Map
- MSN Map
Population change since 2000: +7.3%
 |
| Males: 12,197 | |
| Females: 12,835 |
| Median resident age: | 33.9 years |
| Texas median age: | 35.6 years |
Zip codes: 75205.
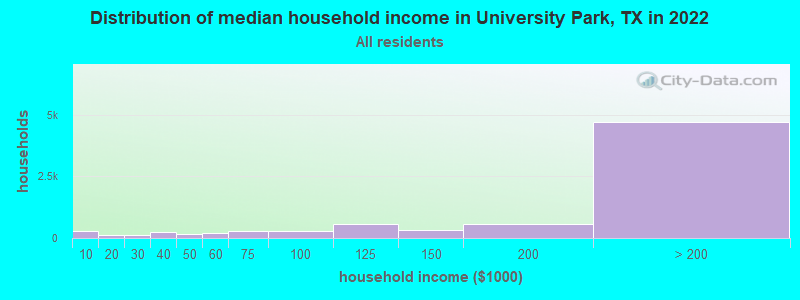
| University Park: | over $200,000 |
| TX: | $72,284 |
Estimated per capita income in 2022: $117,049 (it was $63,414 in 2000)
University Park city income, earnings, and wages data
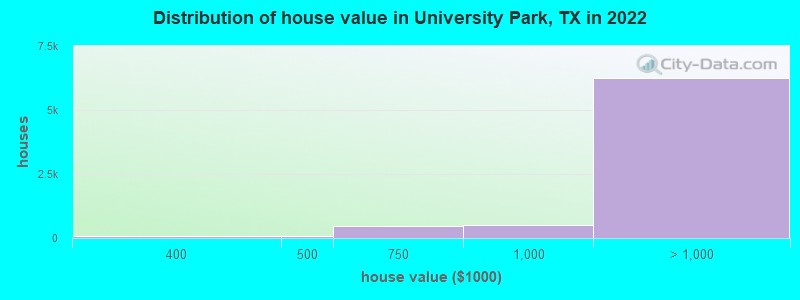
Estimated median house or condo value in 2022: over $1,000,000 (it was $517,300 in 2000)
| University Park: | over $1,000,000 |
| TX: | $275,400 |
Mean prices in 2022: all housing units: over $1,000,000; detached houses: over $1,000,000; townhouses or other attached units: over $1,000,000; in 2-unit structures: $865,655; in 3-to-4-unit structures: $742,209; in 5-or-more-unit structures: $701,858
Median gross rent in 2022: $2,799.
University Park, TX residents, houses, and apartments details
(4.2% for White Non-Hispanic residents, 18.2% for Hispanic or Latino residents, 44.5% for other race residents, 4.7% for two or more races residents)
Detailed information about poverty and poor residents in University Park, TX


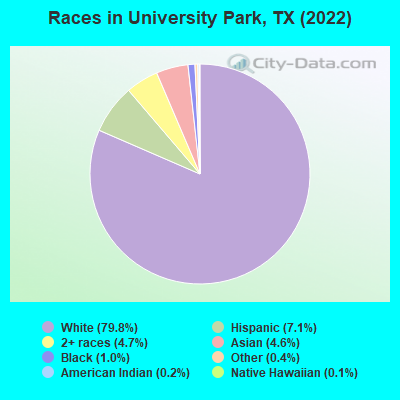
- 20,06979.8%White alone
- 1,7777.1%Hispanic
- 1,1744.7%Two or more races
- 1,1464.6%Asian alone
- 2441.0%Black alone
- 1110.4%Other race alone
- 500.2%American Indian alone
- 270.1%Native Hawaiian and Other
Pacific Islander alone
Races in University Park detailed stats: ancestries, foreign born residents, place of birth
According to our research of Texas and other state lists, there was 1 registered sex offender living in University Park, Texas as of April 27, 2024.
The ratio of all residents to sex offenders in University Park is 24,945 to 1.
The ratio of registered sex offenders to all residents in this city is much lower than the state average.
Type |
2009 |
2010 |
2011 |
2012 |
2013 |
2014 |
2015 |
2016 |
2017 |
2018 |
2019 |
2020 |
2021 |
2022 |
|---|---|---|---|---|---|---|---|---|---|---|---|---|---|---|
| Murders (per 100,000) | 0 (0.0) | 0 (0.0) | 0 (0.0) | 0 (0.0) | 0 (0.0) | 0 (0.0) | 0 (0.0) | 0 (0.0) | 0 (0.0) | 0 (0.0) | 0 (0.0) | 0 (0.0) | 1 (4.0) | 0 (0.0) |
| Rapes (per 100,000) | 1 (4.0) | 0 (0.0) | 0 (0.0) | 2 (8.4) | 2 (8.3) | 1 (4.1) | 0 (0.0) | 1 (4.0) | 5 (19.8) | 1 (3.9) | 1 (3.9) | 1 (4.0) | 3 (12.1) | 2 (8.0) |
| Robberies (per 100,000) | 8 (32.0) | 8 (34.7) | 3 (12.7) | 5 (21.0) | 5 (20.8) | 0 (0.0) | 2 (8.1) | 13 (51.8) | 4 (15.9) | 4 (15.7) | 3 (11.8) | 1 (4.0) | 2 (8.0) | 8 (32.1) |
| Assaults (per 100,000) | 3 (12.0) | 4 (17.3) | 5 (21.2) | 4 (16.8) | 1 (4.2) | 3 (12.4) | 1 (4.0) | 2 (8.0) | 2 (7.9) | 0 (0.0) | 2 (7.9) | 2 (7.9) | 1 (4.0) | 0 (0.0) |
| Burglaries (per 100,000) | 63 (251.7) | 68 (294.8) | 51 (216.5) | 61 (255.9) | 51 (212.2) | 43 (177.5) | 30 (121.3) | 33 (131.5) | 38 (150.7) | 35 (137.2) | 18 (70.8) | 46 (182.2) | 48 (192.9) | 145 (581.9) |
| Thefts (per 100,000) | 332 (1,327) | 344 (1,491) | 257 (1,091) | 359 (1,506) | 228 (948.8) | 253 (1,045) | 245 (990.7) | 253 (1,008) | 257 (1,019) | 247 (968.0) | 137 (538.6) | 161 (637.5) | 228 (916.1) | 157 (630.1) |
| Auto thefts (per 100,000) | 21 (83.9) | 18 (78.0) | 24 (101.9) | 13 (54.5) | 17 (70.7) | 6 (24.8) | 11 (44.5) | 17 (67.7) | 19 (75.3) | 38 (148.9) | 36 (141.5) | 32 (126.7) | 29 (116.5) | 28 (112.4) |
| Arson (per 100,000) | 0 (0.0) | 0 (0.0) | 1 (4.2) | 0 (0.0) | 1 (4.2) | 1 (4.1) | 0 (0.0) | 0 (0.0) | 1 (4.0) | 0 (0.0) | 0 (0.0) | 0 (0.0) | 0 (0.0) | 0 (0.0) |
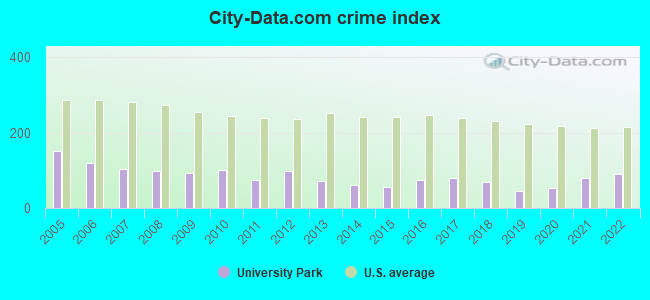
| City-Data.com crime index | 92.6 | 100.4 | 75.0 | 98.9 | 72.2 | 62.0 | 54.9 | 75.2 | 79.5 | 68.1 | 46.1 | 54.3 | 80.4 | 91.0 |
The City-Data.com crime index weighs serious crimes and violent crimes more heavily. Higher means more crime, U.S. average is 246.1. It adjusts for the number of visitors and daily workers commuting into cities.
Crime rate in University Park detailed stats: murders, rapes, robberies, assaults, burglaries, thefts, arson
Full-time law enforcement employees in 2021, including police officers: 54 (38 officers - 29 male; 9 female).
| Officers per 1,000 residents here: | 1.53 |
| Texas average: | 2.07 |
 Recent articles from our blog. Our writers, many of them Ph.D. graduates or candidates, create easy-to-read articles on a wide variety of topics.

 | Southlake ISD vs University Park ISD (85 replies) |
| Why is it that Houston seems to have more of an "energetic vibe" than Dallas? (607 replies) |
| The DFW housing market is NOT sustainable (685 replies) |
| The University Park Village Shopping Center is Iconic Retail Hidden in Plain Sight (7 replies) |
| 2024 National Merit Semifinalists (144 replies) |
| DFW locals are priced out (147 replies) |
Latest news from University Park, TX collected exclusively by city-data.com from local newspapers, TV, and radio stations
Ancestries: English (19.4%), American (16.1%), German (7.0%), Irish (5.2%), Italian (4.1%), European (3.1%).
Current Local Time: CST time zone
Elevation: 550 feet
Land area: 3.72 square miles.
Population density: 6,728 people per square mile (high).
1,579 residents are foreign born (3.1% Asia, 1.4% Europe, 1.2% Latin America).
| This city: | 6.3% |
| Texas: | 17.1% |
Median real estate property taxes paid for housing units with mortgages in 2022: $11,034 (0.5%)
Median real estate property taxes paid for housing units with no mortgage in 2022: $10,542 (0.6%)
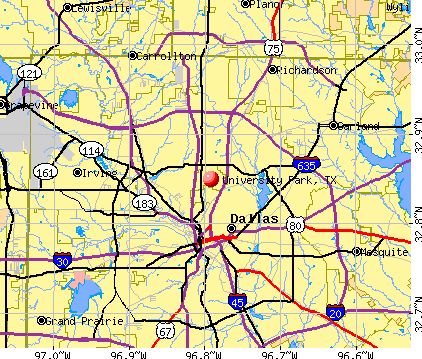
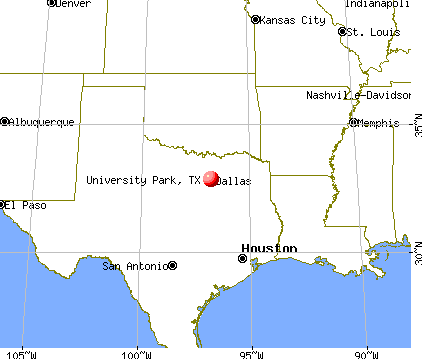
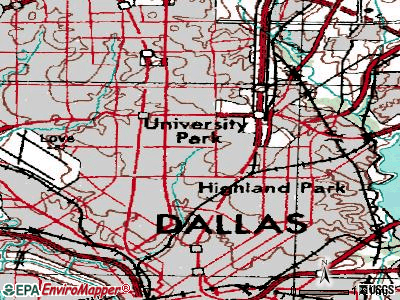
Nearest city with pop. 50,000+: Dallas, TX  (3.5 miles , pop. 1,188,580).
Nearest cities:
Latitude: 32.85 N, Longitude: 96.79 W
Daytime population change due to commuting: +1,953 (+7.8%)
Workers who live and work in this city: 3,477 (32.3%)
University Park, Texas accommodation & food services, waste management - Economy and Business Data
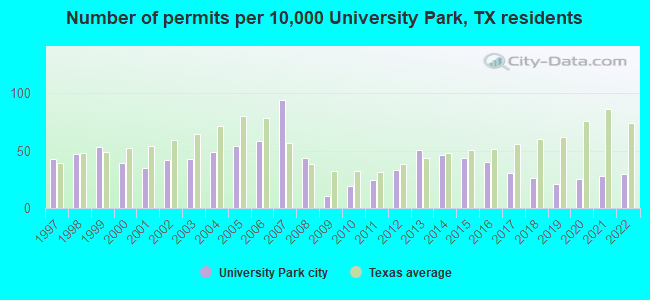
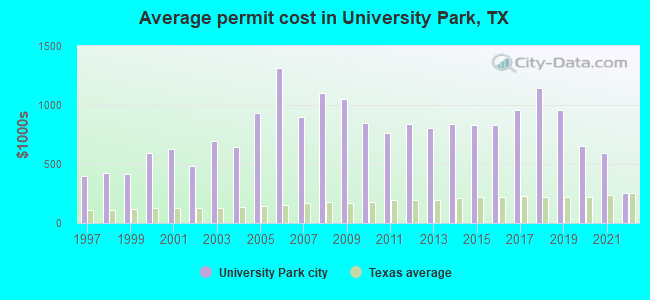
Single-family new house construction building permits:
- 2022: 69 buildings, average cost: $256,200
- 2021: 64 buildings, average cost: $594,800
- 2020: 58 buildings, average cost: $648,800
- 2019: 48 buildings, average cost: $961,400
- 2018: 61 buildings, average cost: $1,140,500
- 2017: 72 buildings, average cost: $953,900
- 2016: 93 buildings, average cost: $831,400
- 2015: 102 buildings, average cost: $832,300
- 2014: 107 buildings, average cost: $836,500
- 2013: 118 buildings, average cost: $807,000
- 2012: 77 buildings, average cost: $835,100
- 2011: 56 buildings, average cost: $764,600
- 2010: 44 buildings, average cost: $845,600
- 2009: 24 buildings, average cost: $1,054,000
- 2008: 102 buildings, average cost: $1,103,500
- 2007: 220 buildings, average cost: $902,400
- 2006: 136 buildings, average cost: $1,311,900
- 2005: 125 buildings, average cost: $933,500
- 2004: 114 buildings, average cost: $641,600
- 2003: 99 buildings, average cost: $695,400
- 2002: 97 buildings, average cost: $483,600
- 2001: 82 buildings, average cost: $629,200
- 2000: 92 buildings, average cost: $590,300
- 1999: 123 buildings, average cost: $416,600
- 1998: 110 buildings, average cost: $421,700
- 1997: 100 buildings, average cost: $396,700
| Here: | 3.0% |
| Texas: | 3.5% |
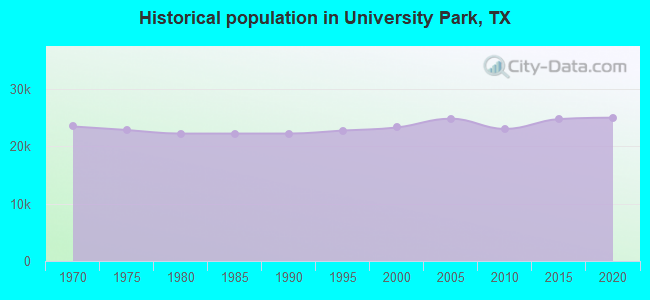
Population change in the 1990s: +997 (+4.5%).
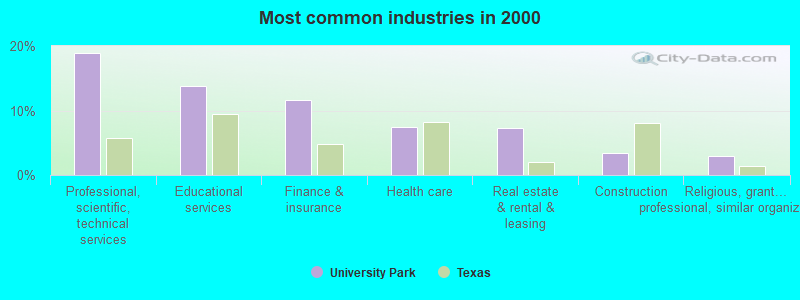
- Professional, scientific, technical services (19.0%)
- Educational services (13.8%)
- Finance & insurance (11.6%)
- Health care (7.4%)
- Real estate & rental & leasing (7.2%)
- Construction (3.4%)
- Religious, grantmaking, civic, professional, similar organizations (3.0%)
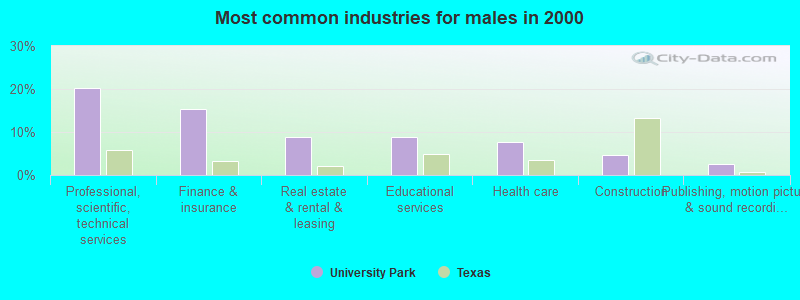
- Professional, scientific, technical services (20.2%)
- Finance & insurance (15.4%)
- Real estate & rental & leasing (8.9%)
- Educational services (8.8%)
- Health care (7.8%)
- Construction (4.7%)
- Publishing, motion picture & sound recording industries (2.5%)
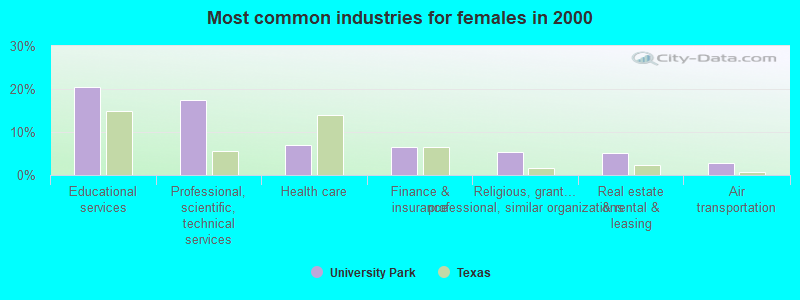
- Educational services (20.5%)
- Professional, scientific, technical services (17.4%)
- Health care (7.0%)
- Finance & insurance (6.4%)
- Religious, grantmaking, civic, professional, similar organizations (5.4%)
- Real estate & rental & leasing (5.1%)
- Air transportation (2.9%)
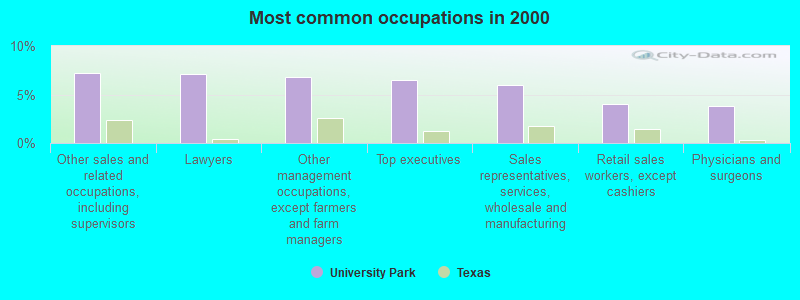
- Other sales and related occupations, including supervisors (7.2%)
- Lawyers (7.1%)
- Other management occupations, except farmers and farm managers (6.8%)
- Top executives (6.5%)
- Sales representatives, services, wholesale and manufacturing (5.9%)
- Retail sales workers, except cashiers (4.0%)
- Physicians and surgeons (3.8%)
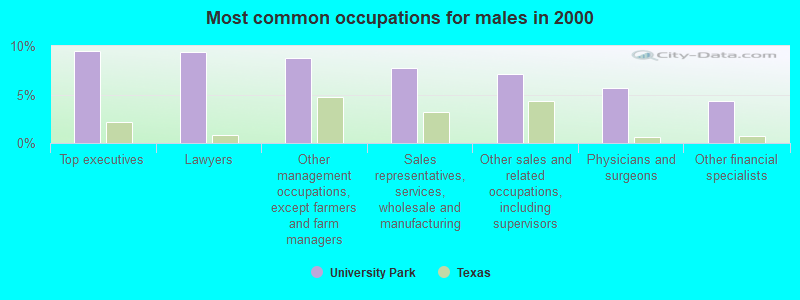
- Top executives (9.5%)
- Lawyers (9.3%)
- Other management occupations, except farmers and farm managers (8.7%)
- Sales representatives, services, wholesale and manufacturing (7.8%)
- Other sales and related occupations, including supervisors (7.1%)
- Physicians and surgeons (5.7%)
- Other financial specialists (4.3%)
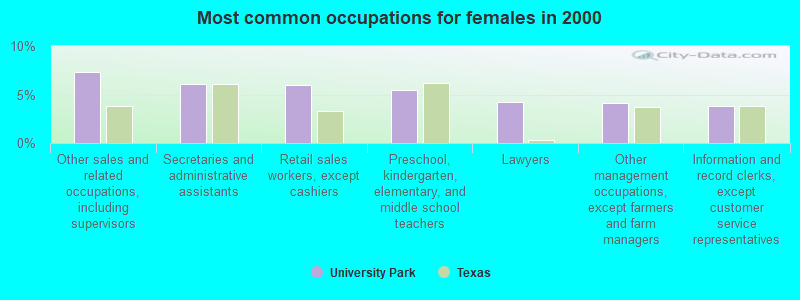
- Other sales and related occupations, including supervisors (7.3%)
- Secretaries and administrative assistants (6.1%)
- Retail sales workers, except cashiers (6.0%)
- Preschool, kindergarten, elementary, and middle school teachers (5.4%)
- Lawyers (4.2%)
- Other management occupations, except farmers and farm managers (4.1%)
- Information and record clerks, except customer service representatives (3.9%)
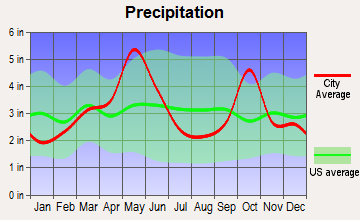
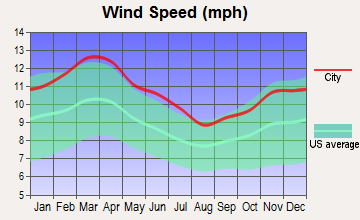
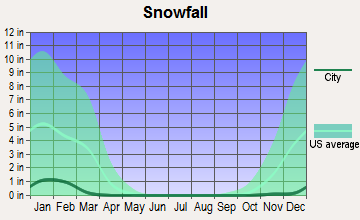
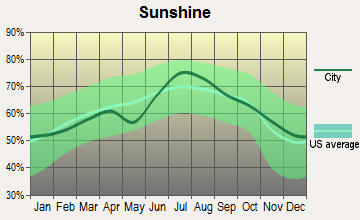
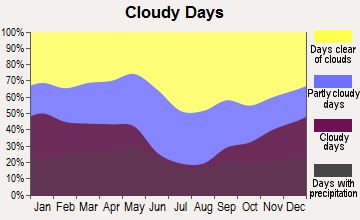
Average climate in University Park, Texas
Based on data reported by over 4,000 weather stations


|
|

(lower is better)
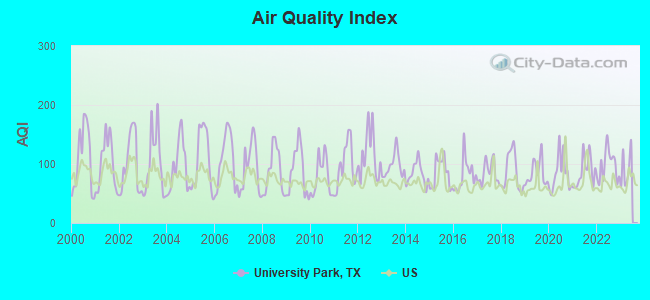
Air Quality Index (AQI) level in 2022 was 97.3. This is worse than average.
| City: | 97.3 |
| U.S.: | 72.6 |
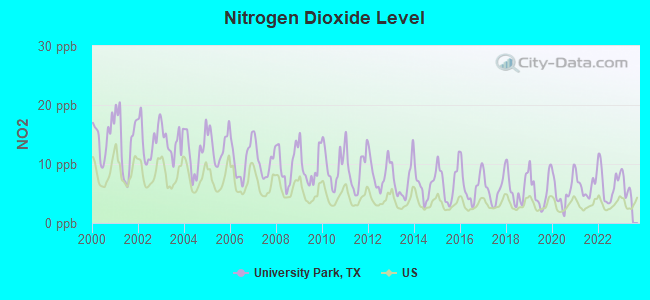
Nitrogen Dioxide (NO2) [ppb] level in 2022 was 6.56. This is worse than average. Closest monitor was 4.5 miles away from the city center.
| City: | 6.56 |
| U.S.: | 5.11 |
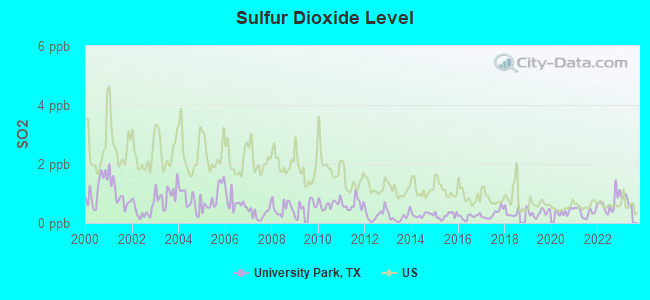
Sulfur Dioxide (SO2) [ppb] level in 2022 was 0.679. This is significantly better than average. Closest monitor was 4.5 miles away from the city center.
| City: | 0.679 |
| U.S.: | 1.515 |
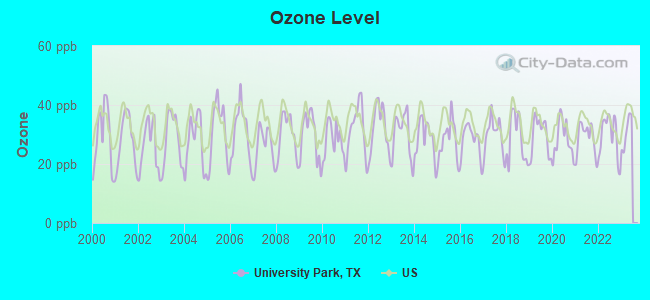
Ozone [ppb] level in 2022 was 29.6. This is about average. Closest monitor was 4.5 miles away from the city center.
| City: | 29.6 |
| U.S.: | 33.3 |
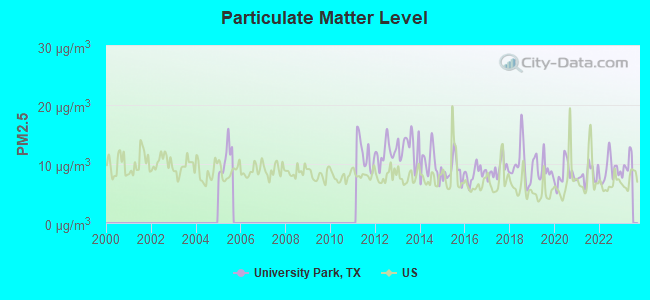
Particulate Matter (PM2.5) [µg/m3] level in 2022 was 8.95. This is about average. Closest monitor was 4.5 miles away from the city center.
| City: | 8.95 |
| U.S.: | 8.11 |
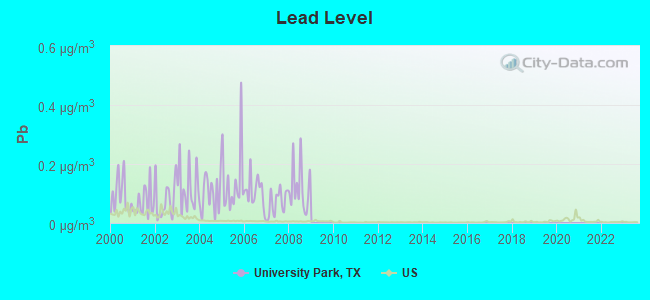
Lead (Pb) [µg/m3] level in 2008 was 0.121. This is significantly worse than average. Closest monitor was 2.7 miles away from the city center.
| City: | 0.121 |
| U.S.: | 0.009 |
Tornado activity:
University Park-area historical tornado activity is above Texas state average. It is 155% greater than the overall U.S. average.
On 4/25/1994, a category F4 (max. wind speeds 207-260 mph) tornado 14.3 miles away from the University Park city center killed 3 people and injured 48 people and caused between $50,000,000 and $500,000,000 in damages.
On 4/2/1957, a category F3 (max. wind speeds 158-206 mph) tornado 2.2 miles away from the city center killed 10 people and injured 200 people and caused between $500,000 and $5,000,000 in damages.
Earthquake activity:
University Park-area historical earthquake activity is significantly above Texas state average. It is 473% greater than the overall U.S. average.On 11/6/2011 at 03:53:10, a magnitude 5.7 (5.7 MW, Depth: 3.2 mi, Class: Moderate, Intensity: VI - VII) earthquake occurred 185.5 miles away from University Park center
On 9/3/2016 at 12:02:44, a magnitude 5.8 (5.8 MW, Depth: 3.5 mi) earthquake occurred 247.4 miles away from University Park center
On 6/16/1978 at 11:46:54, a magnitude 5.3 (4.4 MB, 4.6 UK, 5.3 ML) earthquake occurred 231.0 miles away from the city center
On 5/17/2012 at 08:12:00, a magnitude 4.8 (4.8 MW, Depth: 3.1 mi, Class: Light, Intensity: IV - V) earthquake occurred 155.3 miles away from the city center
On 11/7/2016 at 01:44:24, a magnitude 5.0 (5.0 MW, Depth: 2.8 mi) earthquake occurred 217.3 miles away from the city center
On 11/8/2011 at 02:46:57, a magnitude 4.8 (4.8 MW, Depth: 3.1 mi) earthquake occurred 185.5 miles away from University Park center
Magnitude types: body-wave magnitude (MB), local magnitude (ML), moment magnitude (MW)
Natural disasters:
The number of natural disasters in Dallas County (21) is greater than the US average (15).Major Disasters (Presidential) Declared: 9
Emergencies Declared: 10
Causes of natural disasters: Hurricanes: 7, Storms: 7, Floods: 5, Tornadoes: 5, Fires: 4, Winds: 2, Flash Flood: 1, Winter Storm: 1, Other: 2 (Note: some incidents may be assigned to more than one category).
Hospitals and medical centers near University Park:
- PARK CITIES SURGERY CENTER (Hospital, about 1 miles away; DALLAS, TX)
- JENYS HEALTHCARE INC (Home Health Center, about 2 miles away; DALLAS, TX)
- THE PLAZA AT EDGEMERE HEALTH CARE (Nursing Home, about 2 miles away; DALLAS, TX)
- GIRLING HEALTH CARE INC (Home Health Center, about 2 miles away; DALLAS, TX)
- LION HOSPICE INC (Hospital, about 2 miles away; DALLAS, TX)
- HEALTHCARE CENTER AT THE FORUM AT PARK LANE (Nursing Home, about 2 miles away; DALLAS, TX)
- NORTH CENTRAL SURGICAL CENTER LLP Acute Care Hospitals (about 3 miles away; DALLAS, TX)
Amtrak station near University Park:
Colleges/universities with over 2000 students nearest to University Park:
- Southern Methodist University (about 1 miles; Dallas, TX; Full-time enrollment: 9,150)
- El Centro College (about 5 miles; Dallas, TX; FT enrollment: 6,086)
- Richland College (about 7 miles; Dallas, TX; FT enrollment: 11,617)
- Brookhaven College (about 7 miles; Farmers Branch, TX; FT enrollment: 6,868)
- University of Dallas (about 8 miles; Irving, TX; FT enrollment: 2,192)
- Eastfield College (about 9 miles; Mesquite, TX; FT enrollment: 8,323)
- The University of Texas at Dallas (about 11 miles; Richardson, TX; FT enrollment: 16,777)
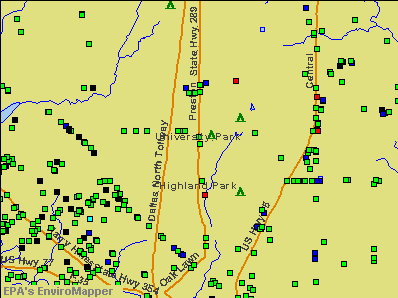
Points of interest:
Notable locations in University Park: Fred Florence Hall (A), Hyer Hall (B), McFarlin Memorial Auditorium (C), University Park Fire Department (D), Meadows Museum (E), Dallas Hall (F), Clements Hall (G), Perkins Hall of Administration (H), Virginia Hall (I), Stanley Patterson Hall (J), Snider Hall (K). Display/hide their locations on the map
Churches in University Park include: Saint Michael and All Angels Church (A), Prestoncrest Church of Christ (B), Preston Road Church of Christ (C), Christ Lutheran Church (D), Westminster Church (E), Highland Park Presbyterian Church (F), Park Cities Church (G). Display/hide their locations on the map
Parks in University Park include: Williams Park (1), Goar Park (2), Smith Park (3), Curtis Park (4), Caruth Park (5), Burleson Park (6), Northcrest Park (7), Haggar Tennis Stadium (8), Morrison-Bell Track Stadium (9). Display/hide their locations on the map
| This city: | 2.8 people |
| Texas: | 2.8 people |
| This city: | 73.7% |
| Whole state: | 69.9% |
| This city: | 1.8% |
| Whole state: | 6.0% |
Likely homosexual households (counted as self-reported same-sex unmarried-partner households)
- Lesbian couples: 0.2% of all households
- Gay men: 0.2% of all households
2,565 people in college dormitories (includes college quarters off campus) in 2000
For population 15 years and over in University Park:
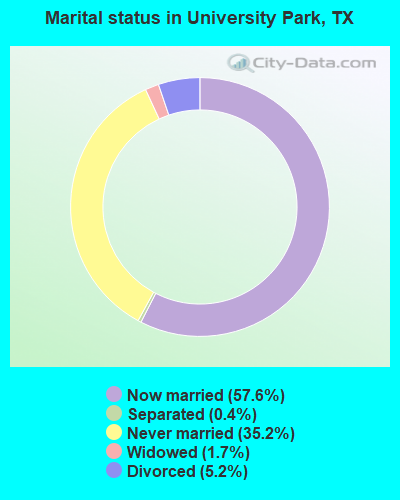
- Never married: 35.2%
- Now married: 57.6%
- Separated: 0.4%
- Widowed: 1.7%
- Divorced: 5.2%
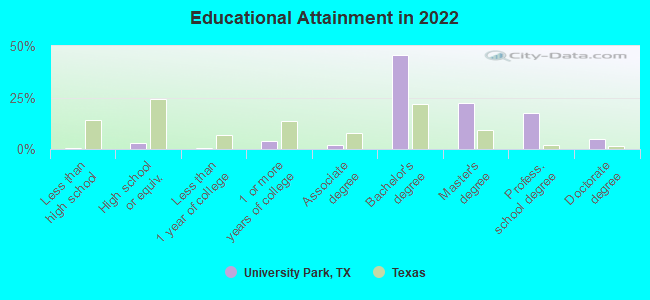
For population 25 years and over in University Park:
- High school or higher: 99.2%
- Bachelor's degree or higher: 89.1%
- Graduate or professional degree: 42.9%
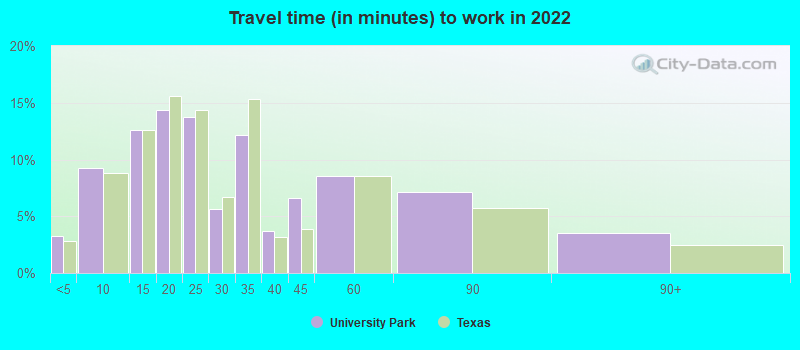
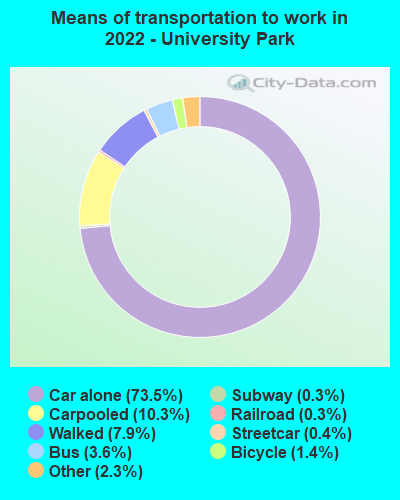
- Unemployed: 2.3%
- Mean travel time to work (commute): 14.2 minutes
| Here: | 7.1 |
| Texas average: | 14.0 |
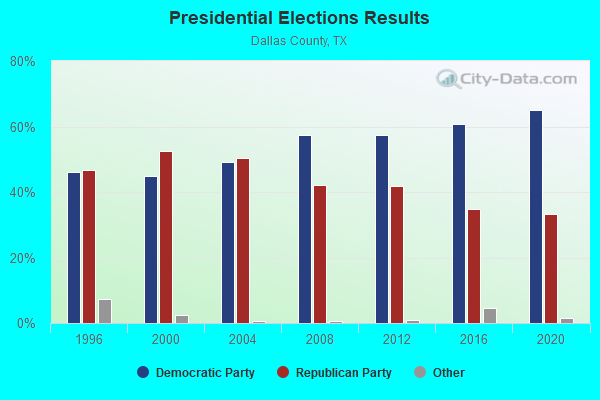
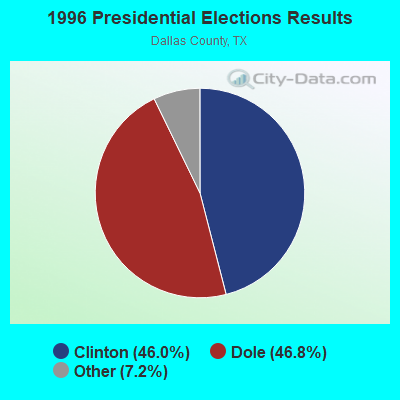
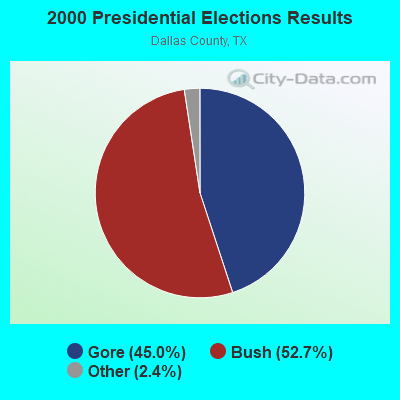
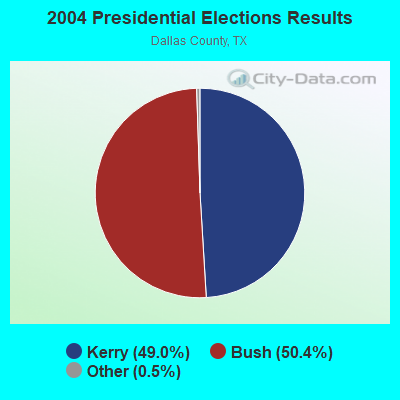
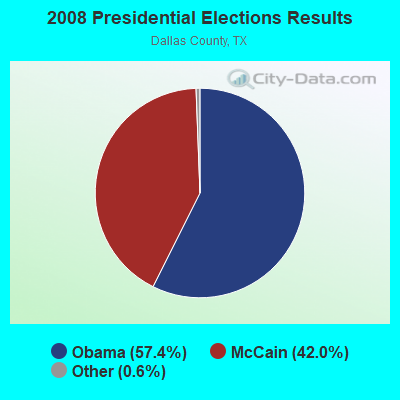

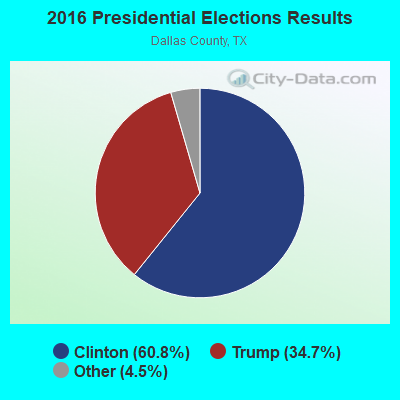
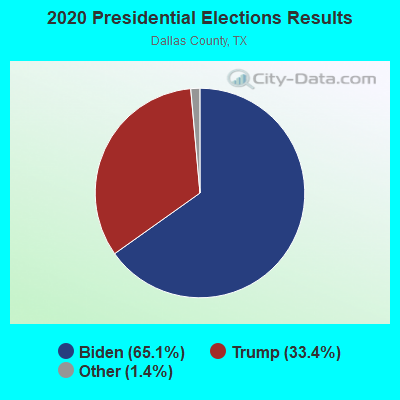
Graphs represent county-level data. Detailed 2008 Election Results
Political contributions by individuals in University Park, TX
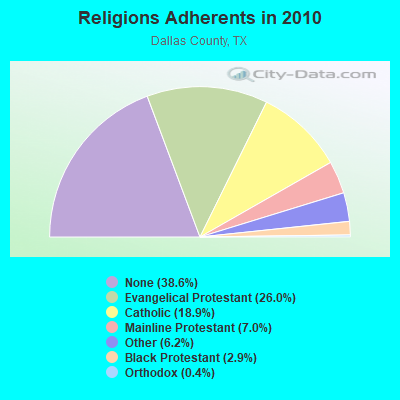
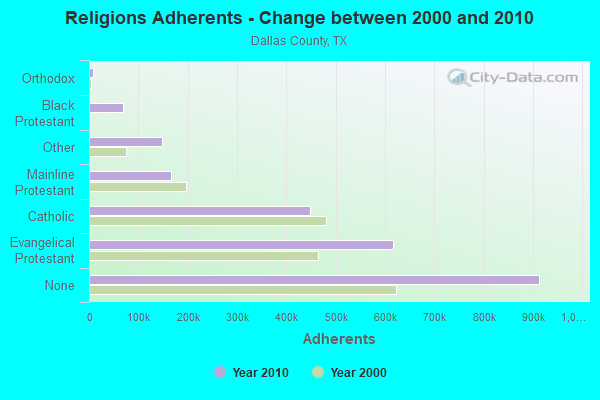
Religion statistics for University Park, TX (based on Dallas County data)
| Religion | Adherents | Congregations |
|---|---|---|
| Evangelical Protestant | 615,849 | 1,672 |
| Catholic | 446,996 | 57 |
| Mainline Protestant | 166,224 | 240 |
| Other | 147,445 | 174 |
| Black Protestant | 69,831 | 174 |
| Orthodox | 8,813 | 19 |
| None | 912,981 | - |
Food Environment Statistics:
| Here: | 1.64 / 10,000 pop. |
| Texas: | 1.47 / 10,000 pop. |
| This county: | 0.10 / 10,000 pop. |
| State: | 0.14 / 10,000 pop. |
| Dallas County: | 1.15 / 10,000 pop. |
| Texas: | 1.11 / 10,000 pop. |
| This county: | 2.82 / 10,000 pop. |
| State: | 3.95 / 10,000 pop. |
| Dallas County: | 6.73 / 10,000 pop. |
| Texas: | 6.13 / 10,000 pop. |
| This county: | 8.8% |
| Texas: | 8.9% |
| Dallas County: | 27.1% |
| Texas: | 26.6% |
| Dallas County: | 17.0% |
| State: | 15.7% |
Health and Nutrition:
| This city: | 58.1% |
| Texas: | 48.6% |
| This city: | 62.0% |
| Texas: | 47.4% |
| This city: | 27.4 |
| Texas: | 28.5 |
| University Park: | 17.7% |
| Texas: | 20.6% |
| This city: | 6.7% |
| Texas: | 10.3% |
| Here: | 7.0 |
| Texas: | 6.8 |
| Here: | 32.0% |
| State: | 33.1% |
| This city: | 66.0% |
| State: | 56.2% |
| University Park: | 83.6% |
| Texas: | 80.7% |
More about Health and Nutrition of University Park, TX Residents
| Local government employment and payroll (March 2022) | |||||
| Function | Full-time employees | Monthly full-time payroll | Average yearly full-time wage | Part-time employees | Monthly part-time payroll |
|---|---|---|---|---|---|
| Police Protection - Officers | 59 | $534,956 | $108,805 | 0 | $0 |
| Other and Unallocable | 48 | $358,387 | $89,597 | 0 | $0 |
| Firefighters | 39 | $398,410 | $122,588 | 0 | $0 |
| Solid Waste Management | 31 | $151,949 | $58,819 | 0 | $0 |
| Sewerage | 31 | $186,458 | $72,177 | 0 | $0 |
| Parks and Recreation | 24 | $167,668 | $83,834 | 0 | $0 |
| Streets and Highways | 19 | $100,863 | $63,703 | 0 | $0 |
| Other Government Administration | 7 | $81,880 | $140,366 | 0 | $0 |
| Financial Administration | 7 | $55,833 | $95,714 | 0 | $0 |
| Judicial and Legal | 5 | $27,284 | $65,482 | 0 | $0 |
| Local Libraries | 5 | $17,009 | $40,822 | 4 | $6,304 |
| Fire - Other | 1 | $7,695 | $92,340 | 0 | $0 |
| Police - Other | 0 | $0 | 7 | $5,910 | |
| Totals for Government | 276 | $2,088,391 | $90,800 | 11 | $12,214 |
University Park government finances - Expenditure in 2017 (per resident):
- Construction - Regular Highways: $4,443,000 ($177.49)
Water Utilities: $1,422,000 ($56.81)
General - Other: $846,000 ($33.80)
- Current Operations - Water Utilities: $7,647,000 ($305.49)
Police Protection: $7,196,000 ($287.47)
Local Fire Protection: $6,643,000 ($265.38)
Parks and Recreation: $3,355,000 ($134.03)
Central Staff Services: $3,190,000 ($127.44)
Solid Waste Management: $2,968,000 ($118.57)
Financial Administration: $2,510,000 ($100.27)
Sewerage: $2,023,000 ($80.82)
Regular Highways: $1,742,000 ($69.59)
General - Other: $787,000 ($31.44)
General Public Buildings: $594,000 ($23.73)
Judicial and Legal Services: $375,000 ($14.98)
- General - Interest on Debt: $20,307,000 ($811.24)
- Intergovernmental to Local - Other - Sewerage: $2,072,000 ($82.77)
- Other Capital Outlay - Central Staff Services: $223,000 ($8.91)
General Public Building: $42,000 ($1.68)
Local Fire Protection: $34,000 ($1.36)
Water Utilities: $14,000 ($0.56)
Parks and Recreation: $6,000 ($0.24)
- Total Salaries and Wages: $17,697,000 ($706.98)
University Park government finances - Revenue in 2017 (per resident):
- Charges - Sewerage: $5,154,000 ($205.90)
Solid Waste Management: $2,861,000 ($114.29)
Other: $1,803,000 ($72.03)
Parks and Recreation: $320,000 ($12.78)
- Miscellaneous - Interest Earnings: $20,680,000 ($826.14)
Fines and Forfeits: $800,000 ($31.96)
General Revenue - Other: $387,000 ($15.46)
Donations From Private Sources: $134,000 ($5.35)
- Revenue - Water Utilities: $9,885,000 ($394.89)
- State Intergovernmental - General Local Government Support: $196,000 ($7.83)
- Tax - Property: $17,531,000 ($700.34)
General Sales and Gross Receipts: $4,050,000 ($161.79)
Public Utilities Sales: $2,087,000 ($83.37)
Other License: $1,405,000 ($56.13)
University Park government finances - Debt in 2017 (per resident):
- Long Term Debt - Outstanding Nonguaranteed - Industrial Revenue: $640,880,000 ($25602.43)
Beginning Outstanding - Public Debt for Private Purpose: $532,555,000 ($21274.97)
Issue, Nonguaranteed - Public Debt for Private Purpose: $143,795,000 ($5744.45)
Retired Nonguaranteed - Public Debt for Private Purpose: $35,470,000 ($1416.99)
University Park government finances - Cash and Securities in 2017 (per resident):
- Other Funds - Cash and Securities: $54,306,000 ($2169.46)
- Sinking Funds - Cash and Securities: $640,880,000 ($25602.43)
7.50% of this county's 2021 resident taxpayers lived in other counties in 2020 ($78,710 average adjusted gross income)
| Here: | 7.50% |
| Texas average: | 8.12% |
0.01% of residents moved from foreign countries ($115 average AGI)
Dallas County: 0.01% Texas average: 0.04%
Top counties from which taxpayers relocated into this county between 2020 and 2021:
| from Tarrant County, TX | |
| from Collin County, TX | |
| from Denton County, TX |
8.56% of this county's 2020 resident taxpayers moved to other counties in 2021 ($74,660 average adjusted gross income)
| Here: | 8.56% |
| Texas average: | 7.40% |
0.02% of residents moved to foreign countries ($227 average AGI)
Dallas County: 0.02% Texas average: 0.03%
Top counties to which taxpayers relocated from this county between 2020 and 2021:
| to Tarrant County, TX | |
| to Collin County, TX | |
| to Denton County, TX |
Businesses in University Park, TX
- 7-Eleven: 1
- Safeway: 1
- Vons: 1
Strongest AM radio stations in University Park:
- KRLD (1080 AM; 50 kW; DALLAS, TX; Owner: TEXAS INFINITY BROADCASTING L.P.)
- KSKY (660 AM; 20 kW; BALCH SPRINGS, TX; Owner: BISON MEDIA, INC.)
- KBIS (1150 AM; 25 kW; HIGHLAND PARK, TX; Owner: DALLAS AM RADIO PARTNERS, L.P.)
- KZMP (1540 AM; 50 kW; UNIVERSITY PARK, TX; Owner: ENTRAVISION HOLDINGS, LLC)
- KGGR (1040 AM; daytime; 5 kW; DALLAS, TX; Owner: MORTENSON BROADCASTING COMPANY)
- KFXR (1190 AM; 50 kW; DALLAS, TX; Owner: CLEAR CHANNEL BROADCASTING LICENSES, INC.)
- WBAP (820 AM; 50 kW; FORT WORTH, TX; Owner: WBAP-KSCS OPERATING, LTD.)
- KESS (1270 AM; 50 kW; FORT WORTH, TX; Owner: KESS-AM LICENSE CORP.)
- KTCK (1310 AM; 9 kW; DALLAS, TX; Owner: KRBE LICO, INC.)
- KLIF (570 AM; 5 kW; DALLAS, TX; Owner: KLIF LICO, INC.)
- KRVA (1600 AM; 5 kW; COCKRELL HILL, TX; Owner: ENTRAVISION HOLDINGS, LLC)
- KAAM (770 AM; 10 kW; GARLAND, TX; Owner: DONTRON, INC.)
- KAHZ (1360 AM; 50 kW; HURST, TX)
Strongest FM radio stations in University Park:
- WRR (101.1 FM; DALLAS, TX; Owner: CITY OF DALLAS, TEXAS)
- KLUV-FM (98.7 FM; DALLAS, TX; Owner: INFINITY BROADCASTING CORPORATION OF DALLAS)
- KPLX (99.5 FM; FORT WORTH, TX; Owner: KPLX LICO, INC.)
- KLLI (105.3 FM; DALLAS, TX; Owner: INFINITY BROADCASTING CORPORATION OF DALLAS)
- KVIL-FM (103.7 FM; HIGHLAND PARK-DALLAS, TX; Owner: INFINITY BROADCASTING CORPORATION OF TEXAS)
- KHKS (106.1 FM; DENTON, TX; Owner: AMFM TEXAS LICENSES LIMITED PARTNERSHIP)
- KZPS (92.5 FM; DALLAS, TX; Owner: AMFM TEXAS LICENSES LIMITED PARTNERSHIP)
- KOAI (107.5 FM; FORT WORTH, TX; Owner: INFINITY KOAI-FM, INC.)
- KEGL (97.1 FM; FORT WORTH, TX; Owner: CITICASTERS LICENSES, L.P.)
- KKDA-FM (104.5 FM; DALLAS, TX; Owner: SERVICE BROADCASTING I, LTD.)
- KBFB (97.9 FM; DALLAS, TX; Owner: RADIO ONE LICENSES, LLC)
- KSCS (96.3 FM; FORT WORTH, TX; Owner: WBAP-KSCS OPERATING, LTD.)
- KLNO (94.1 FM; FORT WORTH, TX; Owner: HBC LICENSE CORPORATION)
- KRBV (100.3 FM; DALLAS, TX; Owner: INFINITY BROADCASTING CORP. OF FORT WORTH)
- KCBI (90.9 FM; DALLAS, TX; Owner: CRISWELL CENTER FOR BIBLICAL STUDIES)
- KDBN (93.3 FM; HALTOM CITY, TX; Owner: TEXAS STAR RADIO, INC.)
- K213BP (90.5 FM; IRVING, TX; Owner: CSN INTERNATIONAL)
- KDGE (102.1 FM; FORT WORTH-DALLAS, TX; Owner: CAPSTAR TX LIMITED PARTNERSHIP)
- KEOM (88.5 FM; MESQUITE, TX; Owner: MESQUITE INDEPENDENT SCHOOL DISTRICT)
- KDMX (102.9 FM; DALLAS, TX; Owner: CITICASTERS LICENSES, L.P.)
TV broadcast stations around University Park:
- KLEG-LP (Channel 44; DALLAS, TX; Owner: DILIP VISWANATH)
- KLDT (Channel 55; LAKE DALLAS, TX; Owner: JOHNSON BROADCASTING OF DALLAS, INC.)
- KJJM-LP (Channel 46; DALLAS/MESQUITE, TX; Owner: JANE McGINNIS)
- KTVT (Channel 11; FORT WORTH, TX; Owner: CBS STATIONS GROUP OF TEXAS L.P.)
- KXAS-TV (Channel 5; FORT WORTH, TX; Owner: STATION VENTURE OPERATIONS, LP)
- KDTN (Channel 2; DENTON, TX; Owner: NORTH TEXAS PUBLIC BROADCASTING, INC.)
- KMPX (Channel 29; DECATUR, TX; Owner: WORD OF GOD FELLOWSHIP, INC.)
- KTXA (Channel 21; FORT WORTH, TX; Owner: VIACOM TELEVISION STATIONS GROUP OF DALLAS/FORT WORTH L.P.)
- KUVN (Channel 23; GARLAND, TX; Owner: KUVN LICENSE PARTNERSHIP, L.P.)
- KSTR-TV (Channel 49; IRVING, TX; Owner: TELEFUTURA DALLAS LLC)
- KPXD (Channel 68; ARLINGTON, TX; Owner: PAXSON DALLAS LICENSE, INC.)
- KERA-TV (Channel 13; DALLAS, TX; Owner: NORTH TEXAS PUBLIC BROADCASTING, INC.)
- WFAA-TV (Channel 8; DALLAS, TX; Owner: WFAA-TV, L.P.)
- KXTX-TV (Channel 39; DALLAS, TX; Owner: TELEMUNDO OF TEXAS PARTNERSHIP, LP)
- KDTX-TV (Channel 58; DALLAS, TX; Owner: TRINITY BROADCASTING OF TEXAS, INC.)
- KDFW (Channel 4; DALLAS, TX; Owner: KDFW LICENSE, INC.)
- KDAF (Channel 33; DALLAS, TX; Owner: TRIBUNE TELEVISION COMPANY)
- KDFI (Channel 27; DALLAS, TX; Owner: NEW DMIC, INC.)
- K26HF (Channel 26; BRITTON, TX; Owner: MAKO COMMUNICATIONS, LLC)
- KHPK-LP (Channel 28; DE SOTO, TX; Owner: MAKO COMMUNICATIONS, LLC)
- K25FW (Channel 25; CORSICANA, TX; Owner: VENTANA TELEVISION, INC.)
- KATA-LP (Channel 60; MESQUITE, TX; Owner: JANE McGINNIS)
- KVFW-LP (Channel 65; FORT WORTH, TX; Owner: GERALD BENAVIDES)
- KFWD (Channel 52; FORT WORTH, TX; Owner: HIC BROADCAST, INC.)
- KTAQ (Channel 47; GREENVILLE, TX; Owner: MIKE SIMONS)
- National Bridge Inventory (NBI) Statistics
- 8Number of bridges
- 49ft / 14.9mTotal length
- $31,000Total costs
- 598,896Total average daily traffic
- 30,004Total average daily truck traffic
FCC Registered Antenna Towers:
10 (See the full list of FCC Registered Antenna Towers in University Park)FCC Registered Broadcast Land Mobile Towers:
2- Corner Airline Rd & Rosedale Ave (Lat: 32.847917 Lon: -96.784167), Call Sign: KAW863,
Assigned Frequencies: 155.415 MHz, Grant Date: 05/07/2015, Expiration Date: 06/04/2025, Registrant: City Of University Park, Police Department, 3800 University Blvd., University Park, TX 75205, Phone: (214) 987-5351, Fax: (214) 987-5364, Email:
- HYER ES, Lat: 32.859444 Lon: -96.800611, Call Sign: WRBZ775,
Assigned Frequencies: 467.212 MHz, 467.312 MHz, Grant Date: 08/03/2018, Expiration Date: 08/03/2028, Certifier: Ed Levine, Registrant: Innovation Wireless, 11869 Teale St, Culver City, CA 90230, Phone: (888) 559-5565, Fax: (310) 482-3480, Email:
FCC Registered Microwave Towers:
7- NW HWY WATER, 3525 Northwest Highway (Lat: 32.865083 Lon: -96.790333), Type: Tank, Structure height: 48.2 m, Overall height: 48.5 m, Call Sign: WPXQ227,
Assigned Frequencies: 5974.85 MHz, 11485.0 MHz, 11525.0 MHz, 17755.0 MHz, 17885.0 MHz, Grant Date: 03/16/2023, Expiration Date: 05/19/2033, Certifier: David L Ledbetter, Registrant: City Of University Park, 3800 University Blvd., Dallas, TX 75205, Phone: (214) 987-5351, Fax: (214) 987-5384, Email:
- UNIV PARK CT, 3800 University Blvd. (Lat: 32.845861 Lon: -96.797000), Type: Mast, Structure height: 39.6 m, Call Sign: WPXQ237,
Assigned Frequencies: 10995.0 MHz, 19315.0 MHz, 19405.0 MHz, Grant Date: 03/16/2023, Expiration Date: 05/19/2033, Certifier: David L Ledbetter, Registrant: City Of University Park, 3800 University Blvd., Dallas, TX 75205, Phone: (214) 987-5351, Fax: (214) 987-5364, Email:
- FONDREN WTR, 2601 Fondren (Lat: 32.844389 Lon: -96.771306), Type: Tank, Structure height: 53.3 m, Overall height: 53.6 m, Call Sign: WPXQ239,
Assigned Frequencies: 11485.0 MHz, 17795.0 MHz, 17845.0 MHz, Grant Date: 03/08/2023, Expiration Date: 05/19/2033, Certifier: David L Ledbetter, Registrant: City Of University Park, 3800 University Blvd., Dallas, TX 75205, Phone: (214) 987-5351, Fax: (214) 987-5364, Email:
- DA01309A, 3800 University Blvd. (Lat: 32.845861 Lon: -96.797000), Type: Mtower, Structure height: 39.6 m, Call Sign: WQWP599,
Assigned Frequencies: 23225.0 MHz, 23225.0 MHz, 23225.0 MHz, 23225.0 MHz, 23225.0 MHz, 23225.0 MHz, 23225.0 MHz, 23225.0 MHz, Grant Date: 10/20/2015, Expiration Date: 10/20/2025, Cancellation Date: 09/21/2020, Certifier: David Werblow, Registrant: T-Mobile Usa, Inc., 12920 Se 38th Street, Bellevue, WA 98006, Phone: (425) 383-8401, Fax: (425) 383-4040, Email:
- UNIV PARK CT, 3800 University Blvd. (Lat: 32.845861 Lon: -96.797000), Type: Pole, Structure height: 39.6 m, Call Sign: WRFF940, Licensee ID: L00082993,
Assigned Frequencies: 10795.0 MHz, Grant Date: 02/24/2020, Expiration Date: 02/24/2030, Certifier: Kelle Hall, Registrant: Town Of Highland Park, Tx, 4700 Drexel Drive, Highland Park, TX 75205, Phone: (214) 521-5000, Email:
- FONDREN WTR, 2601 Fondren Dr (Lat: 32.844389 Lon: -96.771306), Type: Tank, Structure height: 53.3 m, Overall height: 53.6 m, Call Sign: WRFF943, Licensee ID: L00082993,
Assigned Frequencies: 11445.0 MHz, Grant Date: 02/24/2020, Expiration Date: 02/24/2030, Certifier: Kelle Hall, Registrant: Town Of Highland Park, Tx, 4700 Drexel Drive, Highland Park, TX 75205, Phone: (214) 521-5000, Email:
- STATION, Southern Methodist University Adjacent To Caruth Hall (Lat: 32.842889 Lon: -96.782778), Overall height: 36.6 m, Call Sign: KXV34,
Assigned Frequencies: 12725.0 MHz, 12775.0 MHz, 12825.0 MHz, 12875.0 MHz, Grant Date: 07/22/1999, Expiration Date: 09/29/2009, Cancellation Date: 06/06/2002, Registrant: Dow Lohnes & Albertson, 1200 New Hampshire Avenue Nw Ste 800, Washington, DC 20036, Phone: (202) 776-2000, Fax: (202) 776-2222
FCC Registered Amateur Radio Licenses:
7- Call Sign: N0IVX, Licensee ID: L01400039, Grant Date: 05/16/2008, Expiration Date: 05/16/2018, Cancellation Date: 05/19/2020, Registrant: Daniel F Yaest, 3419 Glanada Ave, University Park, TX 75205
- Call Sign: N5IAG, Licensee ID: L00120517, Grant Date: 02/24/2015, Expiration Date: 05/23/2025, Registrant: Charles A Thompson, 2909 Rosedale Ave, University Park, TX 75205-1532
- Call Sign: N5QOM, Previous Call Sign: KB5LFM, Licensee ID: L00227757, Grant Date: 05/15/2020, Expiration Date: 06/09/2030, Registrant: Carol S Jordan, 3717 Purdue St, University Park, TX 75225-7209
- Call Sign: WB5ZNV, Licensee ID: L00234384, Grant Date: 03/30/2017, Expiration Date: 06/19/2027, Cancellation Date: 11/10/2020, Registrant: Charles W Staples, 4424 Glenwick Ln, University Park, TX 75205-1037
- Call Sign: KD5KJX, Previous Call Sign: KC5PYN, Licensee ID: L00239494, Grant Date: 07/30/1996, Expiration Date: 07/26/2005, Cancellation Date: 12/20/2002, Certifier: David R Hunt Sr, Registrant: David R Hunt Sr, 3005 Rosedale, University Park, TX 75205
- Call Sign: KC9AWV, Licensee ID: L00447110, Grant Date: 10/20/2021, Expiration Date: 01/09/2032, Certifier: Joseph R Kiszka, Registrant: Joseph R Kiszka, 3205 Milton Ave., University Park, TX 75205
- Call Sign: AA5CS, Previous Call Sign: WB5ZNV, Licensee ID: L00234384, Grant Date: 11/10/2020, Expiration Date: 11/10/2030, Certifier: Charles W Staples, Registrant: Charles W Staples, 4424 Glenwick Ln, University Park, TX 75205-1037
FAA Registered Aircraft:
2- Aircraft: PIPER PA-32RT-300T (Category: Land, Seats: 7, Weight: Up to 12,499 Pounds, Speed: 124 mph), Engine: LYCOMING TI0-540 SER (310 HP) (Reciprocating)
N-Number: 21313, N21313, N-21313, Serial Number: 32R-7887200, Year manufactured: 1978, Airworthiness Date: 08/31/1978, Certificate Issue Date: 10/20/1999
Registrant (Individual): Peter Foster, 3924 Bryn Mawr, University Park, TX 75225 - Aircraft: CESSNA 210 (Category: Land, Seats: 4, Weight: Up to 12,499 Pounds, Speed: 141 mph), Engine: CONT MOTOR I0-470 SERIES (260 HP) (Reciprocating)
N-Number: 7395E, N7395E, N-7395E, Serial Number: 57095, Year manufactured: 1959, Airworthiness Date: 01/21/1960, Certificate Issue Date: 07/09/2018
Registrant (Individual): John M Cox, 3733 Purdue, University Park, TX 75225
2002 - 2018 National Fire Incident Reporting System (NFIRS) incidents
- Fire incident types reported to NFIRS in University Park, TX
- 27240.1%Structure Fires
- 26739.4%Outside Fires
- 9213.6%Mobile Property/Vehicle Fires
- 476.9%Other
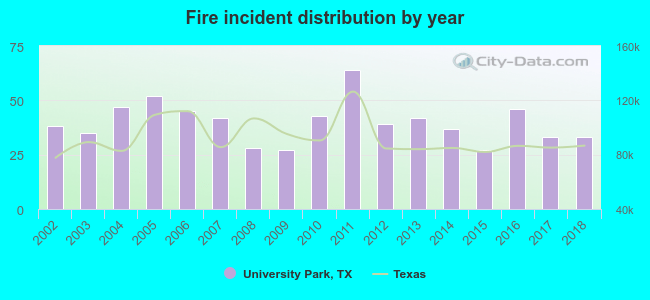 Based on the data from the years 2002 - 2018 the average number of fire incidents per year is 40. The highest number of reported fire incidents - 64 took place in 2011, and the least - 27 in 2009. The data has a dropping trend.
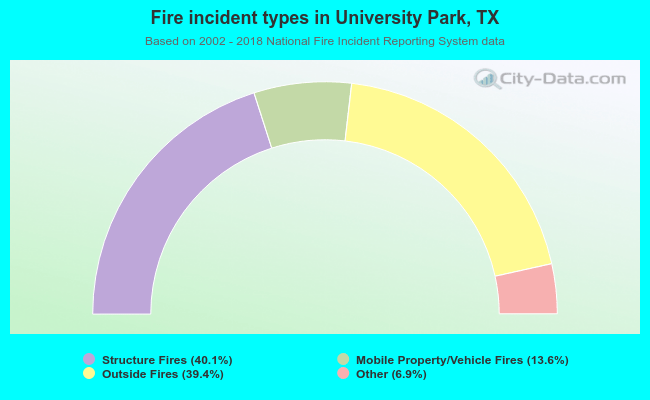 When looking into fire subcategories, the most incidents belonged to: Structure Fires (40.1%), and Outside Fires (39.4%).
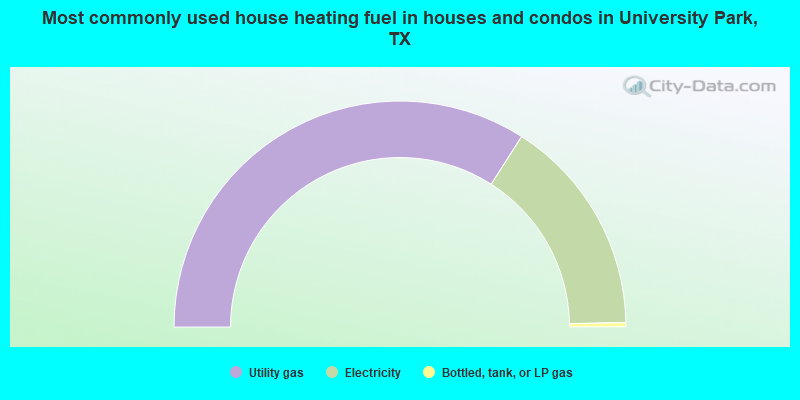
- 68.1%Utility gas
- 31.3%Electricity
- 0.6%Bottled, tank, or LP gas
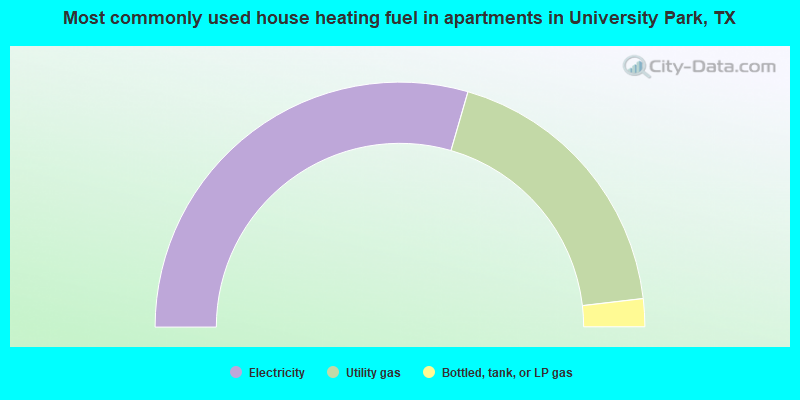
- 58.9%Electricity
- 37.3%Utility gas
- 3.7%Bottled, tank, or LP gas
University Park compared to Texas state average:
- Median household income significantly above state average.
- Median house value significantly above state average.
- Unemployed percentage significantly below state average.
- Black race population percentage significantly below state average.
- Hispanic race population percentage significantly below state average.
- Foreign-born population percentage significantly below state average.
- Renting percentage below state average.
- Number of rooms per house significantly above state average.
- House age above state average.
- Number of college students above state average.
- Percentage of population with a bachelor's degree or higher significantly above state average.
University Park on our top lists:
- #4 on the list of "Top 100 cities with highest median household income and median resident age less than 35"
- #27 on the list of "Top 101 cities with largest percentage of males in occupations: legal occupations (population 5,000+)"
- #39 on the list of "Top 100 cities with highest median household income (pop. 5,000+)"
- #41 on the list of "Top 100 high-educated but low-earning cities (pop. 5,000+)"
- #48 on the list of "Top 101 cities with largest percentage of males in industries: finance and insurance (population 5,000+)"
- #55 on the list of "Top 100 best educated cities (highest percentage of bachelor degree holding residents)"
- #57 on the list of "Top 100 cities with highest median house value (pop. 5,000+)"
- #58 on the list of "Top 101 cities with the highest cost per building permit(population 5,000+)"
- #58 on the list of "Top 101 cities with largest percentage of males in industries: real estate and rental and leasing (population 5,000+)"
- #94 on the list of "Top 101 cities with largest percentage of males in occupations: management occupations (population 5,000+)"
- #95 on the list of "Top 101 cities with the most residents born in Other Southern Europe (population 500+)"
- #23 (75205) on the list of "Top 101 zip codes with the highest 2012 average taxable interest for individuals (pop 5,000+)"
- #25 (75205) on the list of "Top 101 zip codes with the highest 2012 average reported profit/loss from business (pop 5,000+)"
- #40 (75205) on the list of "Top 101 zip codes with the highest 2012 average Adjusted Gross Income (AGI) for individuals (pop 5,000+)"
- #44 (75205) on the list of "Top 101 zip codes with the highest 2012 average net capital gain/loss (pop 5,000+)"
- #63 (75205) on the list of "Top 101 zip codes with the highest average reported salary/wage in 2012 (pop 5,000+)"
- #3 on the list of "Top 101 counties with the most Evangelical Protestant adherents"
- #3 on the list of "Top 101 counties with the most Evangelical Protestant congregations"
- #5 on the list of "Top 101 counties with the highest average weight of females"
- #6 on the list of "Top 101 counties with the most Mainline Protestant adherents"
- #7 on the list of "Top 101 counties with the most Black Protestant congregations"

|
|
Total of 87 patent applications in 2008-2024.