Estimated zip code population in 2022: 53,587 Zip code population in 2010: 44,009 Zip code population in 2000: 43,285
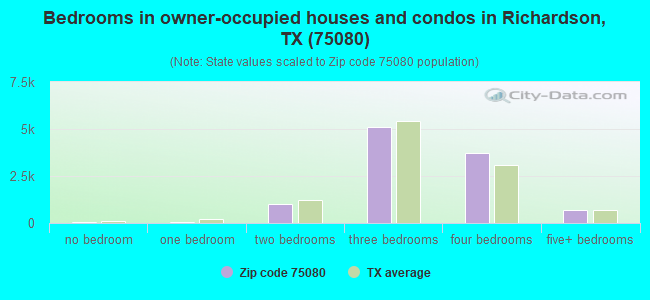
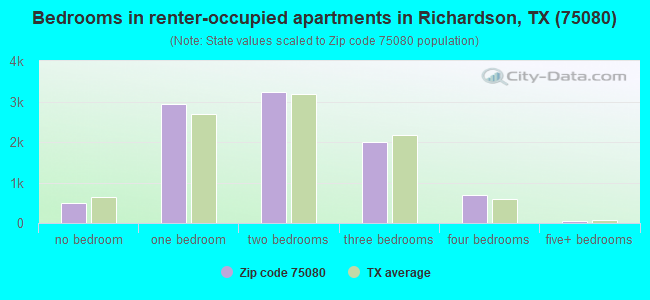
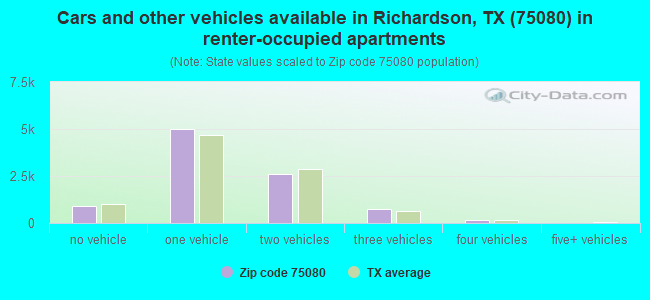
Houses and condos: 21,139 Renter-occupied apartments: 9,397
% of renters here:
47%
State:
38%
March 2022 cost of living index in zip code 75080: 97.5 (near average, U.S. average is 100)
Land area: 11.4 sq. mi. Water area: 0.0 sq. mi.
Population density: 4,689 people per square mile
(average).
OSM Map
General Map
Google Map
MSN Map
OSM Map
General Map
Google Map
MSN Map
OSM Map
General Map
Google Map
MSN Map
OSM Map
General Map
Google Map
MSN Map
Please wait while loading the map...
Real estate property taxes paid for housing units in 2022:
This zip code:
1.4% ($6,435)
Texas:
1.5% ($4,050)
Median real estate property taxes paid for housing units with mortgages in 2022: $7,725 (1.6%) Median real estate property taxes paid for housing units with no mortgage in 2022: $4,951 (1.2%)
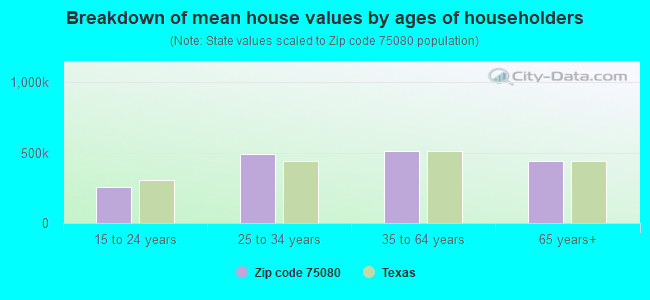
Estimated median house/condo value in 2022: $447,351
75080:
$447,351
Texas:
$275,400
According to our research of Texas and other state lists, there were 11 registered sex offenders living in 75080 zip code as of April 27, 2024. The ratio of all residents to sex offenders in zip code 75080 is 4,455 to 1. The ratio of registered sex offenders to all residents in this zip code is much lower than the state average.
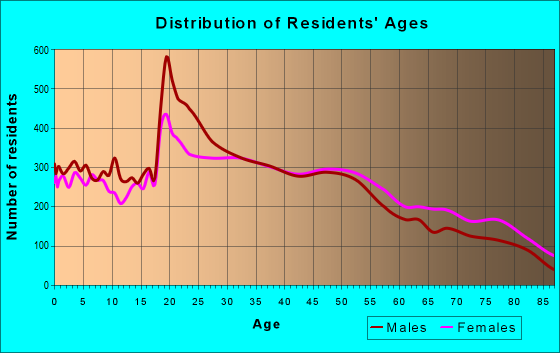
Median resident age:
This zip code:
32.0 years
Texas median age:
35.6 years
Average household size:
This zip code:
2.5 people
Texas:
2.6 people
Averages for the 2020 tax year for zip code 75080, filed in 2021:
Average Adjusted Gross Income (AGI) in 2020: $92,910 (Individual Income Tax Returns)
Here:
$92,910
State:
$77,054
Salary/wage: $80,623 (reported on 82.1% of returns)
Here:
$80,623
State:
$62,766
(% of AGI for various income ranges: 1208.6% for AGIs below $25k, 3760.0% for AGIs $25k-50k, 6679.8% for AGIs $50k-75k, 10339.3% for AGIs $75k-100k, 19363.0% for AGIs $100k-200k, 70494.5% for AGIs over 200k)
Taxable interest for individuals: $2,429 (reported on 32.2% of returns)
This zip code:
$2,429
Texas:
$2,665
(% of AGI for various income ranges: 17.9% for AGIs below $25k, 24.7% for AGIs $25k-50k, 47.0% for AGIs $50k-75k, 65.3% for AGIs $75k-100k, 154.2% for AGIs $100k-200k, 1322.2% for AGIs over 200k)
Ordinary dividends: $8,691 (reported on 28.2% of returns)
Here:
$8,691
State:
$10,044
(% of AGI for various income ranges: 40.0% for AGIs below $25k, 71.7% for AGIs $25k-50k, 142.4% for AGIs $50k-75k, 227.8% for AGIs $75k-100k, 539.9% for AGIs $100k-200k, 4044.7% for AGIs over 200k)
Net capital gain/loss in AGI: +$21,086 (reported on 25.6% of returns)
Here:
+$21,086
State:
+$39,590
(% of AGI for various income ranges: 8.4% for AGIs below $25k, 36.6% for AGIs $25k-50k, 114.0% for AGIs $50k-75k, 250.8% for AGIs $75k-100k, 692.4% for AGIs $100k-200k, 12477.7% for AGIs over 200k)
Profit/loss from business: +$15,690 (reported on 21.1% of returns)
Here:
+$15,690
State:
+$10,888
(% of AGI for various income ranges: 148.6% for AGIs below $25k, 207.3% for AGIs $25k-50k, 259.7% for AGIs $50k-75k, 417.7% for AGIs $75k-100k, 823.6% for AGIs $100k-200k, 3777.7% for AGIs over 200k)
Taxable individual retirement arrangement distribution: $25,486 (reported on 9.9% of returns)
75080:
$25,486
Texas:
$24,740
(% of AGI for various income ranges: 63.8% for AGIs below $25k, 113.7% for AGIs $25k-50k, 284.8% for AGIs $50k-75k, 435.8% for AGIs $75k-100k, 848.4% for AGIs $100k-200k, 2253.8% for AGIs over 200k)
Self-employed (Keogh) retirement plans: $25,357 (reported on 1.0% of returns)
75080:
$25,357
Texas:
$29,298
(% of AGI for various income ranges: 11.2% for AGIs $50k-75k, 64.9% for AGIs $100k-200k, 490.3% for AGIs over 200k)
Total itemized deductions: $39,127 (reported on 11.4% of returns)
Here:
$39,127
State:
$40,428
(% of AGI for various income ranges: 51.8% for AGIs below $25k, 151.5% for AGIs $25k-50k, 294.8% for AGIs $50k-75k, 589.2% for AGIs $75k-100k, 1045.2% for AGIs $100k-200k, 6756.5% for AGIs over 200k)
Charity contributions: $19,053 (reported on 9.7% of returns)
Here:
$19,053
State:
$18,201
(% of AGI for various income ranges: 3.9% for AGIs below $25k, 26.1% for AGIs $25k-50k, 58.3% for AGIs $50k-75k, 129.2% for AGIs $75k-100k, 313.6% for AGIs $100k-200k, 3844.3% for AGIs over 200k)
Taxes paid: $8,045 (reported on 11.1% of returns)
75080:
$8,045
State:
$7,821
(% of AGI for various income ranges: 9.1% for AGIs below $25k, 26.5% for AGIs $25k-50k, 73.2% for AGIs $50k-75k, 151.8% for AGIs $75k-100k, 284.9% for AGIs $100k-200k, 1050.5% for AGIs over 200k)
Earned income credit: $2,238 (reported on 10.4% of returns)
Here:
$2,238
State:
$2,584
(% of AGI for various income ranges: 76.1% for AGIs below $25k, 53.0% for AGIs $25k-50k, 0.7% for AGIs $50k-75k)
Percentage of individuals using paid preparers for their 2020 taxes: 90.9%
Here:
91%
State:
92%
(% for various income ranges: 88.4% for AGIs below $25k, 91.2% for AGIs $25k-50k, 91.7% for AGIs $50k-75k, 91.5% for AGIs $75k-100k, 93.0% for AGIs $100k-200k, 92.0% for AGIs over 200k)
Averages for the 2012 tax year for zip code 75080, filed in 2013:
Average Adjusted Gross Income (AGI) in 2012: $71,064 (Individual Income Tax Returns)
Here:
$71,064
State:
$65,384
Salary/wage: $59,740 (reported on 82.1% of returns)
Here:
$59,740
State:
$52,524
(% of AGI for various income ranges: 75.2% for AGIs below $25k, 79.0% for AGIs $25k-50k, 77.1% for AGIs $50k-75k, 74.8% for AGIs $75k-100k, 76.0% for AGIs $100k-200k, 50.7% for AGIs over 200k)
Taxable interest for individuals: $1,902 (reported on 36.2% of returns)
This zip code:
$1,902
Texas:
$2,372
(% of AGI for various income ranges: 1.2% for AGIs below $25k, 0.7% for AGIs $25k-50k, 0.7% for AGIs $50k-75k, 0.7% for AGIs $75k-100k, 0.7% for AGIs $100k-200k, 1.5% for AGIs over 200k)
Ordinary dividends: $5,992 (reported on 26.5% of returns)
Here:
$5,992
State:
$9,721
(% of AGI for various income ranges: 2.1% for AGIs below $25k, 1.6% for AGIs $25k-50k, 1.9% for AGIs $50k-75k, 2.1% for AGIs $75k-100k, 2.1% for AGIs $100k-200k, 2.9% for AGIs over 200k)
Net capital gain/loss in AGI: +$16,237 (reported on 22.2% of returns)
Here:
+$16,237
State:
+$35,319
(% of AGI for various income ranges: 0.2% for AGIs $25k-50k, 0.4% for AGIs $50k-75k, 0.8% for AGIs $75k-100k, 1.2% for AGIs $100k-200k, 15.9% for AGIs over 200k)
Profit/loss from business: +$17,491 (reported on 20.2% of returns)
Here:
+$17,491
State:
+$13,732
(% of AGI for various income ranges: 11.4% for AGIs below $25k, 4.8% for AGIs $25k-50k, 3.5% for AGIs $50k-75k, 3.7% for AGIs $75k-100k, 4.6% for AGIs $100k-200k, 5.3% for AGIs over 200k)
Taxable individual retirement arrangement distribution: $20,124 (reported on 13.5% of returns)
75080:
$20,124
Texas:
$19,511
(% of AGI for various income ranges: 4.3% for AGIs below $25k, 3.6% for AGIs $25k-50k, 4.0% for AGIs $50k-75k, 4.8% for AGIs $75k-100k, 4.5% for AGIs $100k-200k, 2.7% for AGIs over 200k)
Self-employment retirement plans: $18,957 (reported on 1.1% of returns)
75080:
$18,957
Texas:
$23,938
(% of AGI for various income ranges: 0.2% for AGIs $25k-50k, 0.2% for AGIs $75k-100k, 0.2% for AGIs $100k-200k, 0.6% for AGIs over 200k)
Total itemized deductions: $21,897 (17% of AGI, reported on 32.9% of returns)
Here:
$21,897
State:
$24,724
Here:
17.2% of AGI
State:
15.9% of AGI
(% of AGI for various income ranges: 9.3% for AGIs below $25k, 9.9% for AGIs $25k-50k, 11.2% for AGIs $50k-75k, 10.7% for AGIs $75k-100k, 10.6% for AGIs $100k-200k, 9.3% for AGIs over 200k)
Charity contributions: $6,297 (reported on 27.5% of returns)
Here:
$6,297
State:
$6,808
(% of AGI for various income ranges: 0.8% for AGIs below $25k, 1.3% for AGIs $25k-50k, 1.6% for AGIs $50k-75k, 1.9% for AGIs $75k-100k, 2.3% for AGIs $100k-200k, 3.9% for AGIs over 200k)
Taxes paid: $6,270 (reported on 32.4% of returns)
75080:
$6,270
State:
$6,921
(% of AGI for various income ranges: 1.9% for AGIs below $25k, 2.4% for AGIs $25k-50k, 3.1% for AGIs $50k-75k, 3.1% for AGIs $75k-100k, 3.5% for AGIs $100k-200k, 2.5% for AGIs over 200k)
Earned income credit: $2,332 (reported on 12.2% of returns)
Here:
$2,332
State:
$2,570
(% of AGI for various income ranges: 5.4% for AGIs below $25k, 0.8% for AGIs $25k-50k)
Percentage of individuals using paid preparers for their 2012 taxes: 45.7%
Here:
46%
State:
51%
(% for various income ranges: 46.2% for AGIs below $25k, 46.1% for AGIs $25k-50k, 42.1% for AGIs $50k-75k, 42.5% for AGIs $75k-100k, 44.6% for AGIs $100k-200k, 61.5% for AGIs over 200k)
Averages for the 2004 tax year for zip code 75080, filed in 2005:
Average Adjusted Gross Income (AGI) in 2004: $55,899 (Individual Income Tax Returns)
Here:
$55,899
State:
$47,881
Salary/wage: $49,647 (reported on 80.9% of returns)
Here:
$49,647
State:
$41,947
(% of AGI for various income ranges: 126.2% for AGIs below $10k, 74.9% for AGIs $10k-25k, 78.4% for AGIs $25k-50k, 74.7% for AGIs $50k-75k, 74.8% for AGIs $75k-100k, 66.3% for AGIs over 100k)
Taxable interest for individuals: $2,316 (reported on 48.3% of returns)
This zip code:
$2,316
Texas:
$2,255
(% of AGI for various income ranges: 8.8% for AGIs below $10k, 3.2% for AGIs $10k-25k, 1.6% for AGIs $25k-50k, 1.7% for AGIs $50k-75k, 1.6% for AGIs $75k-100k, 2.1% for AGIs over 100k)
Taxable dividends: $3,423 (reported on 32.3% of returns)
Here:
$3,423
State:
$4,261
(% of AGI for various income ranges: 8.0% for AGIs below $10k, 2.2% for AGIs $10k-25k, 1.5% for AGIs $25k-50k, 1.7% for AGIs $50k-75k, 1.9% for AGIs $75k-100k, 2.1% for AGIs over 100k)
Net capital gain/loss: +$9,438 (reported on 27.7% of returns)
Here:
+$9,438
State:
+$16,110
(% of AGI for various income ranges: -2.8% for AGIs below $10k, -0.0% for AGIs $10k-25k, 0.3% for AGIs $25k-50k, 0.8% for AGIs $50k-75k, 1.2% for AGIs $75k-100k, 9.3% for AGIs over 100k)
Profit/loss from business: +$15,220 (reported on 19.0% of returns)
Here:
+$15,220
State:
+$11,013
(% of AGI for various income ranges: 4.6% for AGIs below $10k, 6.2% for AGIs $10k-25k, 4.1% for AGIs $25k-50k, 4.2% for AGIs $50k-75k, 4.4% for AGIs $75k-100k, 6.0% for AGIs over 100k)
IRA payment deduction: $3,279 (reported on 2.7% of returns)
75080:
$3,279
Texas:
$3,120
(% of AGI for various income ranges: 0.4% for AGIs below $10k, 0.2% for AGIs $10k-25k, 0.3% for AGIs $25k-50k, 0.2% for AGIs $50k-75k, 0.2% for AGIs $75k-100k, 0.1% for AGIs over 100k)
Self-employed pension: $12,487 (reported on 1.5% of returns)
Here:
$12,487
Texas:
$16,401
(% of AGI for various income ranges: 0.7% for AGIs below $10k, 0.2% for AGIs $25k-50k, 0.2% for AGIs $50k-75k, 0.2% for AGIs $75k-100k, 0.5% for AGIs over 100k)
Total itemized deductions: $17,702 (19% of AGI, reported on 37.0% of returns)
Here:
$17,702
State:
$19,631
Here:
19.2% of AGI
State:
18.9% of AGI
(% of AGI for various income ranges: 29.3% for AGIs below $10k, 11.3% for AGIs $10k-25k, 11.5% for AGIs $25k-50k, 13.1% for AGIs $50k-75k, 13.0% for AGIs $75k-100k, 10.6% for AGIs over 100k)
Charity contributions deductions: $4,671 (5% of AGI, reported on 31.0% of returns)
Here:
$4,671
State:
$4,753
Here:
4.7% of AGI
State:
4.2% of AGI
(% of AGI for various income ranges: 1.6% for AGIs below $10k, 1.1% for AGIs $10k-25k, 1.6% for AGIs $25k-50k, 2.2% for AGIs $50k-75k, 2.6% for AGIs $75k-100k, 3.3% for AGIs over 100k)
Total tax: $9,978 (reported on 77.0% of returns)
75080:
$9,978
State:
$9,058
(% of AGI for various income ranges: 5.6% for AGIs below $10k, 4.2% for AGIs $10k-25k, 7.5% for AGIs $25k-50k, 10.5% for AGIs $50k-75k, 11.8% for AGIs $75k-100k, 19.0% for AGIs over 100k)
Earned income credit: $1,696 (reported on 10.3% of returns)
Here:
$1,696
State:
$2,024
Percentage of individuals using paid preparers for their 2004 taxes: 46.5%
Here:
47%
State:
57%
(% for various income ranges: 38.4% for AGIs below $10k, 51.9% for AGIs $10k-25k, 47.8% for AGIs $25k-50k, 45.3% for AGIs $50k-75k, 43.2% for AGIs $75k-100k, 51.0% for AGIs over 100k)
Likely homosexual households (counted as self-reported same-sex unmarried-partner households)
Lesbian couples: 0.2% of all households
Gay men: 0.1% of all households
Household received Food Stamps/SNAP in the past 12 months: 700 Household did not receive Food Stamps/SNAP in the past 12 months: 19,310
Women who had a birth in the past 12 months: 817 (714 now married, 112 unmarried) Women who did not have a birth in the past 12 months: 13,497 (4,828 now married, 8,704 unmarried)
Housing units in zip code 75080 with a mortgage: 6,165 (416 second mortgage, 356 both second mortgage and home equity loan) Houses without a mortgage: 128
Median monthly owner costs for units with a mortgage: $2,387 Median monthly owner costs for units without a mortgage: $904
Residents with income below the poverty level in 2022:
This zip code:
14.7%
Whole state:
14.0%
Residents with income below 50% of the poverty level in 2022:
This zip code:
6.2%
Whole state:
7.4%
Median number of rooms in houses and condos:
Here:
6.8
State:
6.3
Median number of rooms in apartments:
Here:
3.9
State:
4.0
Notable locations in this zip code not listed on our city pages
Notable locations in zip code 75080: West Plano Substation (A), Richardson Fire Department Station 3 (B), Richardson Fire Department Station 2 (C). Display/hide their locations on the map
Churches in zip code 75080 include: Saint Luke Church (A), Fellowship Bible Church North (B), Waterview Missionary Baptist Church (C), Church of Christ Waterview Richardson (D), Melrose Drive Church of Christ (E), Good Shepherd Lutheran Church (F), Community Lutheran Church (G), Saint Stephens Anglican Church (H), Asian American Baptist Church (I). Display/hide their locations on the map
Parks in zip code 75080 include: Heights Park (1), Prairie Creek Park (2), Mimosa Park (3), Woodland Park (4), Dallas Soccer Complex - University of Texas (5), Dallas Activities Center - University of Texas (6), Eagle-Mustang Stadium (7), Custer Park (8), Cottonwood Park (9). Display/hide their locations on the map
7,875 married couples with children.
2,817 single-parent households (390 men, 2,427 women).
72.0% of residents of 75080 zip code speak English at home.
15.1% of residents speak Spanish at home (60% very well, 25% well, 11% not well, 4% not at all).
5.2% of residents speak other Indo-European language at home (79% very well, 17% well, 4% not well).
6.9% of residents speak Asian or Pacific Island language at home (72% very well, 21% well, 6% not well, 1% not at all).
1.1% of residents speak other language at home (75% very well, 22% well, 3% not well).
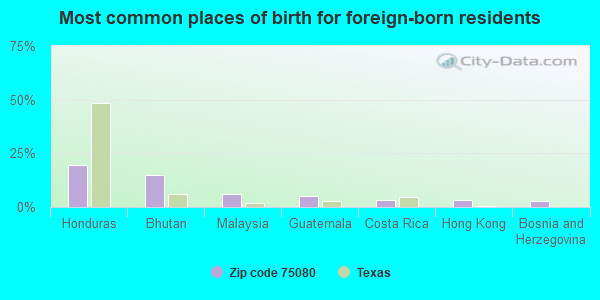
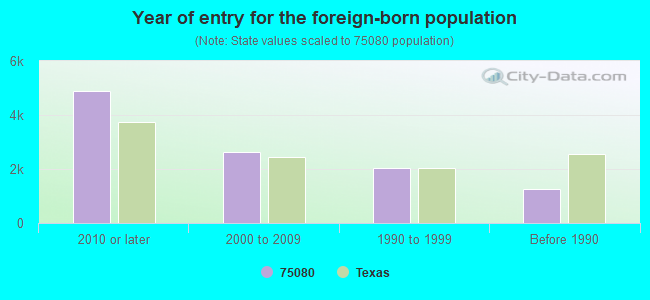
Foreign born population: 9,151 (17.1%) (42.8% of them are naturalized citizens)
Facilities with environmental interests located in this zip code:
ALDRIDGE EL (720 PLEASANT VLY LN in RICHARDSON, TX)
(National Center for Education Statistics) - STATE ID-043910106 Organizations: PLANO ISD (SCHOOL DISTRICT)
ARAPAHO EL (1300 CYPRESS DR in RICHARDSON, TX)
(National Center for Education Statistics) - STATE ID-057916101 Organizations: RICHARDSON ISD (SCHOOL DISTRICT)
BARTON & HOWELL (101 SOUTH CENTRAL EXPRESSWAY in RICHARDSON, TX)
AIR MINOR (AIRS/AFS) (Resource Conservation and Recovery Act (tracking hazardous waste)) Business SIC classification: DRYCLEANING PLANTS, EXCEPT RUG CLEANING Organizations: BARTON & HOWELL CLEANERS (CONTACT/OPERATOR)
BAILLARGEON FORD (1819 N CENTRAL EXPY in RICHARDSON, TX)
(Resource Conservation and Recovery Act (tracking hazardous waste)) Business NAICS classification: MOTOR VEHICLE BODY MANUFACTURING.
AUGUST COMMON CORPORATION (1619 PROMENADE NATL TOWER in RICHARDSON, TX)
(Resource Conservation and Recovery Act (tracking hazardous waste))
1.25 CLEANERS (581 W CAMPBELL RD in RICHARDSON, TX)
Small Quantity Generators, between 100 kg and 1000 kg of hazardous waste/month (Resource Conservation and Recovery Act (tracking hazardous waste)) - notification Organizations: BOB GRIFFIN (CONTACT/OWNER)
Housing units lacking complete plumbing facilities: 0.7% Housing units lacking complete kitchen facilities: 2.5%
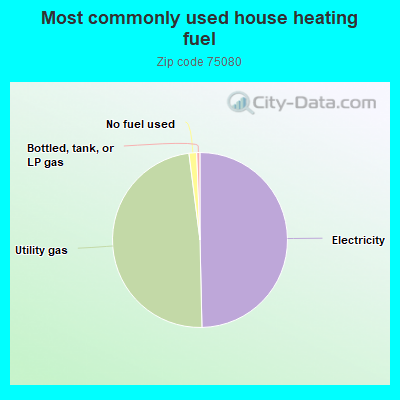
49.5%Electricity
48.2%Utility gas
1.4%No fuel used
0.6%Bottled, tank, or LP gas
Population in 1990: 37,227. Population change in the 1990s: +6,058 (+16.3%).
Place of birth for U.S.-born residents:
This state: 27,451
Northeast: 2,197
Midwest: 4,839
South: 5,319
West: 3,392
50% of the 75080 zip code residents lived in the same house 5 years ago. Out of people who lived in different houses, 52% lived in this county. Out of people who lived in different counties, 50% lived in Texas.
83% of the 75080 zip code residents lived in the same house 1 year ago. Out of people who lived in different houses, 43% moved from this county. Out of people who lived in different houses, 38% moved from different county within same state. Out of people who lived in different houses, 12% moved from different state. Out of people who lived in different houses, 7% moved from abroad.
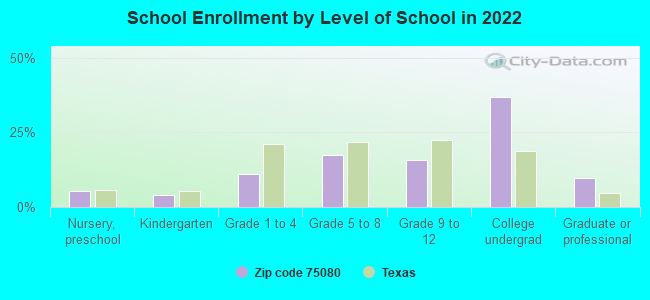
Private vs. public school enrollment:
Students in private schools in grades 1 to 8 (elementary and middle school): 969
Here:
19.0%
Texas:
8.8%
Students in private schools in grades 9 to 12 (high school): 322
Here:
11.6%
Texas:
8.0%
Students in private undergraduate colleges: 781
Here:
11.9%
Texas:
16.2%
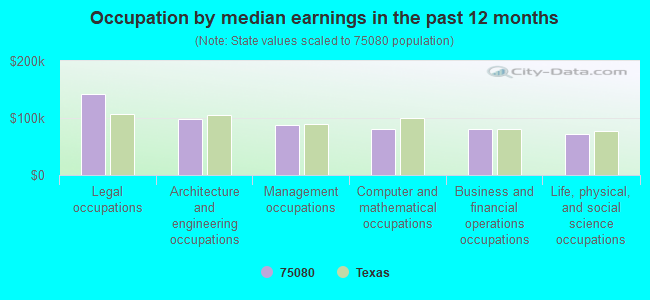
Occupation by median earnings in the past 12 months ($)
141,799Legal occupations
97,555Architecture and engineering occupations
87,303Management occupations
80,649Computer and mathematical occupations
80,057Business and financial operations occupations
71,303Life, physical, and social science occupations
Companies with biggest federal contracts located in this zip code (RICHARDSON, TX):
DEWOLFF, BOBERG AND ASSOCIATES (100 NORTH CENTRAL EXPRESSW; small business) : $41,327,655 in 28 contractsfrom 2000 to 2004
Contracts for Organization/Administrative/PersonneI Studies, Other Management Support Services, Program Evaluation Services, Manpower Studies, and moreby Navy, NASA Signed by year:2000: $50,000; 2001: $0; 2002: $22,337,726; 2003: $8,086,429; 2004: $10,853,500; 2005: $0; 2006: $0.
Biggest contracts:
$10,963,400 with Navy for Organization/Administrative/PersonneI Studies. Taking place in DC. Signed on 2002-09-30. Completion date: 2003-05-01.
$4,767,026 with Navy for Other Management Support Services. Taking place in MD. Signed on 2002-11-13. Completion date: 2003-09-30.
$4,400,000 with Navy for Program Evaluation Services. Taking place in MD. Signed on 2004-12-06. Completion date: 2005-11-07.
$4,284,000 with Navy for Organization/Administrative/PersonneI Studies. Taking place in DC. Signed on 2003-08-15. Completion date: 2004-03-12.
SUPPORT TERMINALS OPERATING PA (2435 N CENTRAL EXPRESSWAY; small business) : $11,446,756 in 29 contractsfrom 1999 to 2006
Contracts for Lease or Rental of Facilities -- Fuel Storage Buildings, Engineering and Technical Services, Storage Tanks by Defense Logistics Agency, Navy Signed by year:2000: $280,040; 2001: $3,536,858; 2002: $124,300; 2003: $422,000; 2004: $3,594,602; 2005: $2,297,176; 2006: $493,000.
Biggest contracts:
$2,201,278 with Defense Logistics Agency for Lease or Rental of Facilities -- Fuel Storage Buildings. Taking place in CA. Signed on 2004-02-20. Completion date: 2009-03-06.
$2,201,278, same as above.Signed on 2001-12-06. Completion date: 2004-03-06.
$861,500 with Defense Logistics Agency for Lease or Rental of Facilities -- Fuel Storage Buildings. Taking place in NM. Signed on 2004-06-08. Completion date: 2005-10-31.
$861,500, same as above.Signed on 2001-10-24. Completion date: 2003-10-31.
QUADTEX SYSTEMS INC (1701 GATEWAY BLVD, SUITE 3; small business)
$258,666 with Army for ADP Software. Taking place in AZ. Signed on 2005-09-22. Completion date: 2005-10-15.
LANGUAGE COMPUTER (1701 NORTH COLLINS BLVD; small business) : $169,953 in 2 contractsfrom 2002 to 2005
$99,968 with Air Force for Other Defense -- Applied Research and Exploratory Development (R&D). Signed on 2005-04-13. Completion date: 2006-01-13.
$69,985 with Navy for Defense Electronics and Communication Equipment -- Basic Research (R&D). Signed on 2002-05-16. Completion date: 2002-11-16.
ZEPCO SALES & SERVICE, INC (508 N CENTRAL EXPRESSWAY; small business) : $91,080 in 2 contractsfrom 2001 to 2002
$64,828 with Army for Trucks and Truck Tractors, Wheeled. Signed on 2002-04-12. Completion date: 2002-05-31.
$26,252 with Army for Combination and Miscellaneous Instruments. Signed on 2001-07-19. Completion date: 2001-09-19.
MORRIS L HES (505 VERNET STREET; small business)
$67,850 with Navy for Miscellaneous Items. Signed on 2001-07-13. Completion date: 2001-09-28.
FAIR JOBBING COMPANY INC (111 N CENTRAL EXPY; small business) : $54,686 in 2 contractsin 2003
$27,892 with Air Force for Armor, Personal. Taking place in KS. Signed on 2003-02-20. Completion date: 2003-02-28.
$26,794 with Army for Individual Equipment. Taking place in IA. Signed on 2003-02-27. Completion date: 2003-02-28.
ASSET INTERTECH INC (2201 N CENTRAL EXPY; small business)
$44,226 with Navy for Combination and Miscellaneous Instruments. Signed on 2000-08-31. Completion date: 2001-08-07.
PETER J PHALON (PHALON GEORGE CAPITAL ADVISORS; small business)
$35,000 with Offices, Boards and Divisions (includes Attorney General, Deputy Attorney General, etc.) for Expert Witness. Taking place in DC. Signed on 2005-05-15. Completion date: 2006-06-01.
NETWORK RECRUITING, INC (100 NORTH CENTRAL EXPRESSW; small business)
$33,180 with Air Force for Pulmonary Services. Taking place in MS. Signed on 2002-08-12. Completion date: 2002-09-30.
Top industries in this zip code by the number of employees in 2005:
Administrative and Support and Waste Management and Remediation Services: Temporary Help Services (250-499 employees: 3 establishments, 100-249 employees: 3 establishments, 50-99 employees: 2 establishments, 20-49 employees: 4 establishments, 10-19 employees: 1 establishment, 5-9 employees: 1 establishment, 1-4 employees: 1 establishment)
Finance and Insurance: Direct Health and Medical Insurance Carriers (over 1000: 1, 5-9: 1, 1-4: 1)
2002 - 2018 National Fire Incident Reporting System (NFIRS) incidents
According to the data from the years 2002 - 2018 the average number of fire incidents per year is 106. The highest number of fires - 155 took place in 2006, and the least - 65 in 2016. The data has a dropping trend.
When looking into fire subcategories, the most incidents belonged to: Outside Fires (41.0%), and Structure Fires (31.3%).
Fire incident types reported to NFIRS in Zip Code 75080


 Nearest zip codes: 75081, 75075, 75252, 75248, 75251, 75243.
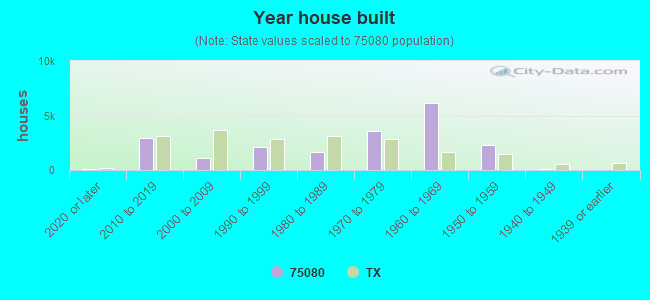


 According to the data from the years 2002 - 2018 the average number of fire incidents per year is 106. The highest number of fires - 155 took place in 2006, and the least - 65 in 2016. The data has a dropping trend.
 When looking into fire subcategories, the most incidents belonged to: Outside Fires (41.0%), and Structure Fires (31.3%).