Estimated zip code population in 2022: 38,284 Zip code population in 2010: 33,395 Zip code population in 2000: 33,020
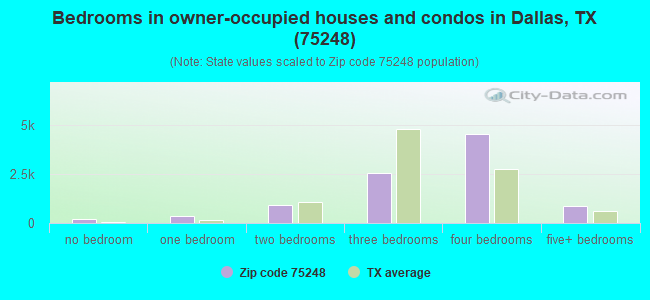
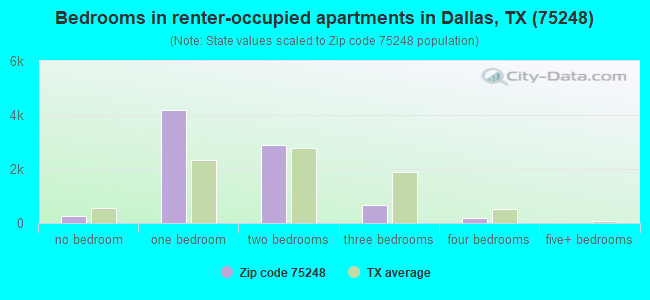
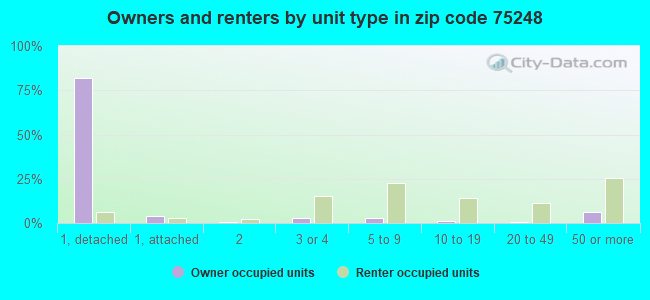
Houses and condos: 19,284 Renter-occupied apartments: 8,233
% of renters here:
47%
State:
38%
March 2022 cost of living index in zip code 75248: 97.8 (near average, U.S. average is 100)
Land area: 7.4 sq. mi. Water area: 0.0 sq. mi.
Population density: 5,167 people per square mile
(average).
OSM Map
General Map
Google Map
MSN Map
OSM Map
General Map
Google Map
MSN Map
OSM Map
General Map
Google Map
MSN Map
OSM Map
General Map
Google Map
MSN Map
Please wait while loading the map...
Real estate property taxes paid for housing units in 2022:
This zip code:
1.5% ($8,702)
Texas:
1.5% ($4,050)
Median real estate property taxes paid for housing units with mortgages in 2022: $9,687 (1.6%) Median real estate property taxes paid for housing units with no mortgage in 2022: $6,914 (1.3%)
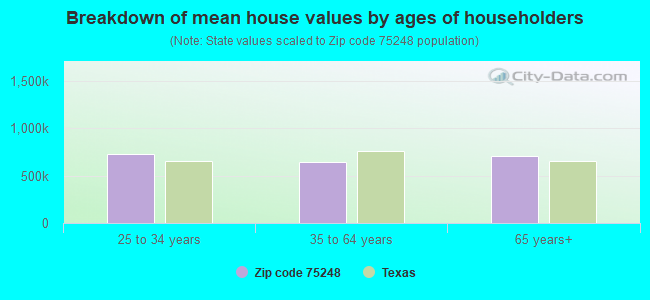
Estimated median house/condo value in 2022: $585,167
75248:
$585,167
Texas:
$275,400
According to our research of Texas and other state lists, there were 26 registered sex offenders living in 75248 zip code as of April 27, 2024. The ratio of all residents to sex offenders in zip code 75248 is 1,416 to 1. The ratio of registered sex offenders to all residents in this zip code is much lower than the state average.
Median resident age:
This zip code:
40.5 years
Texas median age:
35.6 years
Average household size:
This zip code:
2.2 people
Texas:
2.6 people
Averages for the 2020 tax year for zip code 75248, filed in 2021:
Average Adjusted Gross Income (AGI) in 2020: $157,886 (Individual Income Tax Returns)
Here:
$157,886
State:
$77,054
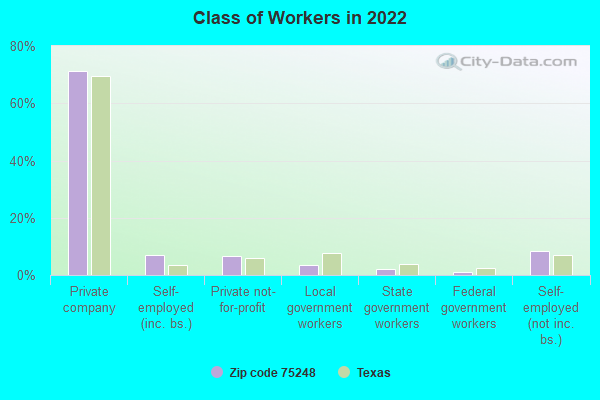
Salary/wage: $104,756 (reported on 79.2% of returns)
Here:
$104,756
State:
$62,766
(% of AGI for various income ranges: 1212.8% for AGIs below $25k, 3938.7% for AGIs $25k-50k, 6832.4% for AGIs $50k-75k, 9846.9% for AGIs $75k-100k, 19026.8% for AGIs $100k-200k, 86117.5% for AGIs over 200k)
Taxable interest for individuals: $6,659 (reported on 39.1% of returns)
This zip code:
$6,659
Texas:
$2,665
(% of AGI for various income ranges: 24.7% for AGIs below $25k, 37.6% for AGIs $25k-50k, 99.9% for AGIs $50k-75k, 172.8% for AGIs $75k-100k, 280.0% for AGIs $100k-200k, 3790.8% for AGIs over 200k)
Ordinary dividends: $16,098 (reported on 35.8% of returns)
Here:
$16,098
State:
$10,044
(% of AGI for various income ranges: 70.9% for AGIs below $25k, 103.0% for AGIs $25k-50k, 232.0% for AGIs $50k-75k, 419.8% for AGIs $75k-100k, 1046.2% for AGIs $100k-200k, 7554.4% for AGIs over 200k)
Net capital gain/loss in AGI: +$74,490 (reported on 34.6% of returns)
Here:
+$74,490
State:
+$39,590
(% of AGI for various income ranges: 27.5% for AGIs below $25k, 61.2% for AGIs $25k-50k, 188.5% for AGIs $50k-75k, 316.9% for AGIs $75k-100k, 1106.8% for AGIs $100k-200k, 44321.7% for AGIs over 200k)
Profit/loss from business: +$26,419 (reported on 23.2% of returns)
Here:
+$26,419
State:
+$10,888
(% of AGI for various income ranges: 135.9% for AGIs below $25k, 196.7% for AGIs $25k-50k, 296.5% for AGIs $50k-75k, 546.5% for AGIs $75k-100k, 1337.6% for AGIs $100k-200k, 7092.5% for AGIs over 200k)
Taxable individual retirement arrangement distribution: $31,500 (reported on 12.2% of returns)
75248:
$31,500
Texas:
$24,740
(% of AGI for various income ranges: 73.9% for AGIs below $25k, 121.6% for AGIs $25k-50k, 293.1% for AGIs $50k-75k, 785.8% for AGIs $75k-100k, 1578.4% for AGIs $100k-200k, 2678.4% for AGIs over 200k)
Self-employed (Keogh) retirement plans: $28,428 (reported on 1.7% of returns)
75248:
$28,428
Texas:
$29,298
(% of AGI for various income ranges: 25.2% for AGIs $50k-75k, 89.5% for AGIs $100k-200k, 705.5% for AGIs over 200k)
Total itemized deductions: $42,892 (reported on 16.4% of returns)
Here:
$42,892
State:
$40,428
(% of AGI for various income ranges: 120.7% for AGIs below $25k, 160.3% for AGIs $25k-50k, 376.2% for AGIs $50k-75k, 748.7% for AGIs $75k-100k, 1562.9% for AGIs $100k-200k, 8168.0% for AGIs over 200k)
Charity contributions: $18,791 (reported on 14.3% of returns)
Here:
$18,791
State:
$18,201
(% of AGI for various income ranges: 9.7% for AGIs below $25k, 29.3% for AGIs $25k-50k, 71.4% for AGIs $50k-75k, 157.3% for AGIs $75k-100k, 372.8% for AGIs $100k-200k, 3909.9% for AGIs over 200k)
Taxes paid: $8,639 (reported on 16.2% of returns)
75248:
$8,639
State:
$7,821
(% of AGI for various income ranges: 27.2% for AGIs below $25k, 37.9% for AGIs $25k-50k, 83.4% for AGIs $50k-75k, 189.7% for AGIs $75k-100k, 419.4% for AGIs $100k-200k, 1378.6% for AGIs over 200k)
Earned income credit: $1,875 (reported on 8.4% of returns)
Here:
$1,875
State:
$2,584
(% of AGI for various income ranges: 64.4% for AGIs below $25k, 38.9% for AGIs $25k-50k)
Percentage of individuals using paid preparers for their 2020 taxes: 90.6%
Here:
91%
State:
92%
(% for various income ranges: 87.5% for AGIs below $25k, 90.0% for AGIs $25k-50k, 92.7% for AGIs $50k-75k, 91.1% for AGIs $75k-100k, 91.1% for AGIs $100k-200k, 93.4% for AGIs over 200k)
Averages for the 2012 tax year for zip code 75248, filed in 2013:
Average Adjusted Gross Income (AGI) in 2012: $115,216 (Individual Income Tax Returns)
Here:
$115,216
State:
$65,384
Salary/wage: $85,905 (reported on 79.7% of returns)
Here:
$85,905
State:
$52,524
(% of AGI for various income ranges: 74.7% for AGIs below $25k, 79.3% for AGIs $25k-50k, 72.0% for AGIs $50k-75k, 64.8% for AGIs $75k-100k, 70.4% for AGIs $100k-200k, 49.7% for AGIs over 200k)
Taxable interest for individuals: $4,654 (reported on 42.7% of returns)
This zip code:
$4,654
Texas:
$2,372
(% of AGI for various income ranges: 1.9% for AGIs below $25k, 1.1% for AGIs $25k-50k, 1.1% for AGIs $50k-75k, 1.3% for AGIs $75k-100k, 1.2% for AGIs $100k-200k, 2.1% for AGIs over 200k)
Ordinary dividends: $12,956 (reported on 35.2% of returns)
Here:
$12,956
State:
$9,721
(% of AGI for various income ranges: 4.6% for AGIs below $25k, 2.5% for AGIs $25k-50k, 3.0% for AGIs $50k-75k, 3.1% for AGIs $75k-100k, 3.1% for AGIs $100k-200k, 4.7% for AGIs over 200k)
Net capital gain/loss in AGI: +$29,304 (reported on 31.1% of returns)
Here:
+$29,304
State:
+$35,319
(% of AGI for various income ranges: 0.5% for AGIs $25k-50k, 0.8% for AGIs $50k-75k, 0.8% for AGIs $75k-100k, 1.8% for AGIs $100k-200k, 13.4% for AGIs over 200k)
Profit/loss from business: +$23,519 (reported on 23.4% of returns)
Here:
+$23,519
State:
+$13,732
(% of AGI for various income ranges: 9.0% for AGIs below $25k, 4.2% for AGIs $25k-50k, 4.8% for AGIs $50k-75k, 5.3% for AGIs $75k-100k, 5.7% for AGIs $100k-200k, 4.2% for AGIs over 200k)
Taxable individual retirement arrangement distribution: $31,228 (reported on 15.2% of returns)
75248:
$31,228
Texas:
$19,511
(% of AGI for various income ranges: 3.7% for AGIs below $25k, 3.7% for AGIs $25k-50k, 4.9% for AGIs $50k-75k, 6.8% for AGIs $75k-100k, 5.7% for AGIs $100k-200k, 3.2% for AGIs over 200k)
Self-employment retirement plans: $22,032 (reported on 2.0% of returns)
75248:
$22,032
Texas:
$23,938
(% of AGI for various income ranges: 0.3% for AGIs below $25k, 0.2% for AGIs $50k-75k, 0.2% for AGIs $75k-100k, 0.4% for AGIs $100k-200k, 0.5% for AGIs over 200k)
Total itemized deductions: $30,496 (14% of AGI, reported on 39.7% of returns)
Here:
$30,496
State:
$24,724
Here:
14.0% of AGI
State:
15.9% of AGI
(% of AGI for various income ranges: 14.0% for AGIs below $25k, 9.9% for AGIs $25k-50k, 13.2% for AGIs $50k-75k, 13.0% for AGIs $75k-100k, 12.7% for AGIs $100k-200k, 8.9% for AGIs over 200k)
Charity contributions: $8,691 (reported on 34.7% of returns)
Here:
$8,691
State:
$6,808
(% of AGI for various income ranges: 1.1% for AGIs below $25k, 1.3% for AGIs $25k-50k, 1.8% for AGIs $50k-75k, 2.1% for AGIs $75k-100k, 2.5% for AGIs $100k-200k, 3.1% for AGIs over 200k)
Taxes paid: $9,476 (reported on 39.2% of returns)
75248:
$9,476
State:
$6,921
(% of AGI for various income ranges: 3.3% for AGIs below $25k, 2.4% for AGIs $25k-50k, 3.7% for AGIs $50k-75k, 3.9% for AGIs $75k-100k, 4.3% for AGIs $100k-200k, 2.8% for AGIs over 200k)
Earned income credit: $1,894 (reported on 10.0% of returns)
Here:
$1,894
State:
$2,570
(% of AGI for various income ranges: 4.2% for AGIs below $25k, 0.5% for AGIs $25k-50k)
Percentage of individuals using paid preparers for their 2012 taxes: 51.1%
Here:
51%
State:
51%
(% for various income ranges: 48.4% for AGIs below $25k, 45.2% for AGIs $25k-50k, 49.5% for AGIs $50k-75k, 52.0% for AGIs $75k-100k, 52.0% for AGIs $100k-200k, 69.2% for AGIs over 200k)
Averages for the 2004 tax year for zip code 75248, filed in 2005:
Average Adjusted Gross Income (AGI) in 2004: $96,951 (Individual Income Tax Returns)
Here:
$96,951
State:
$47,881
Salary/wage: $75,435 (reported on 79.7% of returns)
Here:
$75,435
State:
$41,947
(% of AGI for various income ranges: 74.6% for AGIs $10k-25k, 79.9% for AGIs $25k-50k, 71.3% for AGIs $50k-75k, 68.9% for AGIs $75k-100k, 55.7% for AGIs over 100k)
Taxable interest for individuals: $4,286 (reported on 55.8% of returns)
This zip code:
$4,286
Texas:
$2,255
(% of AGI for various income ranges: 3.6% for AGIs $10k-25k, 2.0% for AGIs $25k-50k, 2.3% for AGIs $50k-75k, 1.9% for AGIs $75k-100k, 2.3% for AGIs over 100k)
Taxable dividends: $6,732 (reported on 43.0% of returns)
Here:
$6,732
State:
$4,261
(% of AGI for various income ranges: 3.1% for AGIs $10k-25k, 2.3% for AGIs $25k-50k, 2.6% for AGIs $50k-75k, 2.3% for AGIs $75k-100k, 3.0% for AGIs over 100k)
Net capital gain/loss: +$28,824 (reported on 39.5% of returns)
Here:
+$28,824
State:
+$16,110
(% of AGI for various income ranges: 0.8% for AGIs $10k-25k, 0.3% for AGIs $25k-50k, 1.1% for AGIs $50k-75k, 1.7% for AGIs $75k-100k, 14.7% for AGIs over 100k)
Profit/loss from business: +$21,497 (reported on 23.1% of returns)
Here:
+$21,497
State:
+$11,013
(% of AGI for various income ranges: 7.9% for AGIs $10k-25k, 4.6% for AGIs $25k-50k, 7.0% for AGIs $50k-75k, 7.3% for AGIs $75k-100k, 4.5% for AGIs over 100k)
IRA payment deduction: $3,612 (reported on 3.8% of returns)
75248:
$3,612
Texas:
$3,120
(% of AGI for various income ranges: 0.3% for AGIs $10k-25k, 0.3% for AGIs $25k-50k, 0.3% for AGIs $50k-75k, 0.3% for AGIs $75k-100k, 0.1% for AGIs over 100k)
Self-employed pension: $15,926 (reported on 2.8% of returns)
Here:
$15,926
Texas:
$16,401
(% of AGI for various income ranges: 0.1% for AGIs $10k-25k, 0.2% for AGIs $25k-50k, 0.4% for AGIs $50k-75k, 0.5% for AGIs $75k-100k, 0.5% for AGIs over 100k)
Total itemized deductions: $25,768 (15% of AGI, reported on 43.7% of returns)
Here:
$25,768
State:
$19,631
Here:
15.2% of AGI
State:
18.9% of AGI
(% of AGI for various income ranges: 14.7% for AGIs $10k-25k, 13.7% for AGIs $25k-50k, 16.0% for AGIs $50k-75k, 16.6% for AGIs $75k-100k, 9.8% for AGIs over 100k)
Charity contributions deductions: $6,478 (4% of AGI, reported on 38.9% of returns)
Here:
$6,478
State:
$4,753
Here:
3.6% of AGI
State:
4.2% of AGI
(% of AGI for various income ranges: 1.4% for AGIs $10k-25k, 1.8% for AGIs $25k-50k, 2.5% for AGIs $50k-75k, 3.0% for AGIs $75k-100k, 2.6% for AGIs over 100k)
Total tax: $23,045 (reported on 81.8% of returns)
75248:
$23,045
State:
$9,058
(% of AGI for various income ranges: 4.9% for AGIs $10k-25k, 8.5% for AGIs $25k-50k, 11.5% for AGIs $50k-75k, 12.5% for AGIs $75k-100k, 22.3% for AGIs over 100k)
Earned income credit: $1,498 (reported on 7.1% of returns)
Here:
$1,498
State:
$2,024
Percentage of individuals using paid preparers for their 2004 taxes: 53.1%
Here:
53%
State:
57%
(% for various income ranges: 50.0% for AGIs below $10k, 54.2% for AGIs $10k-25k, 46.7% for AGIs $25k-50k, 51.7% for AGIs $50k-75k, 51.5% for AGIs $75k-100k, 61.7% for AGIs over 100k)
Likely homosexual households (counted as self-reported same-sex unmarried-partner households)
Lesbian couples: 0.1% of all households
Gay men: 0.7% of all households
Household received Food Stamps/SNAP in the past 12 months: 352 Household did not receive Food Stamps/SNAP in the past 12 months: 17,235
Women who had a birth in the past 12 months: 383 (240 now married, 141 unmarried) Women who did not have a birth in the past 12 months: 8,537 (4,107 now married, 4,419 unmarried)
Housing units in zip code 75248 with a mortgage: 5,571 (342 second mortgage, 41 home equity loan, 277 both second mortgage and home equity loan) Houses without a mortgage: 61
Median monthly owner costs for units with a mortgage: $2,840 Median monthly owner costs for units without a mortgage: $1,242
Residents with income below the poverty level in 2022:
This zip code:
4.5%
Whole state:
14.0%
Residents with income below 50% of the poverty level in 2022:
This zip code:
1.4%
Whole state:
7.4%
Median number of rooms in houses and condos:
Here:
7.7
State:
6.3
Median number of rooms in apartments:
Here:
3.7
State:
4.0
Notable locations in this zip code not listed on our city pages
Parks in zip code 75248 include: Arapahoe Park (1), Kiowa Park (2), Salado Park (3), Twin Lakes Park (4), Campbell Green Park (5). Display/hide their locations on the map
Tourist attraction (not listed on the city page) : @Texas (16990 Dallas Parkway Suite 201).
In group quarters: 140 (-1 institutionalized population)
Size of family households: 5,029 2-persons, 2,044 3-persons, 2,043 4-persons, 772 5-persons, 142 6-persons, 14 7-or-more-persons
Size of nonfamily households: 6,307 1-person, 1,309 2-persons, 121 3-persons
6,238 married couples with children.
923 single-parent households (446 men, 477 women).
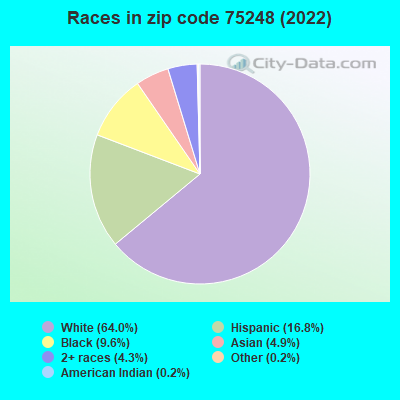
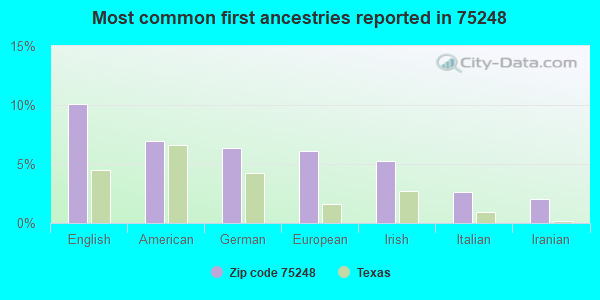
81.6% of residents of 75248 zip code speak English at home.
9.6% of residents speak Spanish at home (63% very well, 17% well, 13% not well, 7% not at all).
4.9% of residents speak other Indo-European language at home (72% very well, 19% well, 9% not well).
3.6% of residents speak Asian or Pacific Island language at home (55% very well, 31% well, 11% not well, 3% not at all).
0.7% of residents speak other language at home (68% very well, 19% well, 13% not well).
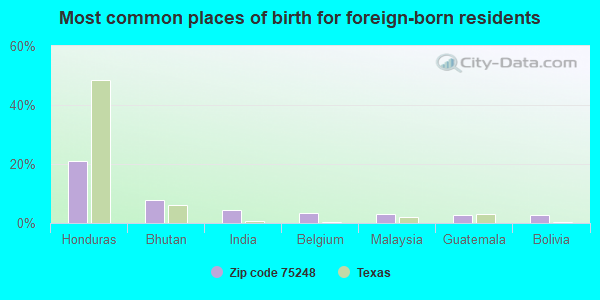
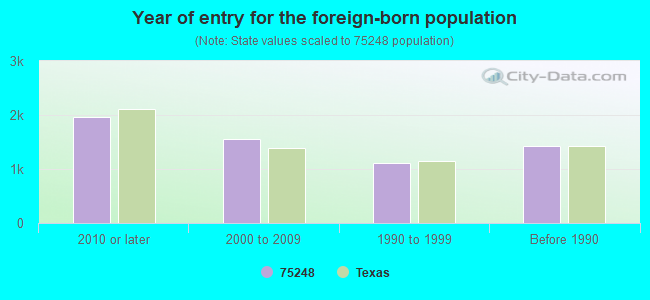
Foreign born population: 5,642 (14.7%) (47.1% of them are naturalized citizens)
Facilities with environmental interests located in this zip code:
BARRY, BETTE, AND LED DUKE (5665 ARAPAHO RD in DALLAS, TX)
(Integrated Compliance Information System) - ICIS-06-1998-0052, FORMAL ENFORCEMENT ACTION Business SIC classification: GENERAL CONTRACTORS-NONRESIDENTIAL BUILDINGS, OTHER THAN INDUSTRIAL BUILDINGS AND WAREHOUSES
BARTON & HOWELL CLEANERS (429 SPANISH VILLAGE in DALLAS, TX)
(Resource Conservation and Recovery Act (tracking hazardous waste)) Alternative names: SPIRIT CLEANERS
17300 PARKWAY VENTURE LP (17300 N DALLAS PKWY STE 2010 in DALLAS, TX)
Conditionally Exempt Small Quantity Generators, less than 100 kg/month of hazardous waste (Resource Conservation and Recovery Act (tracking hazardous waste)) - notification
Housing units lacking complete plumbing facilities: 0.2% Housing units lacking complete kitchen facilities: 0.5%
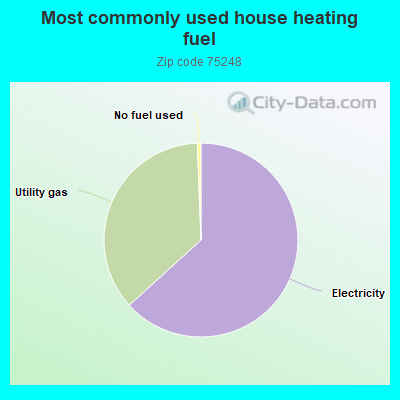
63.0%Electricity
36.0%Utility gas
0.6%No fuel used
Population in 1990: 34,858.
Place of birth for U.S.-born residents:
This state: 17,882
Northeast: 2,058
Midwest: 4,892
South: 4,815
West: 2,670
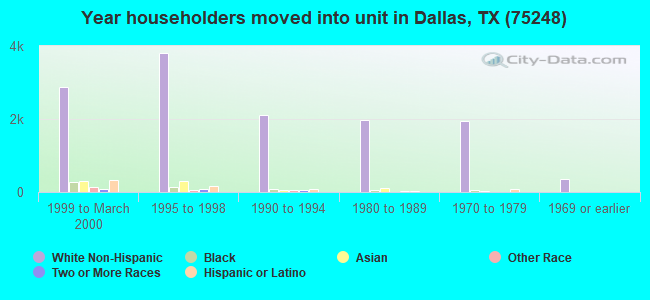
50% of the 75248 zip code residents lived in the same house 5 years ago. Out of people who lived in different houses, 57% lived in this county. Out of people who lived in different counties, 50% lived in Texas.
84% of the 75248 zip code residents lived in the same house 1 year ago. Out of people who lived in different houses, 40% moved from this county. Out of people who lived in different houses, 35% moved from different county within same state. Out of people who lived in different houses, 22% moved from different state. Out of people who lived in different houses, 3% moved from abroad.
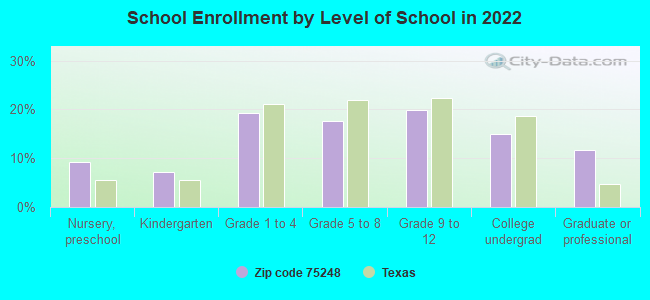
Private vs. public school enrollment:
Students in private schools in grades 1 to 8 (elementary and middle school): 732
Here:
23.7%
Texas:
8.8%
Students in private schools in grades 9 to 12 (high school): 312
Here:
18.9%
Texas:
8.0%
Students in private undergraduate colleges: 236
Here:
19.4%
Texas:
16.2%
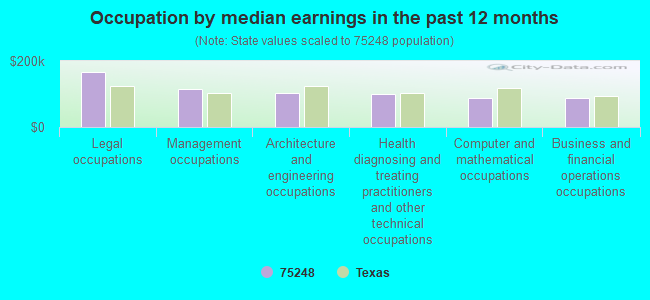
Occupation by median earnings in the past 12 months ($)
166,654Legal occupations
114,512Management occupations
102,055Architecture and engineering occupations
100,110Health diagnosing and treating practitioners and other technical occupations
89,319Computer and mathematical occupations
89,250Business and financial operations occupations
Companies with federal contracts located in this zip code (DALLAS, TX):
LONE STAR TRACTOR SERVICE, INC (5507 BENT TRAIL; small business) : $1,608,793 in 76 contractsfrom 2002 to 2006
Contracts for Landscaping/Groundskeeping Services, Recreation Site Maintenance Services (non-construction), Custodial Janitorial Services, Laundry and DryCleaning Services by Army, U.S. Army Corps of Engineers - civil program financing only Signed by year:2000: $0; 2001: $0; 2002: $96,750; 2003: $562,188; 2004: $565,365; 2005: $283,318; 2006: $101,172.
Biggest contracts:
$494,560 with Army for Landscaping/Groundskeeping Services. Signed on 2003-04-08. Completion date: 2004-04-08.
$125,410, same as above.Signed on 2004-07-29. Completion date: 2004-08-30.
$104,040, same as above.Signed on 2004-07-29. Completion date: 2004-07-16.
$37,380, same as above.Signed on 2004-06-08. Completion date: 2004-06-04.
VISM CORPORATION (16210 SHADYBANK DR; small business) : $448,883 in 2 contractsfrom 2004 to 2006
$349,928 with Army for Other Defense -- Applied Research and Exploratory Development (R&D). Signed on 2006-03-02. Completion date: 2007-05-31.
$98,955, same as above.Signed on 2004-11-29. Completion date: 2004-07-31.
LEE, TIANA C (16500 LAUDER LANE #22202; small business)
$47,250 with Army for Pharmacology Services. Taking place in HI. Signed on 2004-09-11. Completion date: 2005-09-30.
DAL TECH ENGINEERING INC (17311 DALLAS PKWY STE 200; small business) : $47,019 in 2 contractsin 2004
$43,000 with Army for Topography Services. Signed on 2004-02-25. Completion date: 2004-02-25.
$4,019 with Army for Land Surveys, Cadastral Services (non-construction). Signed on 2004-12-17. Completion date: 2005-12-15.
POLITICAL RESEARCH, INC (16850 DALLAS PKWY; small business)
$13,611 with Air Force for Training Aids. Signed on 2005-09-30. Completion date: 2006-09-28.
VP PROACT ENTERPRISES (7314 BRENTFIELD DR; small business)
$7,545 with Navy for ADP Components. Signed on 2002-09-11. Completion date: 2002-10-11.
BARBARA J WENDLING (16340 SHADYBANK DR; small business) : $7,250 in 3 contractsfrom 2004 to 2005
$4,400 with Department of Defense Education Activity for Education Services. Signed on 2004-12-13. Completion date: 2005-12-12.
$3,000 with Army for Education Services. Taking place in KY. Signed on 2005-04-15. Completion date: 2005-04-21.
-$150, same as above.Signed on 2005-09-13. Completion date: 2005-04-21.
Top industries in this zip code by the number of employees in 2005:
Information: Data Processing, Hosting, and Related Services (over 1000 employees: 1 establishment, 20-49 employees: 1 establishment, 5-9 employees: 2 establishments, 1-4 employees: 4 establishments)
Administrative and Support and Waste Management and Remediation Services: Office Administrative Services (500-999: 1, 250-499: 1, 20-49: 3, 10-19: 1, 5-9: 3, 1-4: 10)
Administrative and Support and Waste Management and Remediation Services: Temporary Help Services (100-249: 2, 50-99: 5, 20-49: 2, 10-19: 2, 1-4: 3)
2002 - 2018 National Fire Incident Reporting System (NFIRS) incidents
According to the data from the years 2002 - 2018 the average number of fire incidents per year is 32. The highest number of fires - 84 took place in 2003, and the least - 2 in 2005. The data has a declining trend.
When looking into fire subcategories, the most reports belonged to: Outside Fires (47.5%), and Other (19.9%).
Fire incident types reported to NFIRS in Zip Code 75248

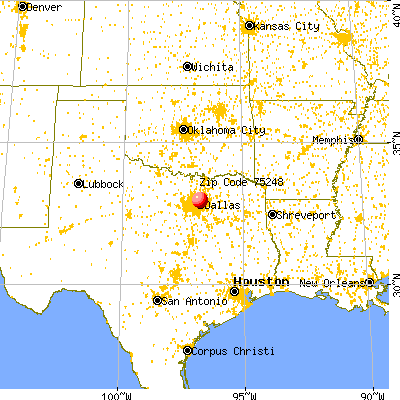


 Nearest zip codes: 75254, 75252, 75240, 75001, 75287, 75080.


 According to the data from the years 2002 - 2018 the average number of fire incidents per year is 32. The highest number of fires - 84 took place in 2003, and the least - 2 in 2005. The data has a declining trend.
 When looking into fire subcategories, the most reports belonged to: Outside Fires (47.5%), and Other (19.9%).