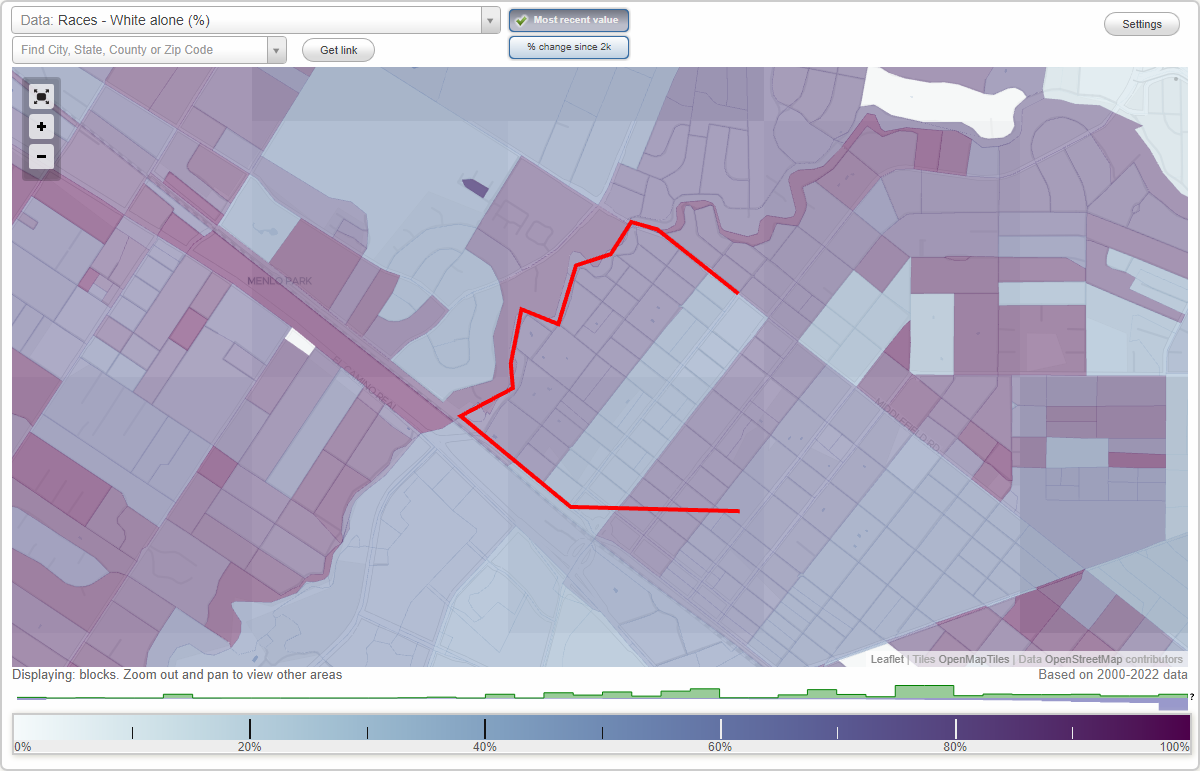
Downtown (Downtown North) neighborhood in Palo Alto, California (CA), 94301 detailed profile
Settings
X

Business Search - 14 Million verified businesses
Area: 0.201 square miles
Population: 2,286
Population density:
| Downtown (Downtown North): | 11,365 people per square mile |
| Palo Alto: | 2,789 people per square mile |

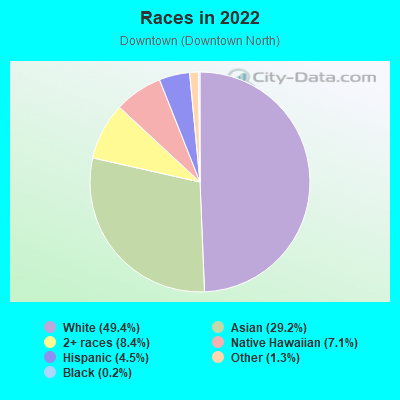
- 1,21249.4%White
- 71629.2%Asian
- 2058.4%Two or more races
- 1747.1%Native Hawaiian and Other
Pacific Islander - 1114.5%Hispanic or Latino
- 311.3%Some other race
- 60.2%Black
Median household income in 2022:
| Downtown (Downtown North): | $231,850 |
| Palo Alto: | $179,707 |
Distribution of median household income
![Distribution of median household income]()
- 33Less than $10,000
- 27$10,000 to $19,999
- 4$20,000 to $29,999
- 23$30,000 to $39,999
- 20$40,000 to $49,999
- 15$50,000 to $59,999
- 26$60,000 to $74,999
- 8$75,000 to $99,999
- 51$100,000 to $124,999
- 76$125,000 to $149,999
- 151$150,000 to $199,999
- 419$200,000 or more

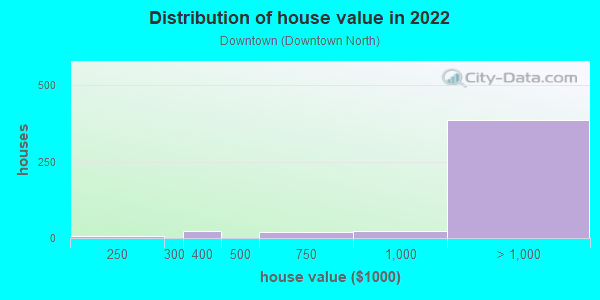
Distribution of owner-occupied house/condo value
![Distribution of owner-occupied house/condo value]()
- 5$200,000 to $249,999
- 24$300,000 to $399,999
- 19$500,000 to $749,999
- 22$750,000 to $999,999
- 386$1,000,000 or more
Distribution of rent paid by renters
![Distribution of rent paid by renters]()
- 9$600 to $699
- 28$1,000 to $1,249
- 19$1,250 to $1,499
- 21$1,500 to $1,999
- 373$2,000 or more

Median rent in 2022:
| Downtown (Downtown North): | $3,457 |
| Palo Alto: | $2,001 |
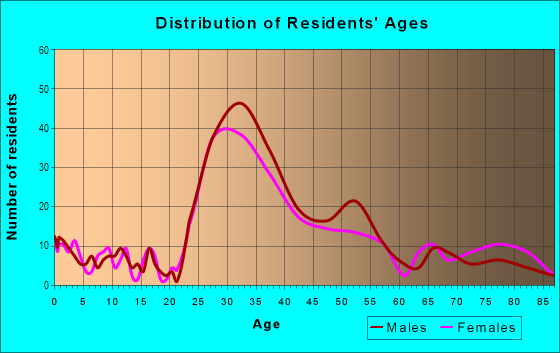
| Males: | 977 |
| Females: | 1,309 |
Males:
| This neighborhood: | 37.5 years |
| Whole city: | 47.1 years |
| This neighborhood: | 37.5 years |
| Whole city: | 48.1 years |
Average household size:
| Downtown (Downtown North): | 2.9 people |
| Palo Alto: | 2.3 people |
Percentage of family households:
| Downtown (Downtown North): | 58.1% |
| Palo Alto: | 42.2% |
| Here: | 63.2% |
| Palo Alto: | 52.1% |
Percentage of married-couple families with children (among all households):
| Downtown (Downtown North): | 33.8% |
| Palo Alto: | 37.5% |
Percentage of single-mother households (among all households):
| Downtown (Downtown North): | 4.2% |
| Palo Alto: | 3.5% |
Percentage of never married males 15 years old and over:
Percentage of never married females 15 years old and over:
| Downtown (Downtown North): | 9.5% |
| Palo Alto: | 17.4% |
Percentage of never married females 15 years old and over:
| Downtown (Downtown North): | 26.5% |
| city: | 11.8% |
Percentage of people that speak English not well or not at all:
| Downtown (Downtown North): | 0.0% |
| Palo Alto: | 3.7% |
Percentage of people born in this state:
Percentage of people born in another U.S. state:
Percentage of native residents but born outside the U.S.:
Percentage of foreign born residents:
| Here: | 40.3% |
| Palo Alto: | 36.4% |
Percentage of people born in another U.S. state:
| Downtown (Downtown North): | 26.4% |
| Palo Alto: | 28.3% |
Percentage of native residents but born outside the U.S.:
| Here: | 1.2% |
| city: | 3.7% |
Percentage of foreign born residents:
| Here: | 32.1% |
| Palo Alto: | 31.6% |
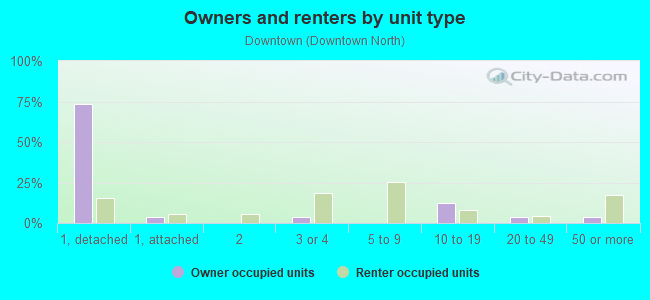
Owner-occupied
Renter-occupied

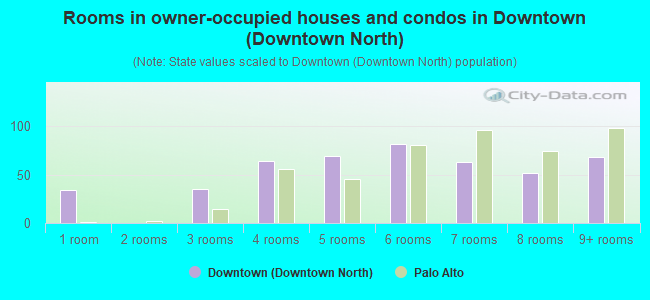
- Rooms in owner-occupied houses and condos in Downtown <
> - 341 room
- 02 rooms
- 353 rooms
- 644 rooms
- 695 rooms
- 826 rooms
- 637 rooms
- 528 rooms
- 689+ rooms
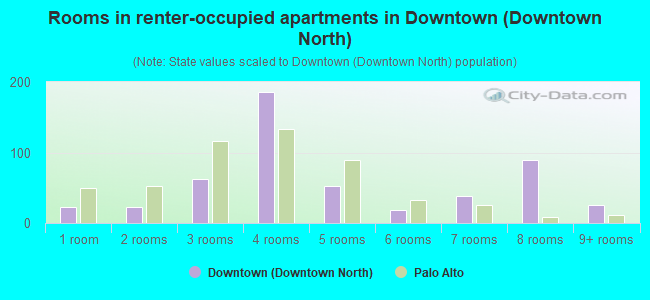
- Rooms in renter-occupied apartments in Downtown <
> - 221 room
- 222 rooms
- 633 rooms
- 1864 rooms
- 525 rooms
- 196 rooms
- 397 rooms
- 898 rooms
- 259+ rooms
Owner-occupied
Renter-occupied
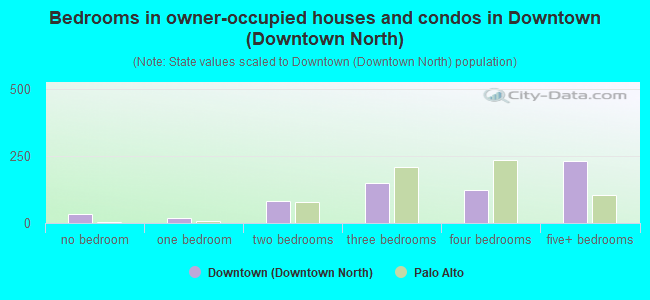
- Bedrooms in owner-occupied houses and condos in Downtown <
> - 34no bedroom
- 181 bedroom
- 842 bedrooms
- 1483 bedrooms
- 1254 bedrooms
- 2305+ bedrooms
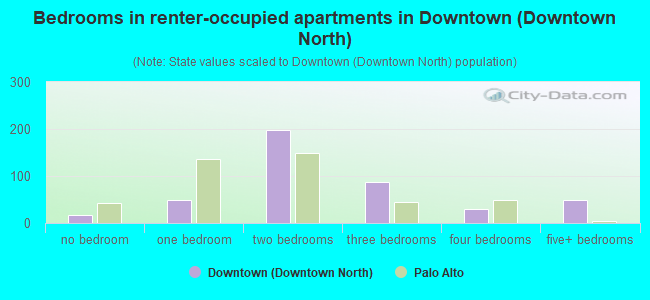
- Bedrooms in renter-occupied apartments in Downtown <
> - 16no bedroom
- 491 bedroom
- 1972 bedrooms
- 873 bedrooms
- 304 bedrooms
- 485+ bedrooms
Average number of cars or other vehicles available in houses/condos:
Average number of cars or other vehicles available in apartments:
| This neighborhood: | 1.9 |
| Palo Alto: | 2.1 |
Average number of cars or other vehicles available in apartments:
| Here: | 1.1 |
| city: | 1.1 |
Percentage of units with a mortgage:
| Downtown (Downtown North): | 69.0% |
| Palo Alto: | 58.3% |
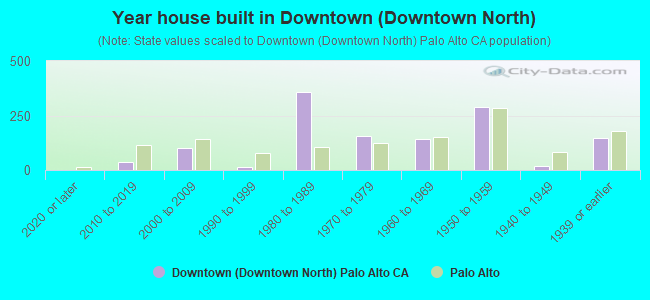
- Year house built in Downtown <
> - 02020 or later
- 382010 to 2019
- 1032000 to 2009
- 151990 to 1999
- 3561980 to 1989
- 1551970 to 1979
- 1441960 to 1969
- 2911950 to 1959
- 201940 to 1949
- 1491939 or earlier
City-data.com crime index for city in 2020 (higher means more crime):
| City: | 180.8 |
| U.S. average: | 219.5 |
Travel time to work (commute)
![Travel time to work (commute)]()
- 10Less than 5 minutes
- 255 to 9 minutes
- 8410 to 14 minutes
- 11315 to 19 minutes
- 11520 to 24 minutes
- 4425 to 29 minutes
- 5730 to 34 minutes
- 735 to 39 minutes
- 2340 to 44 minutes
- 4745 to 59 minutes
- 1860 to 89 minutes
- 890 or more minutes

Means of transportation to work
![Means of transportation to work]()
- 36.6%433Drove a car alone
- 1.4%16Carpooled
- 0.1%1Bus
- 0.3%3Subway or elevated rail
- 2.8%33Long-distance train or commuter rail
- 2.5%30Motorcycle
- 10.1%119Bicycle
- 4.8%57Walked
- 0.3%3Other means
- 47.7%565Worked at home

Time leaving home to go to work
![Time leaving home to go to work]()
- 612:00 a.m. to 4:59 a.m.
- 35:30 a.m. to 5:59 a.m.
- 116:00 a.m. to 6:29 a.m.
- 176:30 a.m. to 6:59 a.m.
- 247:00 a.m. to 7:29 a.m.
- 597:30 a.m. to 7:59 a.m.
- 1138:00 a.m. to 8:29 a.m.
- 1038:30 a.m. to 8:59 a.m.
- 859:00 a.m. to 9:59 a.m.
- 5710:00 a.m. to 10:59 a.m.
- 2711:00 a.m. to 11:59 a.m.
- 1312:00 p.m. to 3:59 p.m.
- 234:00 p.m. to 11:59 p.m.

Occupations of males:
- Percentage of males in management occupations (except farmers):
Here: 31.4% city: 19.1%
- Percentage of males in business and financial operations occupations:
Here: 4.7% city: 7.0%
- Percentage of males in computer and mathematical occupations:
Here: 18.2% city: 22.2%
- Percentage of males in architecture and engineering occupations:
Here: 2.0% city: 10.1%
- Percentage of males in life, physical, and social science occupations:
Here: 5.5% city: 6.4%
- Percentage of males in community and social services occupations:
Here: 1.2% city: 0.8%
- Percentage of males in legal occupations:
Here: 7.1% city: 2.5%
- Percentage of males in education, training, and library occupations:
Here: 8.6% city: 7.2%
- Percentage of males in healthcare practitioners and technical occupations:
Here: 3.3% city: 4.6%
- Percentage of males in service occupations:
Here: 9.5% city: 4.5%
- Percentage of males in sales and office occupations:
Here: 2.4% city: 5.7%
- Percentage of males in construction, extraction, and maintenance occupations:
Here: 2.0% city: 1.7%
- Percentage of males in production occupations:
Here: 4.5% city: 1.4%
- Percentage of males in transportation occupations:
Here: 1.2% city: 0.9%
Occupations of females:
- Percentage of females in management occupations (except farmers):
Here: 22.6% city: 19.0%
- Percentage of females in business and financial operations occupations:
Here: 14.7% city: 8.3%
- Percentage of females in computer and mathematical occupations:
Here: 11.2% city: 8.6%
- Percentage of females in life, physical, and social science occupations:
Here: 7.2% city: 6.8%
- Percentage of females in community and social services occupations:
Here: 1.2% city: 1.3%
- Percentage of females in education, training, and library occupations:
Here: 26.0% city: 12.9%
- Percentage of females in healthcare practitioners and technical occupations:
Here: 3.4% city: 8.7%
- Percentage of females in service occupations:
Here: 1.5% city: 8.4%
- Percentage of females in sales and office occupations:
Here: 10.1% city: 11.7%
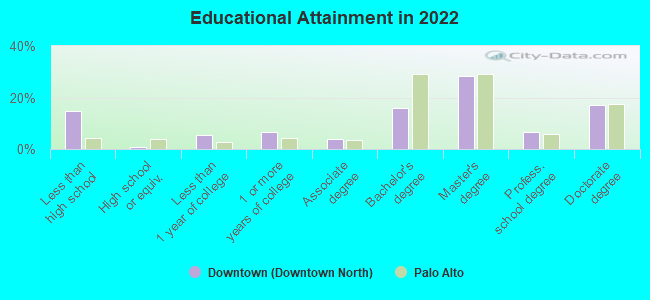
Education in this neighborhood (subdivision or community):
- Percentage of people 3 years and older in K-12 schools:
Downtown (Downtown North): 23.1% Palo Alto: 14.2%
- Percentage of people 3 years and older in undergraduate colleges:
Downtown (Downtown North): 1.6% Palo Alto: 2.4%
- Percentage of people 3 years and older in grad. or professional schools:
Downtown (Downtown North): 22.1% Palo Alto: 2.8%
- Percentage of students K-12 enrolled in private schools:
Downtown (Downtown North): 11.9% Palo Alto: 22.1%
Percentage of population below poverty level:
| Downtown (Downtown North): | 3.9% |
| Palo Alto: | 4.5% |
Median year owner moved in (as recorded in 2022):
Median year renter moved in (as recorded in 2022):
| Downtown (Downtown North): | 2003 |
| Palo Alto: | 2001 |
Median year renter moved in (as recorded in 2022):
| Downtown (Downtown North): | 2019 |
| Palo Alto: | 2019 |
Percentage of married-couple families with both working:
| Downtown (Downtown North): | 61.7% |
| Palo Alto: | 68.5% |
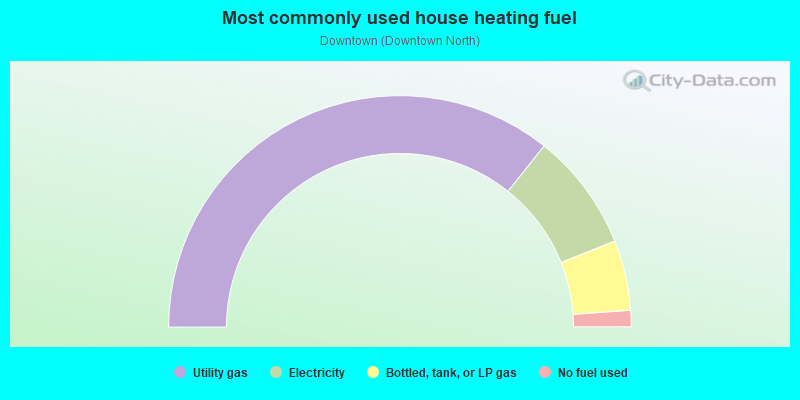
- 71.4%Utility gas
- 16.5%Electricity
- 9.8%Bottled, tank, or LP gas
- 2.3%No fuel used
Other features:
San Francisquito Crk
Length: 0.01 miles
Direction: N-S
Direction: N-S
Roads and streets:
Everett Ave
Length: 0.65 miles
Directions: E-W, SW-NE
Address range: 140 to 699
Directions: E-W, SW-NE
Address range: 140 to 699
Hawthorne Ave
Length: 0.65 miles
Directions: E-W, SW-NE
Address range: 141 to 699
Directions: E-W, SW-NE
Address range: 141 to 699
Lytton Ave
Length: 0.64 miles
Direction: SW-NE
Address range: 150 to 699
Direction: SW-NE
Address range: 150 to 699
Palo Alto Ave
Length: 0.60 miles
Directions: E-W, N-S, SE-NW, SW-NE
Address range: 200 to 699
Directions: E-W, N-S, SE-NW, SW-NE
Address range: 200 to 699
Cowper St
Length: 0.37 miles
Direction: SE-NW
Address range: 100 to 399
Direction: SE-NW
Address range: 100 to 399
Waverley St
Length: 0.34 miles
Direction: SE-NW
Address range: 100 to 399
Direction: SE-NW
Address range: 100 to 399
Bryant St
Length: 0.33 miles
Direction: SE-NW
Address range: 100 to 399
Direction: SE-NW
Address range: 100 to 399
Webster St
Length: 0.32 miles
Direction: SE-NW
Address range: 100 to 399
Direction: SE-NW
Address range: 100 to 399
Emerson St
Length: 0.32 miles
Directions: E-W, SE-NW
Address range: 100 to 399
Directions: E-W, SE-NW
Address range: 100 to 399
Byron St
Length: 0.30 miles
Direction: SE-NW
Address range: 100 to 399
Direction: SE-NW
Address range: 100 to 399
Middlefield Rd
Length: 0.26 miles
Directions: E-W, SE-NW
Address range: 100 to 399
Directions: E-W, SE-NW
Address range: 100 to 399
Ruthven Ave
Length: 0.23 miles
Direction: SW-NE
Address range: 400 to 599
Direction: SW-NE
Address range: 400 to 599
Ramona St
Length: 0.20 miles
Direction: SE-NW
Address range: 200 to 399
Direction: SE-NW
Address range: 200 to 399
Kipling St
Length: 0.20 miles
Direction: SE-NW
Address range: 200 to 399
Direction: SE-NW
Address range: 200 to 399
High St
Length: 0.20 miles
Direction: SE-NW
Address range: 200 to 399
Direction: SE-NW
Address range: 200 to 399
Bryant Ct
Length: 0.12 miles
Direction: SW-NE
Address range: 300 to 399
Direction: SW-NE
Address range: 300 to 399
Tasso St
Length: 0.12 miles
Direction: SE-NW
Address range: 100 to 199
Direction: SE-NW
Address range: 100 to 199
Everett Ct
Length: 0.12 miles
Direction: SW-NE
Address range: 501 to 599
Direction: SW-NE
Address range: 501 to 599
Poe St
Length: 0.12 miles
Direction: SW-NE
Address range: 300 to 399
Direction: SW-NE
Address range: 300 to 399
Ln 15 E
Length: 0.10 miles
Direction: SE-NW
Address range: 200 to 299
Direction: SE-NW
Address range: 200 to 299
Ln 33
Length: 0.09 miles
Directions: E-W, SW-NE
Address range: 100 to 499
Directions: E-W, SW-NE
Address range: 100 to 499
Other features:
San Francisquito Crk
Length: 0.10 miles
Directions: N-S, SW-NE
Directions: N-S, SW-NE